. 2025 Aug;24(8):e70097.
doi: 10.1111/acel.70097. Epub 2025 May 15.

Single-Cell RNA-Seq Reveals Aging-Related Impairment of Microglial Efferocytosis Contributing to Apoptotic Cells Accumulation After Retinal Injury

Affiliations

Single-Cell RNA-Seq Reveals Aging-Related Impairment of Microglial Efferocytosis Contributing to Apoptotic Cells Accumulation After Retinal Injury

Pan Liu et al. Aging Cell. 2025 Aug.

Abstract

Aging is associated with increased retinal cell apoptosis, which contributes to decreases in retinal function. Apoptotic retinal cell clearance relies on microglial efferocytosis, but the impact of aging on this process has not been fully elucidated. In this study, we aimed to shed light on this by using single-cell RNA sequencing (sc-RNA-seq) to compare young and aged mouse retinal transcriptional profiles, in which 74,412 retinal cells from young and aged mice were classified into 10 transcriptionally distinct retinal cell types, and differentially expressed genes between young versus aged retinas were mainly associated with cellular senescence and apoptosis. Furthermore, ligand-receptor interactions (e.g., AXL-GAS6, MERTK-GAS6) between microglia and other retinal cells were strengthened in aged, compared to young retinas. Additionally, among microglia, Subcluster 4 was found under partial clustering to be associated with efferocytosis, of which aged microglia had downregulated efferocytosis-associated genes. The impact of aging on microglial efferocytosis was further verified in vitro by doxorubicin (DOX)-induced senescent BV2 microglia, and in vivo by a retinal ischemia/reperfusion (I/R) injury mouse model. In vitro, DOX-treated BV2 microglia had significantly lowered efferocytosis, as well as efferocytosis-related MerTK and Axl protein expression; this was also present in vivo in aged retinas post-I/R injury, with increased co-localization of ionized calcium-binding adapter molecule 1+ microglia with apoptotic retinal cells, along with reduced efferocytosis-related protein expression. Overall, microglial efferocytosis of apoptotic cells decreased with aging, suggesting that modulating this process could serve as a possible therapeutic target for age-related retinal diseases.

Keywords: aging; apoptosis; efferocytosis; microglia; retina; single‐cell RNA sequencing.


Conflict of interest statement

The authors declare no conflicts of interest.

Figures

FIGURE 1
FIGURE 1
Identification of different retinal cell types using single‐cell RNA sequencing (sc‐RNA‐seq). (a) Flowchart depicting the sc‐RNA‐seq workflow for 3 young and 3 aged mouse retinas. (b) Uniform manifold approximation and projection (UMAP) plot of the transcriptional profiles from 74,412 retinal cells from the 3 young and 3 aged retina samples, falling into 35 clusters. (c) Clustering analysis further categorized the retinal cells into 10 different cell types (amacrine, astrocyte, bipolar, cone, horizontal, microglia, Müller, retinal ganglion [RGC], rod, and vascular endothelial [VEC]), based on canonical cell markers. (d) Violin plots of expression levels (logarithmic‐scale) for the canonical cell markers associated with the 10 different retinal cell types. n = 3/group.
FIGURE 2
FIGURE 2
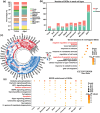
Differentially expressed gene (DEG) analysis between 10 different cell types from young and aged retinas. Stacked bar graphs, depicting (a) percentages of the 10 retinal cell types between young and aged retinas, as well as (b) up‐ and downregulated DEGs for each retinal cell type in aged, compared to young retinas. (c) Heatmap showing overlapping DEGs among the 10 retinal cell types. Bubble plots of (d) Gene Ontology (GO) enrichment analysis of overlapped DEGs, as well as (e) Kyoto Encyclopedia of Genes and Genomes (KEGG) enrichment analysis of DEGs from the 10 retinal cell types, among aged versus young retinas. n = 3/group.
FIGURE 3
FIGURE 3
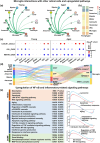
Aged microglia had increased cell–cell communication with other retinal cells and upregulation of inflammatory‐related signaling pathways. (a) Network plots and (b) heatmap depicting the number of interactions between microglia and other retinal cell types in young and aged retinas. (c) Bubble plot showing the strength of interactions between efferocytosis‐related ligands (CX3CL1, GAS6) on other retinal cell types and microglial receptors (CX3CR1, AXL, MERTK) in young and aged retinas. (d) Sankey plot showing interactions between microglia and other retinal cell types in aged retinas. (e) Gene set enrichment analysis (GSEA) between young and aged microglia, depicting significantly enriched terms with their normalized enrichment scores (NES) (left), as well as enrichment plots for selected terms in microglia (right). n = 3/group.
FIGURE 4
FIGURE 4
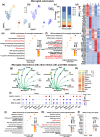
Partial cell clustering analysis revealed that aged microglial Subcluster 4 was associated with efferocytosis; this subcluster also had increased intercellular interactions with other retinal cells and downregulation of efferocytosis‐related DEGs. UMAP plots of 259 young and aged microglia, showing (a) five microglia subclusters (0–4), as well as (b) distinguishing between young and aged microglia. (c) Stacked bar graph showing percentages of the five subclusters between young and aged microglia. (d) Heatmap showing the top 10 marker genes used to identify each of the five microglial subclusters. Bubble plots of (e) KEGG and (f) GO enrichment analyses of DEGs from microglial Subcluster 4. (g) Network plots and (h) heatmap depicting the frequency of communications between Subcluster 4 microglia and other retinal cell types, in young and aged retinas. (i) Bubble plot showing the strength of interactions between efferocytosis‐related ligands on other retinal cell types and Subcluster 4 microglial receptors, in young and aged retinas. Bubble plots of KEGG enrichment analyses for (j) up‐ and (k) downregulated DEGs in aged Subcluster 4 microglia, as well as (l) Bubble plot showing efferocytosis‐related gene expression between young and aged Subcluster 4 microglia. n = 3/group.
FIGURE 5
FIGURE 5
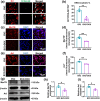
Doxorubicin (DOX)‐treated senescent BV2 murine microglia had lowered efferocytosis of apoptotic retinal cells in an in vitro model. (a) Representative immunofluorescence staining images and (b) quantification of Dil+carboxyfluorescein diacetate (CFDA)+ cells, representing successful efferocytosis of apoptotic (induced by H2O2) CFDA+ R28 rat retinal cells by Dil+ BV2 microglia, as a percentage of total Dil+, between untreated control (BV2) and DOX‐treated senescent BV2 (BV2 + DOX) groups. (c) Representative immunofluorescence images and (d) quantification of mean fluorescence intensity for proto‐oncogene tyrosine‐protein kinase MER (MerTK)+ cells between the two groups. Nuclei were stained with 4′,6‐diamidino‐2‐phenylindole (DAPI). (e) Representative immunofluorescence images and (f) quantification of mean fluorescence intensity for Axl+ between the two groups. (g) Representative Western blot image, as well as quantification of (h) MerTK and (i) Axl protein expression levels between the two groups. Protein expression was normalized to β‐Actin. Data are expressed as mean ± standard error of the mean (SEM). n = 3/group. *p < 0.05, **p < 0.01.
FIGURE 6
FIGURE 6
Aged retinas, compared to young, had increased apoptotic cells and lowered microglial efferocytosis post‐ischemia/reperfusion (I/R) injury in an in vivo mouse model. (a) Representative immunofluorescence images and (b) quantification of apoptotic terminal deoxynucleotidyl transferase dUTP nick end labeling (TUNEL)+ retinal cells between young (Young I/R) and aged (Aged I/R) retinas post‐I/R injury. Nuclei were stained with DAPI. (c) Representative Western blot images, as well as quantification of (d) pro‐apoptotic Bax, (e) anti‐apoptotic Bcl‐2, and (f) Bax/Bcl‐2 protein levels between the two groups. (g) Representative immunofluorescence images and (h) quantification of growth arrest‐specific 6 (Gas6)+TUNEL+ within the ganglion cell layer for the two groups. (i) Representative Western blot image and (j) quantification of Gas6 protein expression between the two groups. (k) Representative immunofluorescence images and (l) quantification of ionized calcium‐binding adapter molecule 1 (Iba‐1)+ microglia co‐localized with apoptotic TUNEL+ retinal cells, out of all Iba‐1+, on Day 3 post‐I/R injury, between young and aged retinas. (m) Representative immunofluorescence images and (n) quantification of Iba‐1+MerTK+, out of all Iba‐1+ microglia, between the two groups. (o) Representative Western blot image and (p) quantification of MerTK protein expression between the two groups. (q) Representative Western blot image and (r) quantification of Axl protein expression between the two groups. Protein expression was normalized to β‐actin. Data are expressed as mean ± SEM. n = 3/group. *p < 0.05, **p < 0.01, ***p < 0.001.

Similar articles

References

    1. Aprahamian, T. , Takemura Y., Goukassian D., and Walsh K.. 2008. “Ageing Is Associated With Diminished Apoptotic Cell Clearance In Vivo.” Clinical and Experimental Immunology 152, no. 3: 448–455. - PMC - PubMed
    1. Blander, J. M. 2017. “The Many Ways Tissue Phagocytes Respond to Dying Cells.” Immunological Reviews 277, no. 1: 158–173. - PMC - PubMed
    1. Boada‐Romero, E. , Martinez J., Heckmann B. L., and Green D. R.. 2020. “The Clearance of Dead Cells by Efferocytosis.” Nature Reviews. Molecular Cell Biology 21, no. 7: 398–414. - PMC - PubMed
    1. Burstyn‐Cohen, T. , and Fresia R.. 2023. “TAM Receptors in Phagocytosis: Beyond the Mere Internalization of Particles.” Immunological Reviews 319, no. 1: 7–26. - PubMed
    1. Chen, J. , Zhang Q., Xu W., et al. 2024. “Baicalein Upregulates Macrophage TREM2 Expression via TrKB‐CREB1 Pathway to Attenuate Acute Inflammatory Injury in Acute‐On‐Chronic Liver Failure.” International Immunopharmacology 139: 112685. - PubMed