. 2025 May 28;12(5):ENEURO.0575-24.2025.
doi: 10.1523/ENEURO.0575-24.2025. Print 2025 May.

Firing Activities of REM- and NREM-Preferring Neurons Are Differently Modulated by Fast Network Oscillations and Behavior in the Hippocampus, Prelimbic Cortex, and Amygdala

Affiliations

Firing Activities of REM- and NREM-Preferring Neurons Are Differently Modulated by Fast Network Oscillations and Behavior in the Hippocampus, Prelimbic Cortex, and Amygdala

Risa Kajiya et al. eNeuro. .

Abstract

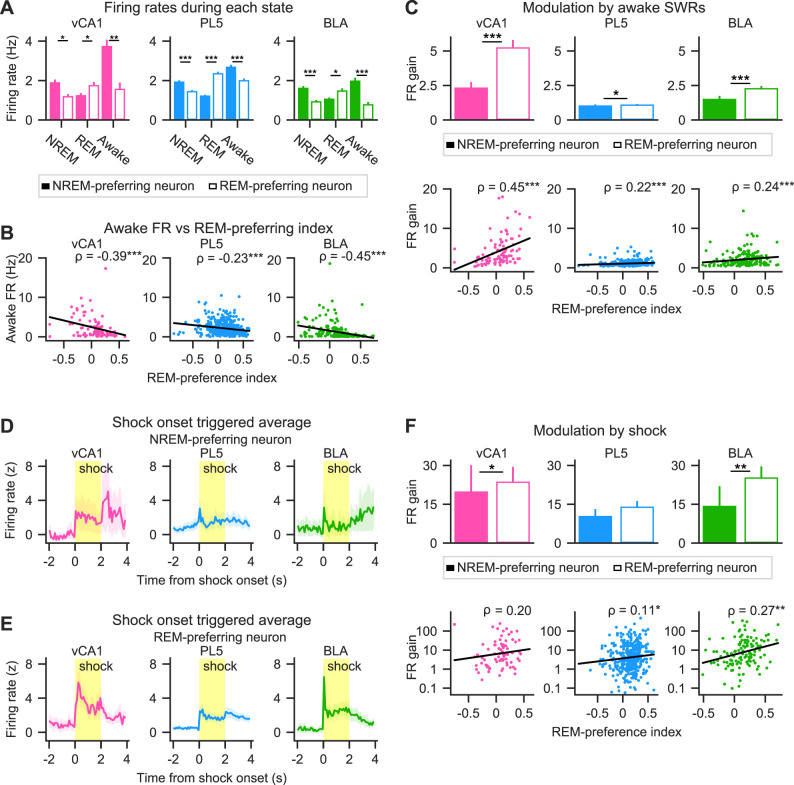
Sleep consists of two alternating states-rapid eye movement (REM) and non-REM (NREM) sleep. Neurons adjust their firing activity based on brain state, however, the extent to which this modulation varies across neurons and brain regions remains poorly understood. This study analyzed previously acquired 17-h continuous recordings of single-unit activity and local field potentials in the ventral hippocampal CA1 region, prelimbic cortex layer 5, and basolateral nucleus of the amygdala of fear-conditioned rats. The findings indicate that more than half of the neurons fired faster during REM sleep than during NREM sleep, although a notable subset of neurons exhibited the opposite preference, firing preferentially during NREM sleep. During sleep, the overall firing activity of both REM- and NREM-preferring neurons decreased. However, fast network oscillations, including hippocampal sharp-wave ripples (SWRs), amygdalar high-frequency oscillations, cortical ripples, and cortical spindles, differentially modulated REM- versus NREM-preferring neurons. During wakefulness, REM-preferring neurons fired more slowly but were more intensely activated by SWRs and shock presentations than NREM-preferring neurons. Moreover, during fast network oscillations in sleep, neurons with similar REM/NREM preferences exhibited stronger within- and cross-regional coactivation than those with differing preferences. Conversely, during awake SWRs in fear conditioning sessions, neurons with different REM/NREM preferences showed stronger interregional coactivation than those with similar preferences. These findings suggest that the distinct activity patterns of REM- and NREM-preferring neurons, potentially reflecting different roles in memory, affect local and global networks differently, thereby balancing experience-dependent network modifications with sleep-dependent homeostatic regulation of neuronal excitability.

Keywords: REM sleep; cortical ripples; inter-regional coactivation; non-REM sleep; sharp-wave ripples; spindles.


Conflict of interest statement

The authors declare no competing financial interests.

Figures

Figure 1.
Figure 1.
NREM- and REM-preferring neurons in the vCA1, PL5, and BLA. A, Schematic of the experimental schedule. Adapted from Miyawaki and Mizuseki (2022) under a CC-BY 4.0 license. B, Mean firing rates (FRs) during NREM and REM sleep (left), REM-preference indices (red line in middle plots) with distributions of shuffled surrogates (histograms, bin label shuffling, n = 1,000), and mean FRs across NREM–REM–NREM triplets (right, n = 23 triplets for both example neurons) for two representative excitatory neurons in the vCA1. Neurons with REM-preference indices below the 2.5th percentile or above the 97.5th percentile of the surrogate distribution were classified as NREM-preferring (top) or REM-preferring (bottom), respectively. ***p < 0.001; p = 4.1 × 10−13 (top), p = 2.6 × 10−33 (bottom); Mann–Whitney U test. C, Comparison of mean FRs during NREM and REM sleep among NREM-preferring (black circles), REM-preferring (gray circles), and non-significant (orange triangles) excitatory neurons in the vCA1, PL5, and BLA. D, Mean FRs of all analyzed neurons in the vCA1, PL5, and BLA during NREM–REM–NREM triplets. FRs were Z-scored within each neuron; neurons are sorted by REM-preference indices. Excitatory and inhibitory neurons are shown above and below the white lines, respectively. Black arrows indicate the neurons shown in B. Bars on the right indicate NREM-preferring (colored), REM-preferring (hollow), and non-significant (gray) neurons. E, Proportions of NREM-preferring (colored), REM-preferring (hollow), and non-significant (gray) neurons among excitatory (left) and inhibitory (right) neurons. The numbers of NREM- and REM-preferring neurons are superimposed on each bar. F, Distributions of REM-preference indices for excitatory neurons in the vCA1, PL5, and BLA. REM-preference indices were calculated using all sleep epochs across all home cage (hc) and behavioral sessions. G, Comparisons of REM-preference indices for excitatory neurons calculated within each hc session. REM/NREM preferences were largely consistent across sessions. Each dot represents a single neuron. All excitatory neurons in the vCA1, PL5, and BLA are plotted together. Dot colors indicate neuron classification based on all concatenated sleep epochs, as in C–F. NREM-preferring (black), REM-preferring (gray), and non-significant (orange). For separate plots for each region, see Extended Data Figure 1-4. H, Spearman's rank-order correlation coefficients (ρ) of REM-preference indices across hc sessions for excitatory neurons in each region. All excitatory neurons in the vCA1, PL5, and BLA, including non-significant neurons, were included in the correlation analyses. *p < 0.05, **p < 0.01, ***p < 0.001. The number of neurons analyzed in C–H is summarized in Table 1. The total numbers of NREM–REM–NREM triplets used in D are reported in Extended Data Figure 1-2. Statistical details of H are summarized in Extended Data Figure 1-5.
Figure 2.
Figure 2.
Firing rate changes of NREM- and REM-preferring excitatory neurons across sleep. A, Mean firing rates (FRs) of excitatory neurons in the vCA1 (top row), PL5 (middle row), and BLA (bottom row) decreased over the course of sleep. Left and middle columns, Z-scored mean FRs during NREM epochs of extended sleep are plotted against time from sleep onset for NREM-preferring (left) and REM-preferring (middle) neurons. Each circle (filled for NREM-preferring, hollow for REM-preferring) represents the mean FR of an individual neuron during a single NREM epoch; the x-axis indicates the time from the onset of extended sleep to the midpoint of each epoch. Right column: Z-scored mean FRs across NREM epochs, grouped into 10 equally sized time bins. Regression lines (thick for NREM-preferring, thin for REM-preferring) were fitted to the data shown in the left and middle panels, respectively. Spearman's rank-order correlation coefficient (ρ) is displayed in the top right corner of each plot (bold for NREM-preferring, regular font for REM-preferring). **p < 0.01, ***p < 0.001. Error bars represent the standard error of the mean (SEM). B, Z-scored mean FRs during the first and last NREM epochs of extended sleep for vCA1 (top), PL5 (middle), and BLA (bottom). NREM-preferring (solid bars) and REM-preferring (hollow bars) neurons are shown separately. Error bars represent SEM. **p < 0.01, ***p < 0.001; Wilcoxon signed-rank test. C, Representative examples of SWRs, HFOs, cRipples, and spindles recorded from a rat. Top, Wideband and filtered local field potential (LFP) traces. Bottom, Spike timings of representative NREM-preferring (vivid colors) and REM-preferring (pale colors) neurons. Trace and dot colors denote brain regions (green for BLA, pink for vCA1, and light blue for PL5). Vertical lines indicate the onset and offset of each oscillatory event (green for HFOs, magenta for SWRs, cyan for cRipples, and gray for spindles). Note that the time window of the rightmost example is five times longer than those of the others. D–G, Comparison of FR changes during SWRs (D), HFOs (E), cRipples (F), or spindles (G) across sleep between NREM-preferring (filled bars) and REM-preferring (hollow bars) neurons. Mean FR changes between the first and last NREM epochs of extended sleep are shown. Error bars indicate SEM. *p < 0.05, **p < 0.01, ***p < 0.0011; Wilcoxon signed-rank test for within-group comparisons (colored) and Mann–Whitney U test for between-group comparisons (black). Details of the statistical tests are provided in Extended Data Figure 2-1. The durations and occurrence rates of network oscillatory events are summarized in Extended Data Figure 2-2.
Figure 3.
Figure 3.
Modulation of NREM- and REM-preferring excitatory neuron activity by fast network oscillations during sleep. A, Firing rates (FRs) of representative neurons aligned to the power peaks of SWRs, HFOs, cRipples, or spindles. Perievent FR aligned with the power peak of each oscillatory event is color coded and sorted by FR peak. The red line represents the mean FR across oscillatory events. The FR gain during the corresponding oscillation events is indicated at the top of each panel. Additional representative examples are shown in Extended Data Figure 3-1. B–E, FR gains during SWRs (B), HFOs (C), cRipples (D), and cortical spindles (E). Top panels, Mean FR gains of NREM-preferring (solid bars) and REM-preferring (hollow bars) neurons. Error bars represent the standard error of the mean (SEM). Bottom panels, Relationship between REM-preference indices and FR gains. Each dot represents a single neuron. All neurons—NREM-preferring, REM-preferring, and non-significant—are included in the plots, except for a single outlier in the middle and right bottom panels of D, which is beyond the plotted y-axis range. Nevertheless, all data points, including outliers, were included in the statistical analyses. Linear regression lines are shown in black, and Spearman's rank-order correlation coefficient (ρ) is presented in the top right of each panel. *p < 0.05, **p < 0.01, ***p < 0.001; Mann–Whitney U test was used for group comparisons in the top panels, and significance of Spearman's rank-order correlation was used for statistical testing in the bottom panels. The number of neurons included in each analysis is summarized in Table 1, and full statistical details are provided in Extended Data Figure 3-2.
Figure 4.
Figure 4.
Within-regional coactivity of excitatory neuron pairs during fast network oscillations in sleep. A, Coactivation of example neuron pairs during SWRs, HFOs, cRipples, or spindles. The black curve represents the theoretical distribution of coactivation event numbers under the null hypothesis of independent firing (see Materials and Methods for details). The observed number of coactivation events is indicated by the red vertical line, and the corresponding coactivity Z-score is displayed next to the line. Example neuron pairs with similar or opposing sleep-state preferences are shown in top and bottom plots, respectively. For more examples, see Extended Data Figure 4-1. B–E, Coactivity Z-scores for SWRs (B), HFOs (C), cRipples (D), and spindles (E), computed for excitatory neuron pairs within the vCA1 (pink, left), PL5 (light blue, middle), and BLA (green, right). Top panels, Mean coactivity Z-scores are shown for each neuron pair type. Error bars represent the standard error of the mean (SEM). Bottom panels, Relationship between the product of REM-preference indices of each neuron pair and corresponding coactivity Z-score. All neuron pairs—including NN, RR, NR, and pairs containing non-significant neurons—are shown. Each dot represents a single neuron pair. Linear regression lines are shown in black, and Spearman's rank-order correlation coefficient (ρ) is indicated in the top right of each panel. *p < 0.05, **p < 0.01, ***p < 0.001; post hoc Steel–Dwass test following the Kruskal–Wallis test for the top panels and significance of the Spearman's rank-order correlation for the bottom panels. Pairs containing non-significant neurons were included in the correlation analyses. The number of neuron pairs analyzed and details of the statistical tests are provided in Extended Data Figure 4-2. NN, NREM-preferring neuron pairs; RR, REM-preferring neuron pairs; NR, pairs of NREM- and REM-preferring neurons.
Figure 5.
Figure 5.
Within-regional coactivity of excitatory neuron pairs during fast network oscillations in sleep. A–D, Cross-regional coactivity Z-scores for (A) SWRs, (B) HFOs, (C) cRipples, and (D) cortical spindles for neuron pairs spanning vCA1–PL5 (left), vCA1–BLA (middle), and PL5–BLA (right). Data are shown separately for each pair type. Top panels, Mean coactivity Z-scores for each pair type. Error bars represent the standard error of the mean (SEM). Bottom panels, Relationship between the product of REM-preference indices and coactivity Z-score for each neuron pair. Each dot represents a single neuron pair. All pair types—including those containing non-significant neurons—are included. Black lines represent linear regressions; Spearman's rank-order correlation coefficient (ρ) is shown in the top right corner of each plot. *p < 0.05, **p < 0.01, ***p < 0.001; top panels, post hoc Steel–Dwass test following Kruskal–Wallis test; bottom panels, significance of Spearman's rank-order correlation. E–H, NREM-preferring neuron response indices for SWRs (E), HFOs (F), cRipples (G), and cortical spindles (H). Solid bars indicate NREM-preferring neurons; hollow bars indicate REM-preferring neurons. Error bars represent SEM. *p < 0.05, **p < 0.01, ***p < 0.001; Mann–Whitney U test. Details of all statistical analyses are provided in Extended Data Figure 5-1. NN, NREM-preferring neuron pairs; RR, REM-preferring neuron pairs; NR and RN, pairs of NREM- and REM-preferring neurons, where the order of “N” and “R” corresponds to the order of the brain regions of the constituent neurons.
Figure 6.
Figure 6.
Activity of NREM- and REM-preferring excitatory neurons during wakefulness. A, Mean firing rates (FRs) across behavioral states. During wakefulness, NREM-preferring neurons (filled bars) showed significantly higher FRs than REM-preferring neurons (hollow bars). Error bars represent standard error of the mean (SEM). *p < 0.05, **p < 0.01, ***p < 0.001; Mann–Whitney U test. B, Relationship between FRs during wakefulness and REM-preference indices. Each dot represents a single neuron. All neurons—including NREM-preferring, REM-preferring, and non-significant—are plotted and included in the Spearman's rank-order correlation analysis. ***p < 0.001. C, REM-preferring neurons exhibited greater FR gains during awake SWRs than NREM-preferring neurons. Top, FR gains during awake SWRs. Error bars represent SEM. Bottom, Relationship between FR gains during awake SWRs and REM-preference indices. Each dot represents a single neuron; all neurons are plotted and included in the Spearman's rank-order correlation analysis. *p < 0.05, ***p < 0.001; Mann–Whitney U test (top), significance of Spearman's rank-order correlation (bottom). D, E, Shock onset-triggered averages of FRs for NREM-preferring (D) and REM-preferring (E) neurons. Solid lines indicate mean FRs; shaded areas represent SEM. Yellow background highlights the shock delivery period. F, REM-preferring neurons in vCA1 and BLA displayed larger increases in firing during shock presentation compared with NREM-preferring neurons. Top, Mean FR gains during shock for NREM-preferring (filled bars) and REM-preferring (hollow bars) neurons. Error bars indicate SEM. Bottom, Relationship between FR gains during shocks and REM-preference indices. Each dot represents a single neuron; all neurons are plotted and included in the Spearman's rank-order correlation analysis. *p < 0.05, **p < 0.01; Mann–Whitney U test (top), Spearman's rank-order correlation (bottom). The number of neurons included in each analysis is summarized in Table 1. Statistical test details are provided in Extended Data Figure 6-1.
Figure 7.
Figure 7.
Inter-regional coactivity of excitatory neuron pairs during awake SWRs. Cross-regional coactivity during awake SWRs during the baseline (A) and conditioning (B) sessions for neuron pairs spanning vCA1–PL5 (left), vCA1–BLA (middle), and PL5–BLA (right). Top panels, Mean coactivity Z-scores for each neuron pair type (NN, RR, NR, and RN pairs). Error bars represent the standard error of the mean (SEM). Bottom panels, Relationship between the products of REM-preference indices and coactivity Z-scores. Each dot represents a single neuron pair, including NN, RR, NR, RN, and pairs containing non-significant neurons. Black lines indicate linear regression fits, and Spearman's rank-order correlation coefficients (ρ) are shown in the top right corner of each plot. *p < 0.05, **p < 0.01, ***p < 0.001; post hoc Steel–Dwass test following Kruskal–Wallis test (top panels) and significance of Spearman's rank-order correlation (bottom panels). Pairs with non-significant neurons were included in the correlation analyses. Details of the statistical tests are provided in Extended Data Figure 7-3.
Figure 8.
Figure 8.
Summary of differences between NREM-preferring and REM-preferring neurons. A, Activity modulation of NREM-preferring and REM-preferring neurons. REM-preferring neurons exhibited stronger activation during fast network oscillations (excluding cRipples) and responded more robustly to shock stimuli (highlighted with a pink background). In contrast, NREM-preferring neurons were more strongly activated by cRipples and showed higher average firing rates during wakefulness (violet background). B, Within-regional coactivity among NREM-preferring and REM-preferring neurons. NREM-preferring and REM-preferring neurons are illustrated as violet and pink triangles, respectively. Coactivity strength is indicated by the intensity of the connecting lines. During fast network oscillations in NREM sleep and during awake SWRs in both baseline and conditioning sessions, coactivity Z-scores positively correlated with the products of REM-preference indices in at least one brain region, with no significant negative correlations in any regions examined. These findings indicate stronger coactivation between neuron pairs with similar REM/NREM preferences (black lines) compared with those with differing preferences (gray lines). C, Cross-regional coactivity among NREM- and REM-preferring neurons. Neurons with the same or different background colors belong to the same or different brain regions, respectively. During fast network oscillations in NREM sleep and awake SWRs in the baseline session, coactivity Z-scores again positively correlated with the products of REM-preference indices in at least one brain region pair, with no significant negative correlations in any region pairs examined. In contrast, during awake SWRs in the conditioning session, correlations were significantly negative across all region pairs, indicating that neurons with differing REM/NREM preferences exhibited stronger coactivation than similarly tuned pairs. N and R represent NREM-preferring and REM-preferring neurons, respectively, in all panels.

Similar articles

References

    1. Aston-Jones G, Bloom FE (1981) Activity of norepinephrine-containing locus coeruleus neurons in behaving rats anticipates fluctuations in the sleep-waking cycle. J Neurosci 1:876–886. 10.1523/JNEUROSCI.01-08-00876.1981 - DOI - PMC - PubMed
    1. Azmitia EC, Buchan AM, Williams JH (1978) Structural and functional restoration by collateral sprouting of hippocampal 5-HT axons. Nature 274:374–376. 10.1038/274374a0 - DOI - PubMed
    1. Bandarabadi M, Herrera CG, Gent TC, Bassetti C, Schindler K, Adamantidis AR (2020) A role for spindles in the onset of rapid eye movement sleep. Nat Commun 11:5247. 10.1038/s41467-020-19076-2 - DOI - PMC - PubMed
    1. Barnes CA, McNaughton BL (1985) An age comparison of the rates of acquisition and forgetting of spatial information in relation to long-term enhancement of hippocampal synapses. Behav Neurosci 99:1040–1048. 10.1037/0735-7044.99.6.1040 - DOI - PubMed
    1. Barthó P, Hirase H, Monconduit L, Zugaro M, Harris KD, Buzsáki G (2004) Characterization of neocortical principal cells and interneurons by network interactions and extracellular features. J Neurophysiol 92:600–608. 10.1152/jn.01170.2003 - DOI - PubMed

LinkOut - more resources