. 2025 May 15;16(1):4530.
doi: 10.1038/s41467-025-59013-9.

Dominant control of temperature on (sub-)tropical soil carbon turnover

Affiliations

Dominant control of temperature on (sub-)tropical soil carbon turnover

Vera D Meyer et al. Nat Commun. .

Abstract

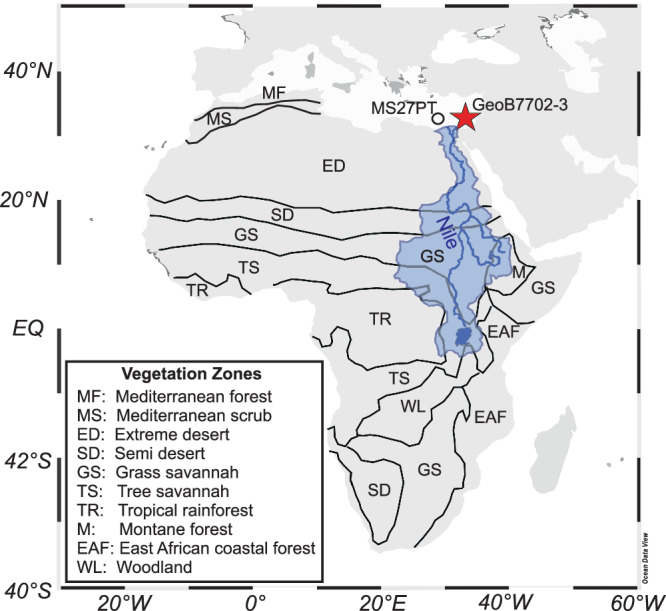
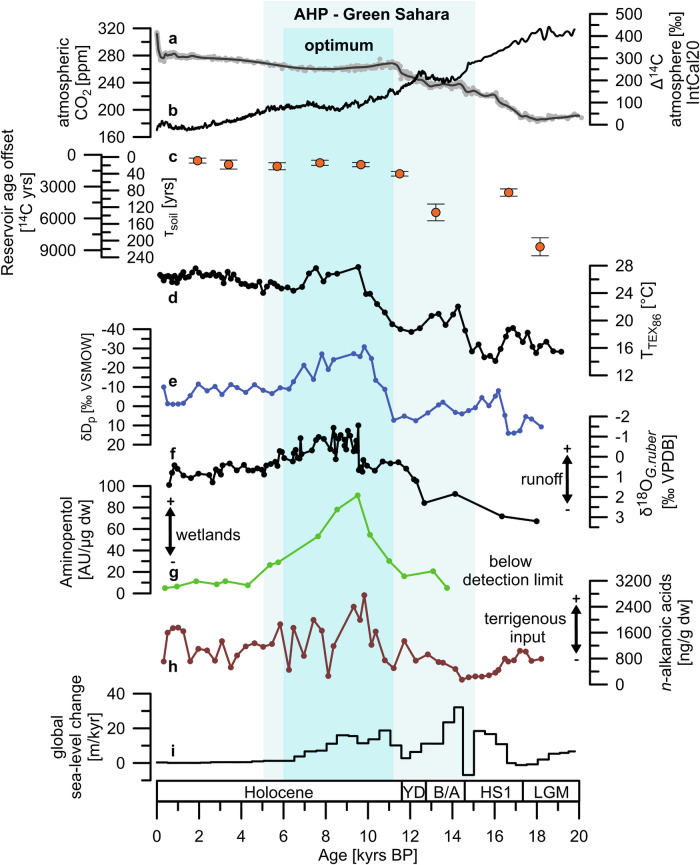
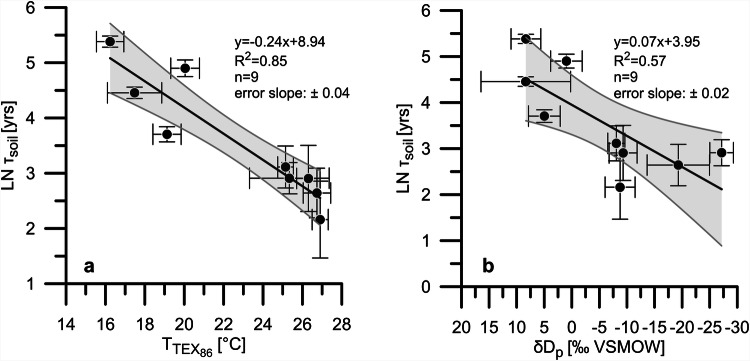
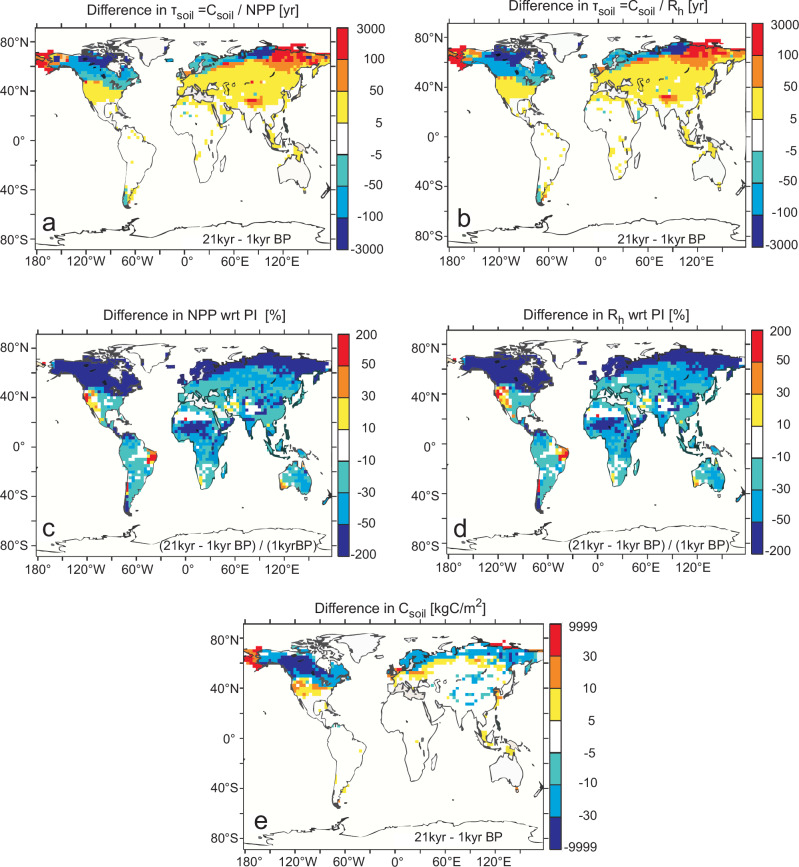
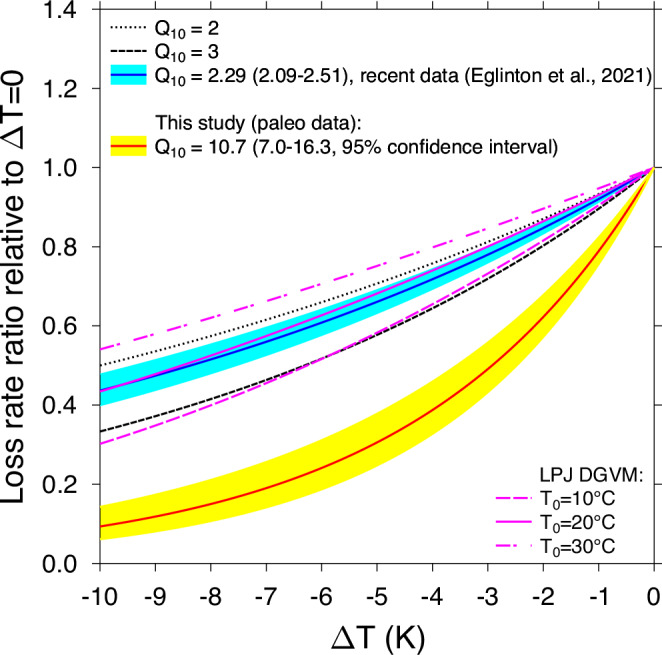
Carbon storage in soils is important in regulating atmospheric carbon dioxide (CO2). However, the sensitivity of the soil-carbon turnover time (τsoil) to temperature and hydrology forcing is not fully understood. Here, we use radiocarbon dating of plant-derived lipids in conjunction with reconstructions of temperature and rainfall from an eastern Mediterranean sediment core receiving terrigenous material from the Nile River watershed to investigate τsoilin subtropical and tropical areas during the last 18,000 years. We find that τsoil was reduced by an order of magnitude over the last deglaciation and that temperature was the major driver of these changes while the impact of hydroclimate was relatively small. We conclude that increased CO2 efflux from soils into the atmosphere constituted a positive feedback to global warming. However, simulated glacial-to-interglacial changes in a dynamic global vegetation model underestimate our data-based reconstructions of soil-carbon turnover times suggesting that this climate feedback is underestimated.


Conflict of interest statement

Competing interests: The authors declare no competing interests.

Figures

Fig. 1
Fig. 1. Map of the study area.
African vegetation zones are drawn after ref. . The Nile River catchment is marked by the blue shading. The red star indicates the study site GeoB7702-3.
Fig. 2
Fig. 2. Environmental changes in the Nile-River delta region during the past 18 kyrs.
a Ice-core CO2-contents given as indicator for atmospheric CO2 concentrations (gray dots: data points; black line: spline-smoothed record). b Atmospheric Δ14C contents according to IntCal20. c Reservoir age offsets (R) between the n-alkanoic acids and the atmosphere at the time of deposition at site GeoB7702-3 (this study). τsoil deduced from R of n-alkanoic acids. Error bars indicate the standard deviation. d Sea surface temperature reconstruction for the eastern Mediterranean based on the TEX86 proxy from core GeoB7702-3. e Hydrogen isotopic composition of precipitation (δDp) calculated from the δD of n-alkanoic acids from core GeoB7702-3 as proxy for rainfall amount. f Oxygen isotopic compositions of the planktic foraminifera species Globigerinoides ruber18OG.ruber) in core MS27PT (Fig. 1) indicating salinity changes in the eastern Mediterranean associated with freshwater runoff from the Nile River. g Aminopentol abundances in core GeoB7702-3 used as proxy for the extent of methane-producing wetlands in the catchment (this study). AU: arbitrary units; dw: dry weight of extracted sediment. Additional abundance profiles from the suite of amino-bacteriohopanepolyols are given in Supplementary Fig. 1. h Concentrations of n-alkanoic acids (Σn-C26:0, n-C28:0, n-C30:0, n-C32:0) reporting on the land-ocean transport of terrigenous organic matter. i Global rate of sea-level change over the last 20 kyrs. The blue bars mark the timing of the African Humid Period (AHP) and Green Sahara and their optimum,. LGM: Last Glacial Maximum, HS1: Heinrich Stadial 1, B/A: Bølling/Allerød interstadial, YD: Younger Dryas stadial.
Fig. 3
Fig. 3. Power–law relationships between τsoil and temperature and rainfall.
a Correlation with temperature estimates based upon the TEX86-proxy (TTEX86) from core GeoB7702-3. TTEX86 are adopted from ref. and interpreted to reflect sea surface temperature. b Correlation with the hydrogen isotopic composition of precipitation (δDp) which serves as proxy for rainfall amount. δDp is calculated from the hydrogen isotopic composition of n-alkanoic acids (n-C26:0 and n-C28:0 homologues) from core GeoB7702-3 and given relative to the Vienna Standard Mean Ocean Water (VSMOW). In a and b error bars represent the standard deviation (SD). The gray shadings represent the 95% confidence intervals (CI) and the error of the slope therefore contains 2σ. The p-values for the regressions are <0.05. The temperature sensitivity expressed as the Q10-value, i.e. the factor by which τsoil decreases per 10 °C temperature change,, can be deduced from the slope of the regression line in a using Eq. (2) leading to Q10 = 10.7 (7.0–16.3, 95% CI).
Fig. 4
Fig. 4. Recalculation of results from the Lund Potsdam Jena Dynamic Global Vegetation Model (LPJ DGVM) over the last 21 kyrs.
These LPJ results are from simulations identical to those that have been forced by the Hadley center climate model as discussed in ref. . Relative changes between the LGM and pre-industrial conditions (PI, here: 1 kyr BP) are shown. a τsoil calculated based on the carbon influx (net primary production (NPP)). b τsoil based on the carbon efflux (Rh), where Rh is the heterotrophic respiration. Large positive anomalies (red) occur on shelf areas inundated during deglacial sea-level rise, while the areas with large negative anomalies (blue) were covered by large continental ice sheets during the LGM. Calculating τsoil from net primary production (NPP) reveals similar results as the calculation from respiration fluxes (Rh) indicating that NPP and Rh are in equilibrium. c Relative changes in NPP. d Relative changes in Rh. e Absolute changes in soil carbon (Csoil).
Fig. 5
Fig. 5. Transferring our temperature-dependent soil carbon turnover time into the Q10 concept.
The relative carbon loss ratio (f/f0, where f0 is the efflux at ΔT = 0) as function of temperature anomaly is plotted for different Q10, including results based on recent data by Eglinton et al.. In addition the output of this soil carbon loss rate for the equation used in the LPJ DGVM is plotted for anomalies for three different temperature baselines (Eq. (23) in ref. .

Similar articles

References

    1. Lal, R. Soil carbon sequestration impact on global climate change and food security. Science304, 1623–1627 (2004). - PubMed
    1. Crisp, D. et al. How well do we understand the land-ocean-atmosphere carbon cycle? Rev. Geophys.60, 1–64 (2022).
    1. Wang, S. et al. Soil and vegetation carbon turnover times from tropical to boreal forests. Funct. Ecol.32, 71–82 (2018).
    1. Carvalhais, N. et al. Global covariation of carbon turnover times with climate in terrestrial ecosystems. Nature514, 213–217 (2014). - PubMed
    1. Davidson, E. A. & Janssens, I. A. Temperature sensitivity of soil carbon decomposition and feedbacks to climate change. Nature440, 165–173 (2006). - PubMed

LinkOut - more resources