. 2025 May 15;16(1):383.
doi: 10.1038/s41419-025-07659-0.

Autophagy- and oxidative stress-related protein deregulation mediated by extracellular vesicles of human MJD/SCA3 iPSC-derived neuroepithelial stem cells and differentiated neural cultures

Affiliations

Autophagy- and oxidative stress-related protein deregulation mediated by extracellular vesicles of human MJD/SCA3 iPSC-derived neuroepithelial stem cells and differentiated neural cultures

Liliana S Mendonça et al. Cell Death Dis. .

Abstract

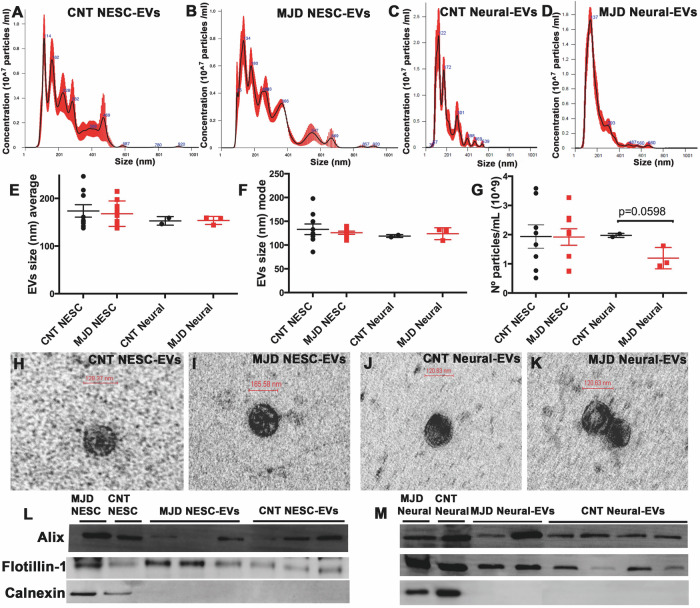
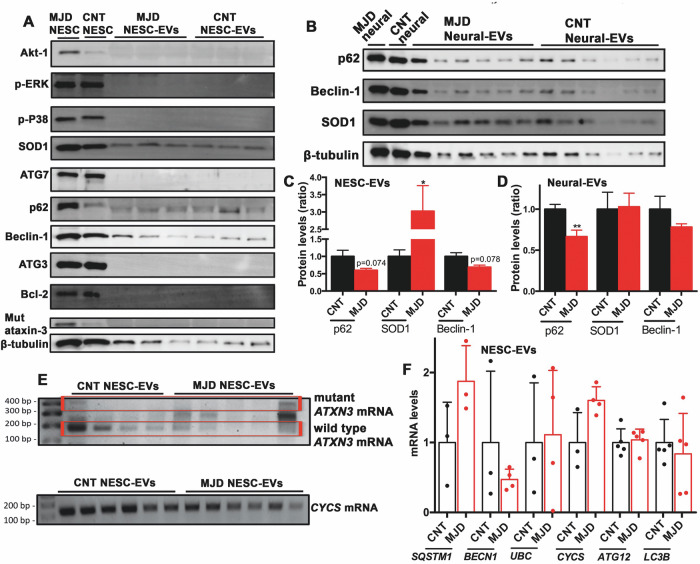
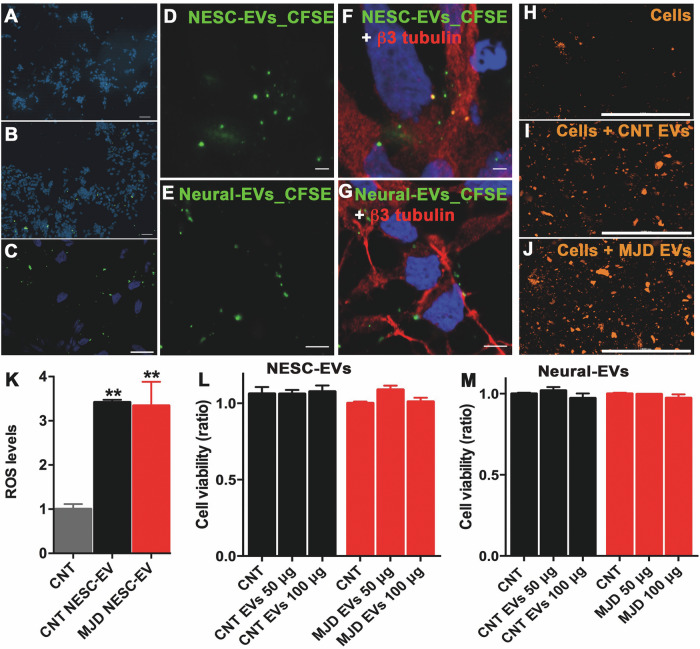
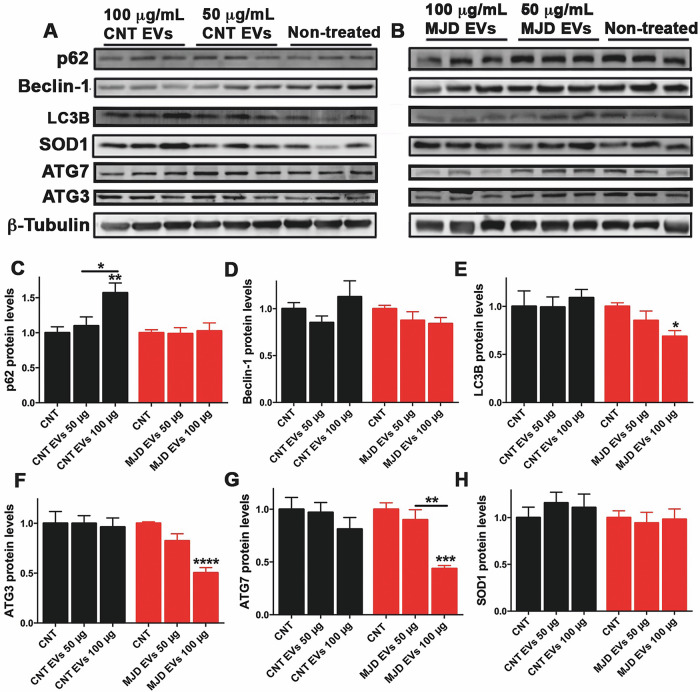
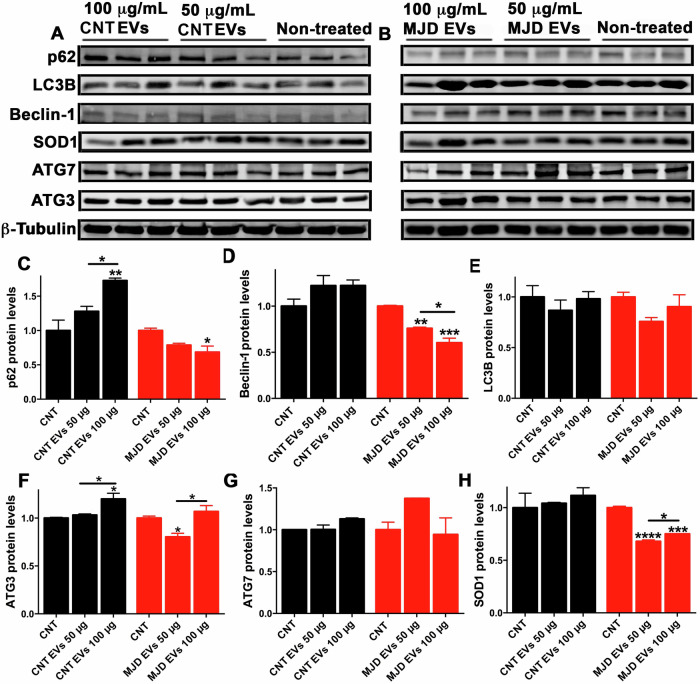
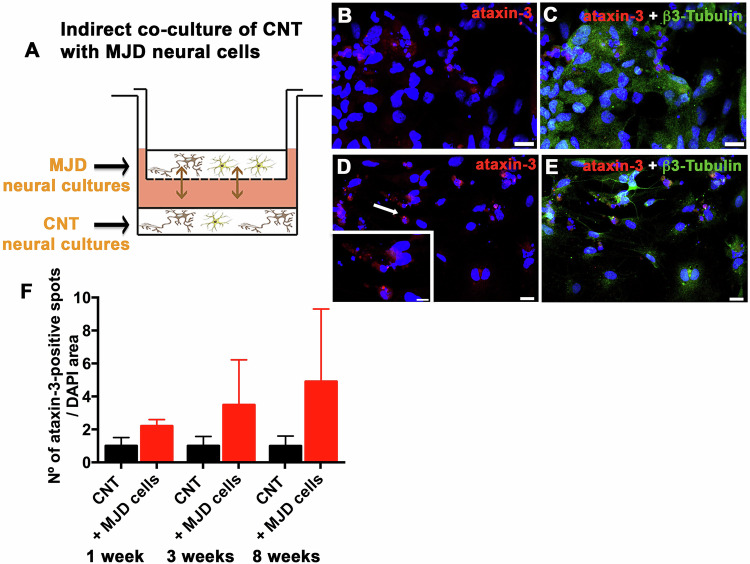
Extracellular vesicles (EVs) have been associated with the transport of molecules related to the pathological processes in neurodegenerative diseases. Machado-Joseph disease (MJD) is a neurodegenerative disorder triggered by mutant ataxin-3 protein that causes protein misfolding and aggregation resulting in neuronal death. To evaluate EVs' role in the potential spread of disease-associated factors in MJD, in this study, EVs were isolated from human Control (CNT) and MJD induced-pluripotent stem cell-derived neuroepithelial stem cells (iPSC-derived NESC) and their differentiated neural cultures (cell cultures composed of neurons and glia). EVs were characterized and investigated for their ability to interfere with cell mechanisms known to be impaired in MJD. The presence of mRNA and proteins related to autophagy, cell survival, and oxidative stress pathways, and the mutant ataxin-3, was evaluated in the EVs. SOD1, p62, and Beclin-1 were found present both in CNT and MJD EVs. Lower levels of the p62 autophagy-related protein and higher levels of the oxidative stress-related SOD1 protein were found in MJD EVs. The oxidative stress-related CYCS mRNA and autophagy-related SQSTM1, BECN1, UBC, ATG12, and LC3B mRNAs were detected in EVs and no significant differences in their levels were observed between CNT and MJD EVs. The internalization of EVs by human CNT neurons was demonstrated, and no effect of the EVs administration was observed on cell viability. Moreover, the incubation of MJD EVs (isolated from NESC or differentiated neural cultures) with human CNT differentiated neural cells resulted in the reduction of SOD1 and autophagy-related proteins ATG3, ATG7, Beclin-1, LC3B, and p62 levels. Finally, a tendency for accumulation of ataxin-3-positive aggregates in CNT differentiated neural cells co-cultured with MJD differentiated neural cells was observed. Overall, our data indicate that EVs carry autophagy- and oxidative stress-related proteins and mRNAs and provide evidence of MJD EVs-mediated interference with autophagy and oxidative stress pathways.


Conflict of interest statement

Competing interests: The authors declare no competing interests. Ethics approval and consent to participate: Human fibroblast isolation, for iPSC-derived NESC generation, was performed with informed consent obtained from all participants and was approved by the Ethics Committee of the Medical Faculty of the University of Coimbra, Portugal (Ref. CE-152/2011), and all methods were performed in accordance with the relevant guidelines and regulations, as previously described [57].

Figures

Fig. 1
Fig. 1. Characterization of MJD and CNT EVs obtained from human iPSC-derived NESC and their differentiated neural cell cultures.
EVs isolated from the culture media of A, B, EI, L iPSC-derived NESC (NESC-EVs) and C, D, EG, J, K, M neural cell cultures differentiated from iPSC-derived NESC (Neural-EVs) were characterized for their physical properties and the expression of positive and negative EVs’ markers. NESC-EVs from MJD and CNT cells were characterized for their A, B size distribution, E size average, F size mode, and G number of particles per mL with Nanoparticle Tracking Analysis (NTA). Size and morphology of H CNT and I MJD NESC-EVs evaluated by Transmission Electron Microscopy (TEM). L Western blot representative image showing Alix and Flotillin-1 (positive protein markers) and no Calnexin (negative marker) expression in CNT (CNT NESC-EVs) and MJD (MJD NESC-EVs) EVs, as compared with the cells of origin (MJD NESC and CNT NESC), n = 9. Neural-EVs from MJD and CNT cells were also compared for their C, D size distribution, E size average, F size mode, and G number of particles per mL with NTA. EG Data are expressed as mean ± SEM, unpaired t-test with Welch’s correction; NESC-EVs n = 7–8 and Neural-EVs n = 3. Size and morphology of J CNT and K MJD Neural-EVs analyzed by TEM. M Representative Western blot image showing that both CNT and MJD Neural-EVs expressed Alix and Flotillin-1 and no Calnexin was detected, as compared with the expression of these proteins in the cells of origin (MJD Neural and CNT Neural), n = 5–6.
Fig. 2
Fig. 2. Characterization of protein and RNA cargo in CNT and MJD EVs.
A The presence of a set of proteins related to autophagy (ATG7, ATG3, p62, and Beclin-1), cell survival (Akt-1, p-ERK, Bcl2, and p-P38), oxidative stress (SOD1), mutant ataxin-3 (Mut ataxin-3), and the β-tubulin was evaluated by Western blot in CNT and MJD NESC-EVs and the respective cells of origin (MJD NESC and CNT NESC). The proteins p62, Beclin-1, and SOD1 were detected in CNT and MJD NESC-EVs and were further evaluated in B CNT and MJD Neural-EVs. The p62, Beclin-1, and SOD1 protein levels were quantified in C NESC-EVs and D Neural-EVs by western blot and normalized for β-tubulin and CNT EVs levels. C p62 n = 8, Beclin-1 n = 3, SOD-1 n = 9; D n = 6. E Evaluation of mutant and wild-type ATXN3 and CYCS mRNA presence in CNT and MJD NESC-EVs by semi-quantitative RT-PCR; n = 4–6. F Quantification of SQSTM1, BECN1, UBC, CYCS, ATG12, and LC3B mRNA levels in CNT and MJD NESC-EVs through qRT-PCR normalized for GAPDH and CNT mRNA levels; n = 4–5. Data are expressed as mean ± SEM, *p < 0.05, **p < 0.01, unpaired t-test with Welch’s correction.
Fig. 3
Fig. 3. EVs’ cell internalization, reactive oxygen species (ROS) production stimulation, and effect on cell viability.
EVs isolated from the culture medium of human iPSC-derived NESC (NESC-EVs) and from neural cell cultures differentiated from iPSC-derived NESC (Neural-EVs) were incubated with human CNT differentiated neural cell cultures. AG Representative confocal fluorescence microscopy images showing CFSE (green)-labeled EVs internalization by the human differentiated neural cells, DAPI: blue, n = 3. A Cells incubated with the negative CNT (PBS + CFSE) presented no CFSE labeling, while cells incubated with the CFSE-labeled B, DF NESC-EVs and C, EG Neural-EVs showed the green-labeled EVs, namely in F, G neurons stained for β3 tubulin (red), scale bars: A, B: 50 μm; C: 20 μm; D, F: 2 μm, and E, G: 5 μm. HK Reactive oxygen species (ROS) levels assessment in the human differentiated neural cell cultures after incubation with NESC-EVs. Representative fluorescence image of ROS (orange) levels in differentiated neural cell cultures (Cells) H before and after incubation for 1 h with 100 μg/ml of I CNT (Cells + CNT EVs) and J MJD (Cells + MJD EVs) NESC-EVs. K ROS levels in differentiated neural cell cultures without treatment (CNT cells, CNT) and treated with CNT (CNT NESC-EVs) and MJD (MJD NESC-EVs) NESC-EVs were assessed by the relative fluorescence units (RFU) quantification of ROS fluorescence probe normalized for the CNT; n = 6. L, M Viability of differentiated neural cell cultures incubated for 3 days with 50 and 100 μg/ml (50 and 100 μg) of L CNT and MJD NESC-EVs and M CNT and MJD Neural-EVs normalized for CNT (not treated differentiated neural cell cultures); n = 4–12. Data are expressed as mean ± SEM, One-way ANOVA with Tukey’s multiple comparison test, **p < 0.01.
Fig. 4
Fig. 4. MJD NESC-EVs downregulate the levels of proteins related to autophagy and oxidative stress.
AH Western blot analysis of proteins related to autophagy (p62, Beclin-1, LC3B, ATG3, and ATG7) and oxidative stress (SOD1) in differentiated neural cell cultures after 3 days incubation with 50 and 100 μg/ml of CNT (CNT EVs) and MJD (MJD EVs) NESC-derived EVs (NESC-EVs) compared with non-treated cells (CNT, non-treated). Representative Western blot images of p62, Beclin-1, LC3B, ATG3, ATG7, SOD1, and β-Tubulin protein levels after incubation with A CNT and B MJD NESC-EVs. Quantification of C p62, D Beclin-1, E LC3B, F ATG3, G ATG7, and H SOD1 protein levels in human differentiated neural cell cultures incubated with 50 and 100 μg/ml (50 and 100 μg) of CNT (CNT EVs) and MJD (MJD EVs) NESC-EVs, normalized for β-Tubulin and non-treated cells (CNT). Data are expressed as mean ± SEM; n = 9 for CNT EVs and n = 11 for MJD EVs. Data are expressed as mean ± SEM, *p < 0.05, **p < 0.01, ***p < 0.001, ****p < 0.0001, One-way ANOVA with Tukey’s multiple comparison test.
Fig. 5
Fig. 5. MJD Neural-EVs downregulate levels of proteins related to autophagy and oxidative stress.
AH Western blot analysis of proteins related to autophagy (p62, Beclin-1, LC3B, ATG3, and ATG7) and oxidative stress (SOD1) in differentiated neural cell cultures after 3 days incubation with 50 and 100 μg/ml of CNT (CNT EVs) and MJD (MJD EVs) differentiated neural cell cultures-derived EVs (Neural-EVs) compared with non-treated cells (CNT, non-treated). Representative Western blot images of p62, Beclin-1, LC3B, ATG3, ATG7, SOD1, and β-Tubulin protein levels after incubation with A CNT and B MJD Neural-EVs. Quantification of C p62, D Beclin-1, E LC3B, F ATG3, G ATG7, and H SOD1 protein levels in human differentiated neural cell cultures incubated with 50 and 100 μg/ml (50 and 100 μg) of CNT (CNT EVs) and MJD (MJD EVs) Neural-EVs, normalized for β-Tubulin and non-treated cells (CNT); n = 3. Data are expressed as mean ± SEM, *p < 0.05, **p < 0.01, ***p < 0.001, ****p < 0.0001, One-way ANOVA with Tukey’s multiple comparison test.
Fig. 6
Fig. 6. Mutant ataxin-3 spreading from MJD to CNT differentiated neural cells in an indirect co-culture system.
A Illustration of the in vitro model used to assess mutant ataxin-3 spreading from MJD to CNT differentiated neural cells through the indirect co-culture of CNT cells (in the bottom of the well) with MJD differentiated neural cells in an insert (at the top of the well). BE Representative immunofluorescence confocal microscopy images of B, C CNT differentiated neural cell cultures grown alone and D, E indirectly co-cultured for 8 weeks with MJD differentiated neural cell cultures, collected at this time point, and stained for the presence of mutant ataxin-3 aggregates (red); DAPI (blue), Scale bars: 10 μm. Lower insert: higher magnification image of ataxin-3-positive spots/aggregates (red) in DAPI-positive cell nucleus (blue). F Quantification of ataxin-3-positive spots in the cell nucleus (DAPI) of CNT cells (CNT) and CNT cells co-cultured with MJD cells (CNT + MJD cells) for 1, 3, and 8 weeks, collected at the end of the co-culture time, and stained for the presence of mutant ataxin-3 aggregates; n = 3, 2, and 2 independent experiments for 1, 3, and 8 weeks of cells’ co-culturing, respectively. Data are expressed as mean ± SEM, unpaired t-test with Welch’s correction.

Similar articles

References

    1. Paulson HL, Perez MK, Trottier Y, Trojanowski JQ, Subramony SH, Das SS, et al. Intranuclear inclusions of expanded polyglutamine protein in spinocerebellar ataxia type 3. Neuron. 1997;19:333–44. - PubMed
    1. Scherzed, Brunt W, Heinsen ER, de Vos RA H, Seidel K, Bürk K, et al. Pathoanatomy of cerebellar degeneration in spinocerebellar ataxia type 2 (SCA2) and type 3 (SCA3). Cerebellum. 2012;11:749–60. - PubMed
    1. Seidel K, Siswanto S, Brunt ER, den Dunnen W, Korf HW, Rüb U. Brain pathology of spinocerebellar ataxias. Acta Neuropathol. 2012;124:1–21. - PubMed
    1. Kawaguchi Y, Okamoto T, Taniwaki M, Aizawa M, Inoue M, Katayama S, et al. CAG expansions in a novel gene for Machado-Joseph disease at chromosome 14q32.1. Nat Genet. 1994;8:221–8. - PubMed
    1. Matos CA, de Macedo-Ribeiro S, Carvalho AL. Polyglutamine diseases: the special case of ataxin-3 and Machado-Joseph disease. Prog Neurobiol. 2011;95:26–48. - PubMed

MeSH terms

LinkOut - more resources