Multicenter Study
. 2025 May 15;16(1):4536.
doi: 10.1038/s41467-025-59584-7.

Multi-institutional atlas of brain metastases informs spatial modeling for precision imaging and personalized therapy

Affiliations
Multicenter Study

Multi-institutional atlas of brain metastases informs spatial modeling for precision imaging and personalized therapy

Jorge Barrios et al. Nat Commun. .

Erratum in

  • Author Correction: Multi-institutional atlas of brain metastases informs spatial modeling for precision imaging and personalized therapy.
    Barrios J, Porter E, Capaldi DPI, Upadhaya T, Chen WC, Perks JR, Apte A, Aristophanous M, LoCastro E, Hsu D, Stone PH, Villanueva-Meyer JE, Valdes G, Jiang F, Maddalena M, Ballangrud A, Prezelski K, Lin H, Sun JY, Aldin MAK, Chau OW, Ziemer B, Seaberg M, Sneed PK, Nakamura JL, Boreta LC, Fogh SE, Raleigh DR, Chew J, Vasudevan H, Cha S, Hess C, Fragoso R, Shultz DB, Pike L, Hervey-Jumper SL, Tsang DS, Theodosopoulos P, Cooke D, Benedict SH, Sheng K, Seuntjens J, Coolens C, Deasy JO, Braunstein S, Morin O. Barrios J, et al. Nat Commun. 2025 Jun 2;16(1):5096. doi: 10.1038/s41467-025-60522-w. Nat Commun. 2025. PMID: 40456774 Free PMC article. No abstract available.

Abstract

Brain metastases are a frequent and debilitating manifestation of advanced cancer. Here, we collect and analyze neuroimaging of 3,065 cancer patients with 13,067 brain metastases, representing an extensive collection for research. We find that metastases predominantly localize to high perfusion areas near the grey-white matter junction, but also identify notable differences depending on the primary cancer histology as well as brain regions which do not conform to this relationship. Lung and breast cancers, in contrast to melanoma, frequently metastasize to the cerebellum, hinting at biological pathways of spread. Additionally, the deep brain structures are relatively spared from metastasis, regardless of primary cancer type. Leveraging this data, we propose a probabilistic brain metastasis risk model to enhance the therapeutic ratio of whole-brain radiotherapy by targeting high risk areas while preserving cortical and subcortical brain regions of functional significance and low metastasis risk, potentially reducing the cognitive side effects of therapy.


Conflict of interest statement

Competing interests: The authors declare no competing interests.

Figures

Fig. 1
Fig. 1. Multi-institutional methodology for building spatial risk maps of brain metastasis.
T1-weighted MR post-gadolinium contrast images and a clinical data acquisition template are used at all partner institutions to accumulate the raw information. Patient images co-registered (rigid + deformable) to the MNI model and brain metastases transferred and accumulated into the MNI space. The BM risk map in MNI space is plotted against four validated atlases: anatomical coarse, anatomical fine, functional, and vascular. The data processing pipeline and transfer is designed to be updated every 6 months with new data from current and future participating institutions.
Fig. 2
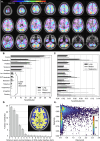
Fig. 2. Brain metastasis spatial distribution and morphology by coarse anatomical regions.
A Brain metastasis risk levels (color-coded localized incidence risk of brain metastases) displayed on axial slices of the MNI model (grayscale) for patients with lung primary (N = 1323 patients, L = 5334 lesions) cancer, first diagnosis of brain lesions prior to stereotactic treatment. B Percentage contribution of BM lesions by coarse anatomical regions for lung (N = 1315 patients, L = 5230 lesions), breast (N = 570 patients, L = 3007 lesions), and melanoma (N = 407 patients, L = 1931 lesions) primary cancer. The cumulative lesion contribution of all brain regions represents 100%. Error bars indicate 95% confidence interval over the four institutions represented in the dataset. The center of the error bars represents the mean percentage contribution of all four institutions for a given structure. C Percentage contribution of brain metastasis normalized by the volume by coarse anatomical regions for lung (N = 1315 patients, L = 5230 lesions), breast (N = 570 patients, L = 3007 lesions), and melanoma (N = 407 patients, L = 1931 lesions) primary cancer. Error bars indicate 95% confidence interval over the four institutions represented in the dataset. The center of the error bars represents the mean percentage contribution normalized by the volume of all four institutions for a given structure. D Percentage of the brain lesion contribution as a function of the minimum distance of the lesion centroid to the white and gray matter interface. Error bars indicate 95% confidence interval over the four institutions represented in the dataset (N = 2113 patients, L = 8176 lesions). The center of the error bars represents the mean percentage contribution of all four institutions for a specific distance to the white-gray matter junction. The white and gray matter volumes are represented by yellow and light blue, respectively. The dark blue represents the edge of the brain’s gray matter. E Lesions sphericity distribution as a function of the lesion volume (N = 2001 patients, L = 9302 lesions), where the heatmap represents the magnitude of the count in the plotted joint histogram distribution. Source data are provided as a Source Data file.
Fig. 3
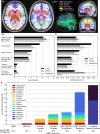
Fig. 3. Brain metastasis spatial distribution by functional regions and tradeoff of whole-brain RT sparing techniques and expected BM coverage.
A Brain metastasis risk levels displayed on representative axial, sagittal, and coronal slices of the MNI model for patients with lung primary cancer (N = 1315 patients, L = 5230 lesions) at first diagnosis of brain lesions prior to stereotactic treatment, as well as neuro-cognitive, motor, and sensory relevant functional maps. Specific functional atlases include: the Thalamic Connective atlas (Behrens 2003), the Brainstem Connectome atlas (Tang 2017), the Basal Ganglia and Thalamus atlas (He 2020), and the Cognitive Decline Network atlas (Reich 2022). B Percentage contribution of brain metastasis lesions by MNI population functional maps for lung (N = 1315 patients, L = 5230 lesions), breast (N = 570 patients, L = 3007 lesions), and melanoma (N = 407 patients, L = 1931 lesions) primary cancer. Error bars indicate 95% confidence interval over the four institutions represented in the dataset. The center of the error bars represents the mean percentage contribution of all four institutions for a given structure. C Percentage contribution of brain metastasis normalized by the volume by MNI functional regions for lung (N = 1315 patients, L = 5230 lesions), breast (N = 570 patients, L = 3007 lesions), and melanoma (N = 407 patients, L = 1931 lesions) primary cancer. Error bars indicate 95% confidence interval over the four institutions represented in the dataset. The center of the error bars represents the mean percentage contribution normalized by the volume of all four institutions for a given structure. D Examples of functional sparing treatment volumes and the associated expected BM coverage (N = 2305 patients, L = 10,398 lesions). Colored regions indicate spared regions contained within each proposed treatment. Coverage reported as the mean between all primaries, except for “Melanoma PROTECT” which is only coverage of expected Melanoma BM. Source data are provided as a Source Data file.
Fig. 4
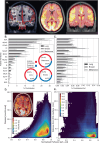
Fig. 4. Brain metastasis spatial distribution by level of perfusion and arterial territories.
A Left- illustration of brain vascular levels: artery, arteriole, and capillary. Center/right—representative arterial spin labeling image on representative axial and coronal slices on the MNI model. B Percentage contribution of brain metastasis lesions by MNI population arterial territories for lung (N = 1316 patients, L = 5224 lesions), breast (N = 565 patients, L = 2998 lesions), and melanoma (N = 406 patients, L = 1954 lesions) primary cancer. Error bars indicate 95% confidence interval over the four institutions represented in the dataset. The center of the error bars represents the mean percentage contribution of all four institutions for a given structure. Percentage contribution of brain metastasis in sub-arterial territories combined into anterior and posterior arterial territories for lung, breast, and melanoma primaries. C Percentage contribution of brain metastasis normalized by the volume by MNI arterial territories for lung (N = 1316 patients, L = 5224 lesions), breast (N = 565 patients, L = 2998 lesions), and melanoma (N = 406 patients, L = 1954 lesions) primary cancer. Error bars indicate 95% confidence interval over the four institutions represented in the dataset. The center of the error bars represents the mean percentage contribution normalized by the volume of all four institutions for a given structure. D Brain metastasis volume and count per voxel as a function of normalized brain perfusion on the MNI model. Color map indicates total brain volume within the joint histogram bin. E Brain metastasis volume plotted with the minimum white–gray matter distance as a function of normalized brain perfusion of the MNI model. ACA anterior cerebral artery, MCAF frontal pars of middle cerebral artery, MCAP parietal pars of middle cerebral artery, PCAO occipital pars of posterior cerebral artery, MCAT temporal pars of middle cerebral artery, IC inferior cerebellar, LLS lateral lenticulostriate, SC superior cerebellar, MCAO occipital pars of middle cerebral artery, PCAT temporal pars of posterior cerebral artery, B basilar, MCAI insular pars of the middle cerebral artery, PCTP posterior choroidal and thalamoperfurators, ACTP anterior choroidal and thalamoperfurators, MLS medial lenticulostriate, LV lateral ventricle. Source data are provided as a Source Data file.
Fig. 5
Fig. 5. Comparison of WBRT techniques, dose distributions, and functional sparing potential.
Top—treatment plans ordered by progressing dose de-intensification on representative axial, sagittal, and coronal slices. From left to right: the conventional techniques of WBRT, WBRT-HA, the newly proposed personalized approaches with higher functional sparing PROTECT (Personalized Radiation Optimization To Eliminate Collateral Toxicity) techniques planned using photons WBRT-PROTECT(Photons) or protons WBRT-PROTECT(Protons). Bottom—error bars represent the minimum, mean and maximum dose metrics achieved to compares the target[black] and selected functional structures (hippocampi [light blue], amygdala [dark blue], brainstem [dark green], putamen [pink], caudate [light green], pallidus [yellow], thalamus [purple] and ventricles [dark purple]) for the WBRT[circles], WBRT-HA[squares], WBRT-PROTECT(Photons)[diamonds], and WBRT-PROTECT(Protons)[triangles] plans. Source data are provided as a Source Data file.

Similar articles

References

    1. Siegel, R. L., Miller, K. D., Wagle, N. S. & Jemal, A. Cancer statistics, 2023. CA Cancer J. Clin.73, 17–48 (2023). - PubMed
    1. Gondi, V. et al. Radiation therapy for brain metastases: an ASTRO clinical practice guideline. Pract. Radiat. Oncol.12, 265–282 (2022). - PubMed
    1. Brenner, A. W. & Patel, A. J. Review of current principles of the diagnosis and management of brain metastases. Front. Oncol.12, 857622 (2022). - PMC - PubMed
    1. Srinivasan, E. S., Deshpande, K., Neman, J., Winkler, F. & Khasraw, M. The microenvironment of brain metastases from solid tumors. Neurooncol. Adv.3, v121–v132 (2021). - PMC - PubMed
    1. Hwang, T. L., Close, T. P., Grego, J. M., Brannon, W. L. & Gonzales, F. Predilection of brain metastasis in gray and white matter junction and vascular border zones. Cancer77, 1551–1555 (1996). - PubMed

Publication types

LinkOut - more resources