. 2025 May 15;16(1):4502.
doi: 10.1038/s41467-025-59786-z.

TIGIT deficiency promotes autoreactive CD4+ T-cell responses through a metabolic‒epigenetic mechanism in autoimmune myositis

Affiliations

TIGIT deficiency promotes autoreactive CD4+ T-cell responses through a metabolic‒epigenetic mechanism in autoimmune myositis

Yimei Lai et al. Nat Commun. .

Abstract

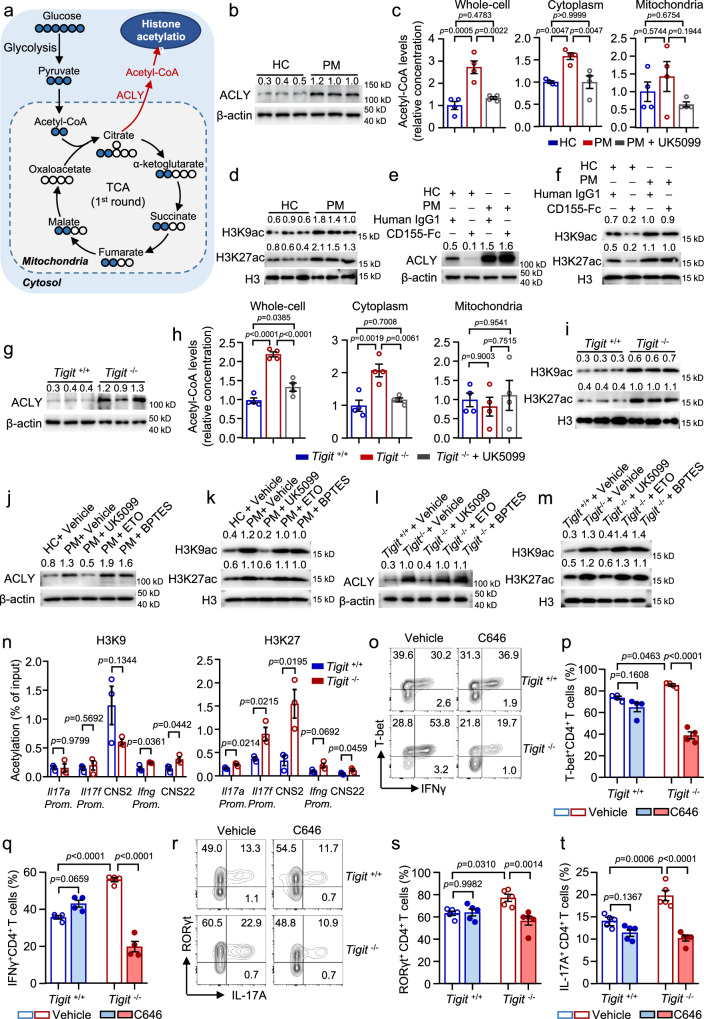
Polymyositis (PM) is a systemic autoimmune disease characterized by muscular inflammatory infiltrates and degeneration. T-cell immunoreceptor with Ig and ITIM domains (TIGIT) contributes to immune tolerance by inhibiting T cell-mediated autoimmunity. Here, we show that a reduced expression of TIGIT in CD4+ T cells from patients with PM promotes these cells' differentiation into Th1 and Th17 cells, which could be rescued by TIGIT overexpression. Knockout of TIGIT enhances muscle inflammation in a mouse model of experimental autoimmune myositis. Mechanistically, we find that TIGIT deficiency enhances CD28-mediated PI3K/AKT/mTOR co-stimulatory pathway, which promotes glucose oxidation, citrate production, and increased cytosolic acetyl-CoA levels, ultimately inducing epigenetic reprogramming via histone acetylation. Importantly, pharmacological inhibition of histone acetylation suppresses the differentiation of Th1 and Th17 cells, alleviating muscle inflammation. Thus, our findings reveal a mechanism by which TIGIT directly affects the differentiation of Th1 and Th17 T cells through metabolic‒epigenetic reprogramming, with important implications for treating systemic autoimmune diseases.


Conflict of interest statement

Competing interests: The authors declare no competing interests.

Figures

Fig. 1
Fig. 1. TIGIT deficiency promotes proinflammatory CD4+ T cells in patients with PM.
PBMCs were collected from polymyositis (PM), dermatomyositis (DM), systemic lupus erythematosus (SLE), or healthy controls (HC). TIGIT, CD226, and CD96 expression in cells in PBMCs was measured by flow cytometry. a Schematic employed to visualize TIGIT, CD226, and CD96 on T cells binding to CD155 on antigen-presenting cells (APC). bg CD4+ T cells from HC or PM, DM or SLE patients were stimulated with anti-CD3/CD28 beads (αCD3/CD28) for 3 d. The expression of TIGIT, CD226, and CD96 in pre- and post-activation of CD4+ T cells was measured by flow cytometry of biological replicates (HC = 27, PM = 27, DM = 23, SLE = 23). h Naive CD4+ T cells isolated from PBMCs of HC or patients with PM, were stimulated with αCD3/CD28. TIGIT expression was measured by flow cytometry. Data from four biologically independent replicates. hl Total CD4+ T cells from patients with PM or HC were transfected with pcDNA3.1-hTIGIT or pcDNA3.1-Vector by electroporation. Cells were then stimulated by αCD3/CD28 for 3 d. h Overexpression of TIGIT was confirmed by Western blot. The experiment was repeated three times independently with similar results. i, j Overexpression of TIGIT in CD4+ T cells from HC or PM was confirmed by flow cytometry. Data from five biologically independent replicates. k, l IFNγ and IL-17A production by CD4+ T cells from PM patients or HC was measured by flow cytometry. Data from five biologically independent replicates. mo CD4+ T cells from PM patients or HC were stimulated with αCD3/CD28 in the presence of CD155-Fc (10 μg/ml) or control IgG1 for 3 d. IFNγ, IL-17A, and FoxP3 expression in CD4+ T cells from PM patients or HC was measured by flow cytometry. Data from five biologically independent replicates. All data are mean ± SEM. Statistics were done by one-way ANOVA with adjustments for multiple comparisons in c, e, g, and two-way ANOVA with adjustments for multiple comparisons in j, l, n, and o.
Fig. 2
Fig. 2. TIGIT deficiency promotes Th1 and Th17 cell differentiation in patients with PM.
a, b Naive CD4+ T cells isolated from PBMCs from HC or PM patients were stimulated with αCD3/CD28 for 5 d. TIGIT expression in CD4+ T cells was measured by flow cytometry. Representative contour plots were shown. Data from four biologically independent replicates. ci Naive CD4+ T cells from patients with PM or HC were transfected with pcDNA3.1-hTIGIT or pcDNA3.1-Vector by electroporation. Cells were then stimulated by αCD3/CD28 for 5 d. c Overexpression of TIGIT in CD4+ T cells from HC or PM was confirmed by western blot. The experiment was repeated three times independently with similar results. d, e Overexpression of TIGIT in CD4+ T cells from HC or PM was confirmed by flow cytometry. Data from five biologically independent replicates. f, g Naive CD4+ T cells were cultured and polarized under Th1 cell conditions for 5 d. IFNγ and T-bet expression in CD4+ T cells were measured by flow cytometry. Data from six biologically independent replicates. h, i Naive CD4+ T cells were cultured and polarized under Th17 cell conditions for 5 d. The expressions of FoxP3 and IL-17A were measured by flow cytometry, and data from five biologically independent replicates. j, k Naive CD4+ T cells were polarized in Th1 condition in the presence of recombinant human CD155-Fc (10 μg/ml) or IgG1 control for 5 d. IFNγ and T-bet expression in CD4+ T cells were measured by flow cytometry. Data from five biologically independent replicates. l, m Naive CD4+ T cells polarized in Th17 condition in the presence of recombinant human CD155-Fc (10 μg/ml) or IgG1 control for 5 d. IL-17A and FoxP3 expression in CD4+ T cells were measured by flow cytometry. Data from five biologically independent replicates. All data are mean ± SEM. Statistics were done by two-way ANOVA followed by adjustments for multiple comparisons.
Fig. 3
Fig. 3. Knockdown of TIGIT in healthy CD4+ T cells recapitulates the proinflammatory phenotype of PM TIGITlow CD4+ T cells.
a, b Knockdown of TIGIT was confirmed by flow cytometry. Data from five biologically independent replicates. c Knockdown of TIGIT in CD4+ T cells from HC or PM was confirmed by western blot. The experiment was repeated three times independently with similar results. dg CD4+ T cells were labeled with CFSE and stimulated with αCD3/CD28 for 3 d. T-cell proliferation was evaluated by flow cytometry. Data from five biologically independent replicates. h, i IFNγ, and IL-17A expression in CD4+ T cells was measured by flow cytometry. Data from five biologically independent replicates. dr Naive CD4+ T cells from HC were stimulated by αCD3/CD28 for 1 d, and then transfected with scramble or TIGIT siRNA by electroporation. Following transfection, cells were subjected to culture conditions for Th1, Th2, Th17, and Treg cell differentiation for an additional 4 d, respectively. jx Naive CD4+ T cells from HC were stimulated by αCD3/CD28 for 1 d, and then transfected with scramble or TIGIT siRNA by electroporation. Following transfection, cells were subjected to culture conditions for Th1, Th2, Th17 and Treg cell differentiation for an additional 4 d, respectively. j, k Knockdown efficacy of TIGIT was confirmed by flow cytometry. Data from five biologically independent replicates. lx Th1 condition: T-bet and IFNγ (ln), Th2 condition: GATA3 and IL-4 (or), Th17 condition: RORγt and IL-17A (sv), and Treg condition: FoxP3 (w, x) expression in CD4+ T cells were measured by flow cytometry. Representative contour plots or histograms were shown. Data from five biologically independent replicates. All data are mean ± SEM. Statistics were done by a two-tailed unpaired Student’s t test.
Fig. 4
Fig. 4. TIGIT controls the differentiation of Th1 and Th17 cells in vitro and in vivo.
an Naive CD4+ T cells were isolated from Tigit/ or Tigit+/+ mice. The cells were subjected to culture conditions for Th1, Th2, Th17 and Treg cell differentiation for 5 d. ad Th1 condition: T-bet, GATA3, and IFNγ expression in CD4+ T cells was measured by flow cytometry, and representative contour plots were shown. eh Th2 condition: flow cytometric analysis of GATA3 and IL-4 expression in CD4+ T cells and representative contour plots. il Th17 condition: RORγt and IL-17A expression in CD4+ T cells measured by flow cytometry. m, n Treg condition: FoxP3 expression in CD4+ T cells measured by flow cytometry and representative contour plots. o Scheme of the mouse experiment. EAM was induced as described in Fig. 2. Each Rag1−/− recipient mouse was injected intravenously with 2 × 106 naive CD4+ T cells, and EAM induction was performed. ps The expression of T-bet, RORγt, IFNγ, and IL-17A in CD4+ T cells from mice that received Tigit/ or Tigit+/+ cells was measured via flow cytometry. Representative contour plots were shown. t Schematic employed to visualize that TIGIT deficiency enhances Th1 and Th17 differentiation, resulting in severe muscle infiltration. Original magnification: ×200. b, d, j, l, q, s, n = 5; for f, n = 4; and for h, n n = 6 biological independent samples. All data are presented as the mean ± SEM. Statistics were done by two-tailed unpaired Student’s t test.
Fig. 5
Fig. 5. Knockout of TIGIT promotes inflammatory CD4+ T-cell responses during EAM induction.
a Scheme for the induction of experimental autoimmune myositis (EAM) in Tigit/, Tigit+/, or Tigit+/+ mice. Age- and sex-matched Tigit+/+ mice without EAM induction served as the Control group. b Muscle strength of Tigit/, Tigit+/, or Tigit+/+ mice with EAM. c Representative spleen images and the spleen weight index calculated by dividing the spleen weight (mg) by the body weight (g). d, e IFNγ- and IL-17A-producing CD4+ T cells in the spleens of Tigit/ or Tigit+/+ mice were measured by flow cytometry. Representative contour plots were shown (f, g) CD44 expression in CD4+ T cells in the spleens of Tigit/ or Tigit+/+ mice was measured by flow cytometry. h Gene expression of Ifng, Il17a, Il17f, and Il2 in the quadriceps of Tigit/ or Tigit+/+ mice was quantified by qPCR. i HE staining and histological score of quadriceps in Tigit/ or Tigit+/+ mice with EAM.Original magnification: ×200. j, k TIGIT agonistic antibody (Anti-TIGIT) or an isotype control was used to treat EAM mice. j EAM was induced as described in a. EAM mice were injected intraperitoneally with anti-TIGIT (10 mg/kg/Q3d) or an isotype after the second immunization for 2 weeks (w). Age- and sex-matched C57BL/6 mice without EAM induction served as the Control group. k Muscle strength of the control mice and mice with EAM treated with anti-TIGIT or the isotype control. l Size of spleen and spleen weight. Spleen weight index was calculated and summarized in C. mo IFNγ- and IL-17A-producing CD4+ T cells in the spleen were measured by flow cytometry. p, q HE staining and histological score of quadriceps sections from control mice and mice with EAM treated with anti-TIGIT or the isotype control. Original magnification: ×200. ND: not detective. b, c, e, h, i Tigit/ (n = 11), Tigit+/ (n = 7), and Tigit+/+ (n = 10) biologically independent replicates, when applicable. g Tigit/ (n = 7), and Tigit+/+ (n = 6) biologically independent replicates. k, l, n, o, q Control (n = 5), Isotype (n = 7), and Anti-TIGIT (n = 7) biological independent samples, when applicable. All data are presented as the mean ± SEM. Statistics were done by one-way ANOVA with adjustments for multiple comparisons in b, c, k, l, n, o, and two-tailed unpaired Student’s t test in e, g, h, i, q.
Fig. 6
Fig. 6. TIGIT deficiency fuels glucose oxidation to promote Th1 and Th17 cell differentiation.
a Isotope tracing of glucose-derived metabolites via GC/MS or LC/MS. b Fractional enrichment of [13C]-glucose-derived metabolites in tricarboxylic acid (TCA) cycle in Tigit/ or Tigit+/+ CD4+ T cells. Data from three biologically independent replicates. c, d Tigit/ or Tigit+/+ CD4+ T cells were activated with αCD3/CD28 for 3 d. Oxygen consumption rate (OCR) and basal extracellular acidification rate (ECAR) were measured using a Seahorse XF96 analyzer. Parameters of basal respiration, respiration coupled to ATP production, maximal respiration, respiratory spare capacity, and basal ECAR were summarized and data from five biologically independent replicates. eh For metabolic activities evaluation of CD4+ T cells, Glycolysis Stress Test Kit was used to test ECAR by a Seahorse XF96 analyzer. ECAR tracing curves and parameters of glycolysis, glycolysis capacity, and glycolysis reserve were summarized (n = five biologically independent replicates from five individual mice per group). ik Naive Tigit/ or Tigit+/+ CD4+ T cells were cultured under Th1- or Th17-polarizing condition for 5 d. UK5099 (20 μM), MSDC-0602 (10 μM), Etomoxir (ETO, 1 μM), or bis-2-(5-phenylacetamido-1, 2, 4-thiadiazol-2-yl) ethyl sulfide (BPTES, 3 μM) was included for the last 48 h of culture. IFNγ, T-bet, IL-17A, and RORγt expression in CD4+ T cells were measured by flow cytometry. Data from four biologically independent replicates. All data are presented as the mean ± SEM. Statistics were done by two-tailed unpaired Student’s t test in (bd, fh) or one-way ANOVA followed by adjustments for multiple comparisons in k.
Fig. 7
Fig. 7. TIGIT controls Th1 and Th17 cell differentiation through acetyl-CoA generation and histone acetylation.
a ATP-citrate lyase (ACLY) controls the conversion of TCA-derived citrate into acetyl-coenzyme A (CoA) for histone acetylation. bf CD4+ T cells from HC or PM patients were stimulated with αCD3/CD28 in the presence of UK5099 (20 μM), recombinant human CD155-Fc (10 μg/ml), or control IgG1 for 3 d. b Immunoblot analysis of ACLY expression in CD4+ T cells and representative bands of six biologically independent replicates. c Acetyl-CoA levels in whole-cell lysates and the cytosolic and mitochondrial fractions of CD4+ T cells and data from four biologically independent replicates. d Immunoblot analysis of H3K9 and H3K27 acetylation in CD4+ T cells from PM patients or HC. Representative bands of six biologically independent replicates. e, f Immunoblot analysis of ACLY and H3K9 and H3K27 acetylation in CD4+ T cells. Representative bands of four biologically independent replicates. gi CD4+ T cells from Tigit+/+ or Tigit/ mice were stimulated with αCD3/CD28. g Immunoblot analysis of ACLY expression in mouse CD4+ T cells. h Acetyl-CoA in whole-cell lysates, cytosolic and mitochondrial fractions of mouse CD4+ T cells. Data from four biologically independent replicates. i Immunoblot analysis of acetylated H3K9 and H3K27 in mouse CD4+ T cells and representative bands. j, k CD4+ T cells from HC or PM were stimulated with αCD3/CD28 in the presence of UK5099, ETO or BPTES for 3 d. Immunoblot analysis of ACLY (j), acetylated H3K9 and H3K27 (k) in CD4+ T cells. l, m Tigit/ or Tigit+/+ CD4+ T cells were stimulated with αCD3/CD28 in the presence of UK5099, ETO, or BPTES for 3 d. Immunoblot analysis of ACLY (l), acetylated H3K9 and H3K27 (m) in mouse CD4+ T cells treated with UK5099, ETO, or BPTES. n Quantification of H3K9 and H3K27 acetylation in CD4+ T cells from Tigit/ or Tigit+/+ mice at the Il17a, Il17f, and Ifng promoters and CNS2 and CNS22 by ChIP‒qPCR. ot Naive CD4+ T cells were cultured under Th1 or Th17 conditions in the presence of C646 (1 μM) or vehicle for 5 d. Flow cytometric analysis of the expression of T-bet, IFNγ (oq), RORγt, and IL-17A (rt) in CD4+ T cells. For c, h, p, q, n = four biologically independent replicates. n n = three biologically independent replicates. s, t, n = five biologically independent replicates. e, f, jm The experiment was repeated three times independently with similar results. Data are mean ± SEM. Statistics were performed using one-way ANOVA followed by multiple comparisons adjustments for c and h, two-tailed unpaired Student’s t test for (n), and two-way ANOVA followed by multiple comparisons adjustments for p, q, s, t.
Fig. 8
Fig. 8. TIGIT controls muscle inflammation by regulating Th1 and Th17 cell differentiation epigenetically in EAM.
a Naive CD4+ T cells from Tigit+/+ or Tigit/ mice were adoptively transferred into Rag1/ mice. EAM was induced as shown in Fig. 2 and treated with C646 (10 mg/kg/d) or vehicle. bf T-bet, RORγt, IFNγ, and IL-17A expression in CD4+ T cells from the spleens of Tigit+/+ or Tigit/ mice was measured by flow cytometry. g, h FoxP3 expression in CD4+ T cells was measured by flow cytometry. i NCG mice were immune reconstituted with PBMCs from five independent HC or PM patients. Four weeks later, the mice were treated with C646 (10 mg/kg/d) for 2 weeks. j Muscle strength of mice that received HC or PM PBMCs treated with vehicle or C646. k HE staining and histological score of muscle (quadriceps) sections from mice that received HC or PM PBMCs treated with vehicle or C646. Original magnification: ×100. l, m Image showing spleen size in mice that received HC or PM PBMCs treated with vehicle or C646. Spleen weight index was calculated by dividing spleen weight (mg) by body weight (g). n, o IFNγ and IL-17A expression in CD4+ T cells from the spleen was measured by flow cytometry. c, d, f, h n = four biologically independent replicates. j, k, m, n n = five biologically independent replicates from five individual mice per group. All data are mean ± SEM. Statistics were done by one-way ANOVA followed by adjustments for multiple comparisons.
Fig. 9
Fig. 9. TIGIT dampens CD28 signaling in CD4+ T cells.
a Scheme of TIGIT signaling in CD4+ T cells. Red dashed lines: potential downstream targets of TIGIT (Figure partially created in BioRender. Zhang, H. (2025) https://BioRender.com/k12l31h). b Immunoblot analysis of p-CD226S329 in CD4+ T cells from Tigit/ or Tigit+/+ mice (upper) or CD4+ T cells from HC and PM patients (lower). Bands representative of three independent experiments with similar results are shown. c CD4+ T cells from Tigit/ or Tigit+/+ mice were stimulated with OKT3 for the indicated times. Immunoblot analyses of p-ZAP70Y319, p-LCKY505, ZAP70, and LCK in CD4+ T cells and representative bands of three independent experiments with similar results. d Immunoblot analysis of p-ZAP70Y319, p-LCKY505, ZAP70, and LCK in HC CD4+ T cells treated with recombinant CD155-Fc or the IgG1 control. Representative bands of three independent experiments with similar results. e Immunoblot analysis of the expression of p-ZAP70Y319, p-LCKY505, ZAP70, and LCK in CD4+ T cells from HC and PM patients. Representative bands of three independent experiments with similar results. f Calcium influx into Tigit/ or Tigit+/+ CD4+ T cells was recorded by flow cytometry as stimulated with anti-CD3-biotin antibody (10 μg/ml) followed by crosslinking (arrow) with Streptavidin. The area under the curve (AUC) was measured by flow cytometry. g, h Tigit/ or Tigit+/+ CD4+ T cells were activated with αCD3/CD28 for 3 d. Immunoblot analysis of p-PI3KP85, p-AKTS473, and p-S6S235/236 (g) and p-mTOR, mTOR, and Raptor (h). Representative bands of three independent experiments with similar results. i, j CD4+ T cells from Tigit/ or Tigit+/+ mice were labeled with CFSE and stimulated with anti-CD28 plus PMA in the presence of BEZ235 (1 μM), PI-103 (0.5 μM), or vehicle for 3 d. The frequency of proliferated cells was calculated via flow cytometry and data from four biologically independent replicates. km Tigit/ or Tigit+/+ CD4+ T cells were stimulated with anti-CD28 plus PMA in the presence of BEZ235 (1 μM), PI-103 (0.5 μM), or vehicle for 48 h. CD44 and CD69 expression in CD4+ T cells were measured by flow cytometry, and data from five biologically independent replicates. ns Naive CD4+ T cells from Tigit/ or Tigit+/+ mice were polarized under Th1 or Th17 conditions for 5 d. IFNγ, T-bet, RORγt, and IL-17A expression in CD4+ T cells was measured via flow cytometry. Data from five biologically independent replicates. All data are expressed as mean ± SEM. Statistics were done by one-way ANOVA in j, l, m, or two-way ANOVA in o, q, s. Multiple comparisons were performed for adjustment.
Fig. 10
Fig. 10. TCR signaling is not involved with TIGIT-mediated T-cell suppression.
a CD4+ T cells isolated from Tigit+/+ or Tigit/ mice were stimulated with αCD3/CD28 for 3 d. IKKα, IKKβ, p-IκBα, IκBα, p-p65, and p65 expression were quantified by western blot. Data from six biologically independent replicates. b, c CD4+ T cells from Tigit+/+ or Tigit/ mice were stimulated with PMA + PHA or OKT3 + PMA for 48 h. CD44, CD69, and CD25 expression was measured by flow cytometry. Data from five biologically independent replicates. d, e CD4+ T cells isolated from Tigit+/+ or Tigit/ mice were labeled with CFSE and stimulated with PMA + PHA or OKT3 + PMA for 3 d. T-cell proliferation was measured by flow cytometry. Data from six biologically independent replicates. fj CD4+ T cells from Tigit+/+ or Tigit/ mice were stimulated with anti-CD3 alone (αCD3) or anti-CD3 plus anti-CD28 (αCD3/CD28) for 3 d. fh CD4+ T cells were labeled with CFSE, and cell proliferation was assessed by flow cytometry. I, j IL-2 expression was assessed by flow cytometry. Representative histograms were shown. Data from five biologically independent replicates. All data are mean ± SEM. Statistics were done by two-way ANOVA followed by adjustments for multiple comparisons.

Similar articles

References

    1. Zhao, L., Wang, Q., Zhou, B., Zhang, L. & Zhu, H. The role of immune cells in the pathogenesis of idiopathic inflammatory myopathies. Aging Dis.12, 247–260 (2021). - PMC - PubMed
    1. Malmstrom, V., Venalis, P. & Albrecht, I. T cells in myositis. Arthritis Res Ther.14, 230 (2012). - PMC - PubMed
    1. Sun, L., Su, Y., Jiao, A., Wang, X. & Zhang, B. T cells in health and disease. Signal Transduct. Target. Ther.8, 235 (2023). - PMC - PubMed
    1. Jung, S. M. & Kim, W. U. Targeted immunotherapy for autoimmune disease. Immune Netw.22, e9 (2022). - PMC - PubMed
    1. Mease, P. J., Helliwell, P. S., Hjuler, K. F., Raymond, K. & McInnes, I. Brodalumab in psoriatic arthritis: results from the randomised phase III AMVISION-1 and AMVISION-2 trials. Ann. Rheum. Dis.80, 185–193 (2021). - PMC - PubMed

MeSH terms

Substances