. 2025 May 15;16(1):4542.
doi: 10.1038/s41467-025-59784-1.

Gfi1 controls the formation of effector-like CD8+ T cells during chronic infection and cancer

Affiliations

Gfi1 controls the formation of effector-like CD8+ T cells during chronic infection and cancer

Oluwagbemiga A Ojo et al. Nat Commun. .

Abstract

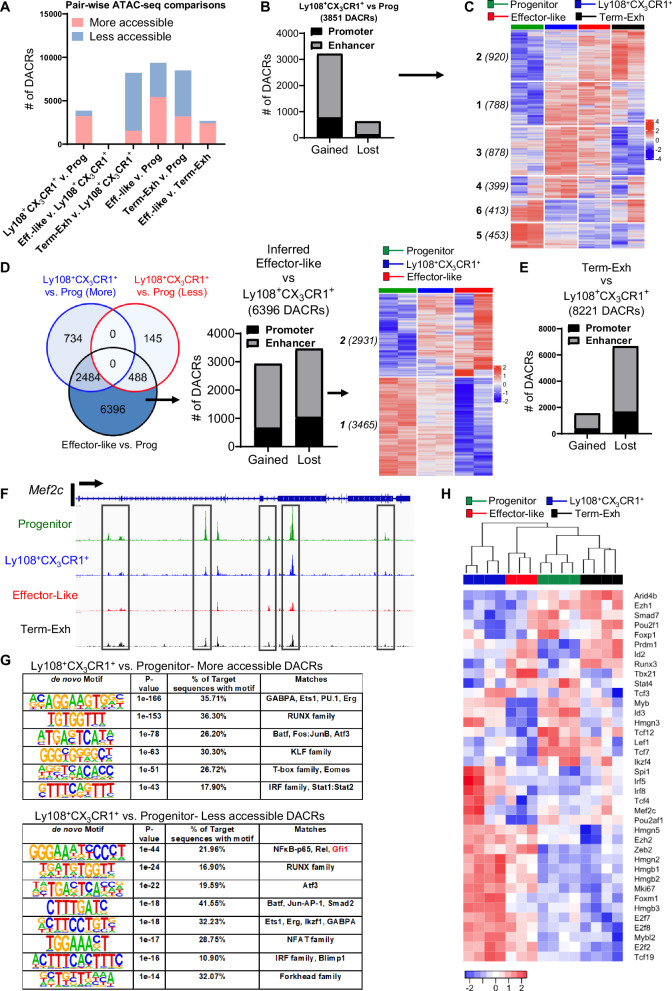
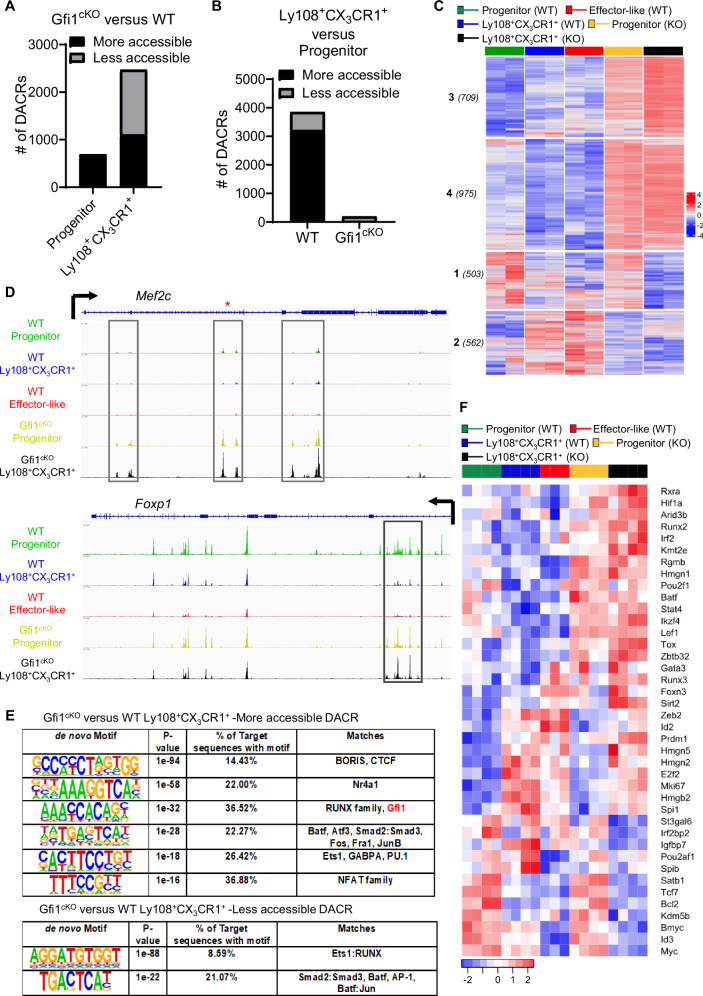
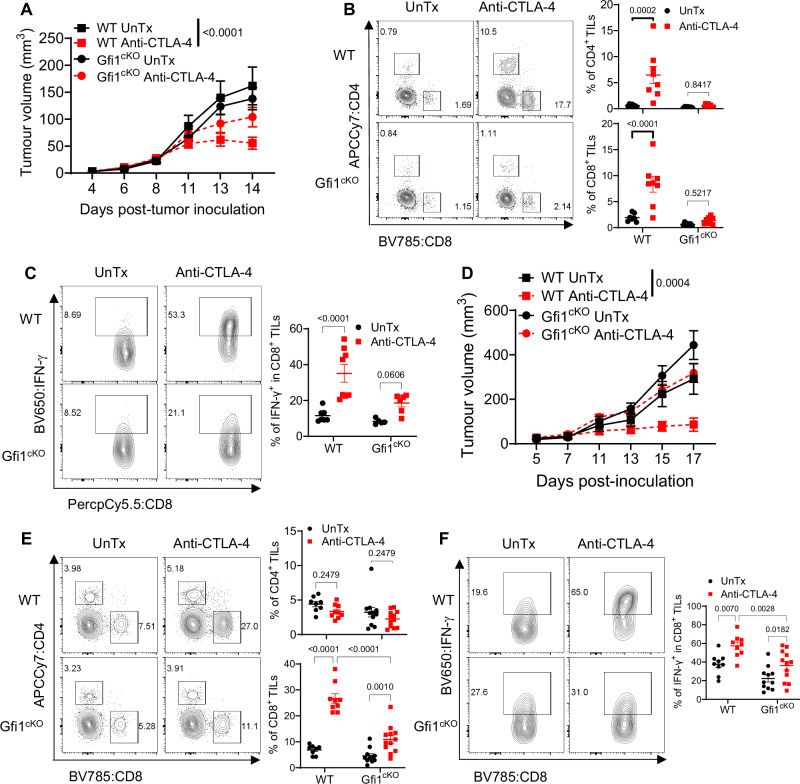
During chronic infection and tumor progression, CD8+ T cells lose their effector functions and become exhausted. These exhausted CD8+ T cells are heterogeneous and comprised of progenitors that give rise to effector-like or terminally-exhausted cells. The precise cues and mechanisms directing subset formation are incompletely understood. Here, we show that growth factor independent-1 (Gfi1) is dynamically regulated in exhausted CD8+ T cells. During chronic LCMV Clone 13 infection, a previously under-described Ly108+CX3CR1+ subset expresses low levels of Gfi1 while other established subsets have high expression. Ly108+CX3CR1+ cells possess distinct chromatin profiles and represent a transitory subset that develops to effector-like and terminally-exhausted cells, a process dependent on Gfi1. Similarly, Gfi1 in tumor-infiltrating CD8+ T cells is required for the formation of terminally differentiated cells and endogenous as well as anti-CTLA-induced anti-tumor responses. Taken together, Gfi1 is a key regulator of the subset formation of exhausted CD8+ T cells.


Conflict of interest statement

Competing interests: The authors declare no competing interests.

Figures

Fig. 1
Fig. 1. Gfi1 is dynamically regulated in exhausted CD8+ T cell subsets during chronic viral infection.
A Gfi1tdTomato reporter mice were infected with LCMV Cl-13, followed by the assessment of Gfi1tdTomato expression on Days 5 (n = 6), 8 (n = 6), 15 (n = 6) and 30 (n = 8) post-infection. BE Identification of Day 30 exhausted CD8+ T cell subsets based on CD44, PD-1, TCF1, Ly108 (B), Ki67, and CD69 expression (C). D Quantification of Ki67 and CD69 expressions as in (C) (n = 9). E. Expression and quantification of Ly108 and CX3CR1 on the 4 exhausted subsets (n = 9). F GMFIs of PD-1, 2B4, LAG-3, Tim-3, CX3CR1, CD44, TCF1, T-bet, Eomes, and TOX in the 4 exhausted subsets (progenitor, Ly108+CX3CR1+, effector-like, and Term-Exh) (n = 9–10). G Expression and quantification of CXCR6 in the 4 exhausted subsets (n = 5). H Gfi1tdTomato expression on the 4 exhausted CD8+ T cell subsets (n = 8). Data were pooled from 2 independent experiments and depicted with mean ± s.e.m. Data in A were analyzed by one-way ANOVA; data in (DH) were analyzed by repeated one-way ANOVA. Holm-Sidak’s post hoc test was used for all analysis. Source data are provided as a Source Data file.
Fig. 2
Fig. 2. Ly108+CX3CR1+ cells possess unique chromatin accessibility and transcriptional features, some of which are shared with effector-like cells.
Day 30 exhausted GP33+ CD8+ T cell subsets were sorted based on Ly108 and CX3CR1 expression for ATAC-Seq (AG) and RNA-Seq (H). A Statistically significant and differentially accessible chromatin regions (DACRs) with > 1.2 log2 fold change from pairwise comparisons were shown. Prog = Progenitor, Eff-like = Effector-like, and Term-Exh = Terminally-exhausted. B Promoter and Enhancer distribution of more and less accessible DACRs in the Ly108+CX3CR1+ cells versus progenitors. C Accessibility profiles of DACRS from (B) were visualized in effector-like and Term-Exh cells. D Venn diagram depicting the intersection of DACRs in Ly108+CX3CR1+ cells versus progenitors with those in effector-like cells versus progenitors (Left), with the bar graph showing the unique DACRs in effector-like cells (Middle), and heatmap visualization of these regions in progenitors, Ly108+CX3CR1+, and effector-like cells (Right). E Bar graph depicting distribution of DACRs in Term-Exh versus Ly108+CX3CR1+ cells. F. Genomic track of accessibility at the Mef2c locus in the 4 exhausted subsets. G De novo HOMER motif analysis of DACRs from Ly108+CX3CR1+ versus progenitor cells. H Heatmap visualization of select transcription factors among the 4 exhausted subsets. ATAC- and RNA-seq data were from 2 and 3-4 independent replicates, respectively. Each replicate was a pooled sample of 3-5 mice.
Fig. 3
Fig. 3. CD8+ T cell intrinsic Gfi1 is required for the formation of effector and Term-Exh subsets.
A, B GP33+ responses were evaluated in WT and Gfi1cKO mice on Days 15 and 30 post LCMV Cl-13 infection. Frequencies (A) and cell numbers (B) of subsets (in A, n = 11 and 16 for WT mice, 12 and 13 for Gfi1cKO mice on Day 15 and 30, respectively. For (B), n = 11 for WT mice at both time points, and n = 12 and 7 for Gfi1cKO mice on Day 15 and 30, respectively). C, D. Frequencies (C) and cell numbers (D) of GP33 + subsets in CD4-depleted WT (n = 8 for both time points) and Gfi1cKO mice (n = 7 and 12, respectively, for Day 15 and 30). E CD45.1+ mice reconstituted with WT (n = 7) or Gfi1cKO (n = 9) CD45.2+ BM cells (chimeric mice) were infected with LCMV Cl-13. GP33+ CD8+ T cell responses in CD45.1+ and CD45.2+ compartments were analyzed on Day 30 post-infection. F Sorted exhausted subsets (Progenitors: n = 6; Ly108+CX3CR1+: n = 7; effector-like: n = 6; Term-Exh: n = 6) from Day 30 LCMV Cl-123-infected Gfi1tdTomato reporter mice were adoptively transferred into naïve CD45.1+ recipients, followed by LCMV Cl-13 infection on the next day. Progenies of adoptively transferred cells were characterized for their expression of Ly108 and CX3CR1 on Day 8 post-infection. Cell counts of subsets were shown by the scatter dot plot. Data (mean ± s.e.m) were pooled from 2-4 independent experiments and analyzed by two-way ANOVA with Holm-Sidak’s post-hoc test. Source data are provided as a Source Data file.
Fig. 4
Fig. 4. Gfi1 controls the chromatin accessibility and transcriptomic programs required for the formation of exhausted effector-like and Term-Exh CD8+ T cells.
Exhausted GP33+ subsets from WT and Gfi1cKO mice were sorted on Day 30 post-LCMV Cl-13 infection for ATAC-seq (AE) or RNA-seq (F). A Differentially accessible chromatin regions (DACRs) between Gfi1cKO versus WT progenitors and Ly108+CX3CR1+ cells, with a cutoff of 1.2 log2 fold. B DACRs of progenitor versus Ly108+CX3CR1+ subsets in WT and Gfi1cKO cells. C Heatmap visualization of DACRs between Gfi1cKO and WT cells were shown. k-means clusters with numbers of DACRs indicated in the parentheses for each cluster. D Genomic tracks of accessibility at Mef2c and Lef1 loci in WT (progenitor, Ly108+CX3CR1+, effector-like) as well as Gfi1cKO (progenitors, Ly108+CX3CR1+) subsets. E De novo HOMER motif analysis of DACRs from Gfi1cKO versus WT Ly108+CX3CR1+ cells. F Heatmap visualization of select transcripts for transcription factors in WT and Gfi1cKO GP33+ subsets. ATAC- and RNA-seq data were from 2 and 3-4 independent replicates. Each replicate was a pooled sample of 3-5 mice.
Fig. 5
Fig. 5. Gfi1 is necessary for the accumulation of terminally differentiated Tim-3hi tumor infiltrating CD8+ T cells in late-stage tumors.
A Tumor growth dynamics of Gfi1tdTomato reporter mice subcutaneously inoculated with 1 × 105 MB49 cells. B Identification of TCF1hi progenitor and Tim-3hi effector CD8+ TILs with total cell counts and ratios of Tim-3hi to TCF1hi on Days 7 (n = 11), 14 (n = 13), and 22 (n = 11) post-inoculation. C Histograms showing the expression of 2B4, LAG-3, PD-1, and TOX in TCF1hi (progenitor) and Tim-3hi TILs. D Flow plots of Gfi1tdTomato expression in progenitor and Tim-3hi CD8+ TILs at different time points, with the frequencies for subsets on Day 14 shown in the scatter dot plot (n = 6). E Flow plots showing expression of Gfi1tdTomato with TCF1, TOX, Eomes, and T-bet in progenitor cells with their GMFIs depicted (n = 5–7). F Tumor growth dynamics and masses on Days 7, 12, and 21 in WT (n = 10, 16, & 17) and Gfi1cKO (n = 11, 16 & 18) mice post the inoculation of MB49 cells. G Flow plots showing the abundance of Tim-3hi and TCF1hi progenitor TILs in tumors from WT (n = 10, 18, & 17) and Gfi1cKO (n = 10, 16, & 18) mice as well as their ratios on Day 7, 12, and 21 post-tumor inoculation. H Distribution of Tim-3hiT-bethi and Tim-3hiT-betlo effector TILs as well as Tim-3loT-betint progenitor TILs (Left) and their frequencies of TOXhi and Eomeshi cells (Right) on Day 21 tumors from WT (n = 8) and Gfi1cKO (n = 10) mice. I Perforin and granzyme (B) production by WT (n = 6) and Gfi1cKO (n = 7) CD8+ TILs. Data (mean ± s.e.m.) were pooled results from 2–4 independent experiments, with each dot indicating an individual mouse. Data were analyzed by two-way ANOVA (B Left, D, FH), one-way ANOVA (B, Right), repeated one-way ANOVA (E), and unpaired two-tail t test (I). Holm-Sidak’s post hoc test was used unless otherwise stated. Source data are provided as a Source Data file.
Fig. 6
Fig. 6. Gfi1 expression in T cells is required for anti-CTLA-4 efficacy.
WT and Gfi1cKO mice inoculated with MB49 cells were treated with anti-CTLA-4 on Days 5, 8, and 11 post-inoculation. Tumor growth dynamics was depicted in the line graph (A, n = 4). Tumors were harvested to evaluate the infiltration of CD4+ and CD8+ T cells (B, n = 7 for untreated and 8 for treated groups of both WT and Gfi1cKO mice) and IFN-γ production by CD8+ TILs (C, n = 7 for untreated WT mice, = 8 for treated WT mice, = 5 for untreated Gfi1cKO mice, and = 6 for treated Gfi1cKO mice). D WT (n = 4 in the untreated group and = 5 in the treated group) and Gfi1cKO (n = 7 in the untreated group and 5 in the treated group) mice bearing palpable MC38 bladder tumors were treated with or without anti-CTLA-4 on Days 5, 8, and 11 post-tumor inoculation. Tumor growth dynamics was shown in the line graph. E, F Tumors were harvested to evaluate the infiltration of CD4+ and CD8+ T cells (E n = 8 for untreated WT and 9 for treated WT; n = 11 for untreated Gfi1cKO and 12 for treated Gfi1cKO) and IFN-γ production by CD8+ TILs (F n = 9 for untreated and treated WT; n = 11 for untreated Gfi1cKO and 12 for treated Gfi1cKO). Data (mean ± s.e.m.) were pooled results from 2-3 independent experiments, with each dot denoting a mouse. Two-way ANOVA with Holm-Sidak post hoc test was used. Source data are provided as a Source Data file.

Update of

Similar articles

References

    1. Blank, C. U. et al. Defining ‘T cell exhaustion. Nat. Rev. Immunol.19, 665–674 (2019). - PMC - PubMed
    1. Zajac, A. J. et al. Viral immune evasion due to persistence of activated T cells without effector function. J. Exp. Med.188, 2205–2213 (1998). - PMC - PubMed
    1. Mueller, S. N. & Ahmed, R. High antigen levels are the cause of T cell exhaustion during chronic viral infection. Proc. Natl. Acad. Sci. USA106, 8623–8628 (2009). - PMC - PubMed
    1. Utzschneider, D. T. et al. T Cell factor 1-expressing memory-like CD8(+) T cells sustain the immune response to chronic viral infections. Immunity45, 415–427 (2016). - PubMed
    1. Bucks, C. M., Norton, J. A., Boesteanu, A. C., Mueller, Y. M. & Katsikis, P. D. Chronic antigen stimulation alone is sufficient to drive CD8+ T cell exhaustion. J. Immunol.182, 6697–6708 (2009). - PMC - PubMed

MeSH terms