

Holocene shifts in marine mammal distributions around Northern Greenland revealed by sedimentary ancient DNA
- PMID: 40374632
- PMCID: PMC12081675
- DOI: 10.1038/s41467-025-59731-0
Holocene shifts in marine mammal distributions around Northern Greenland revealed by sedimentary ancient DNA
Abstract
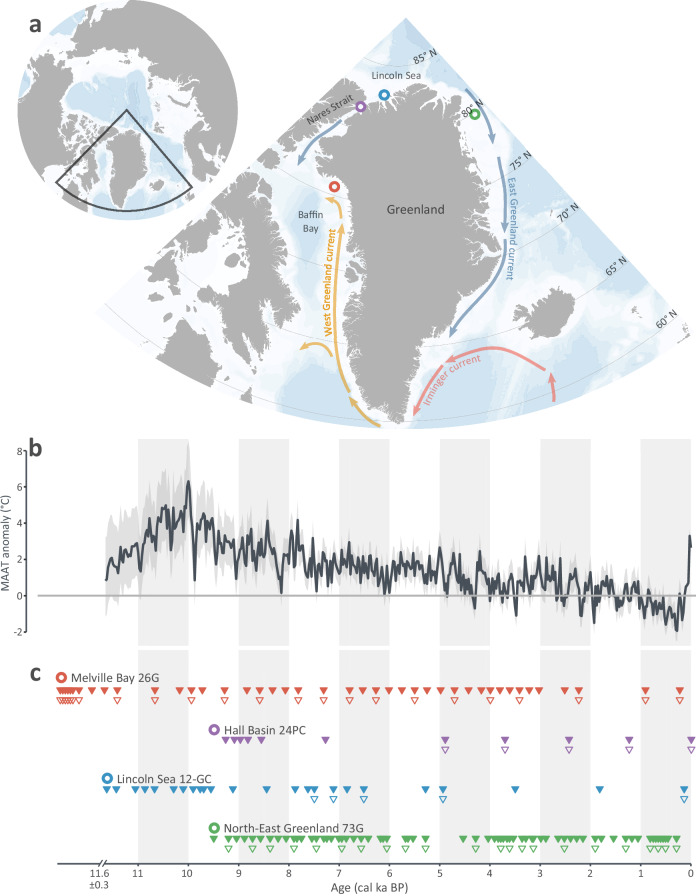
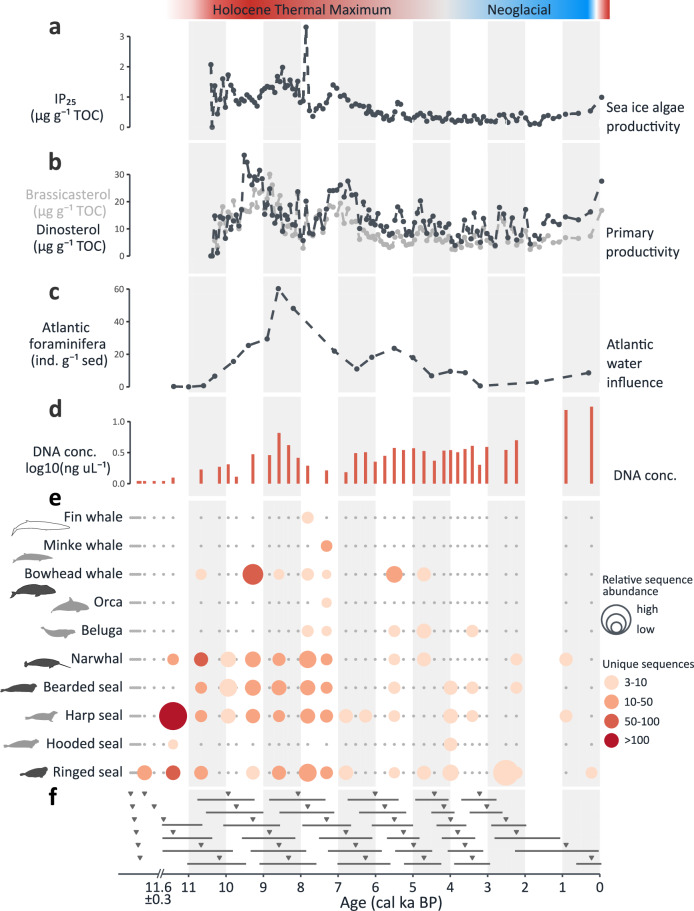
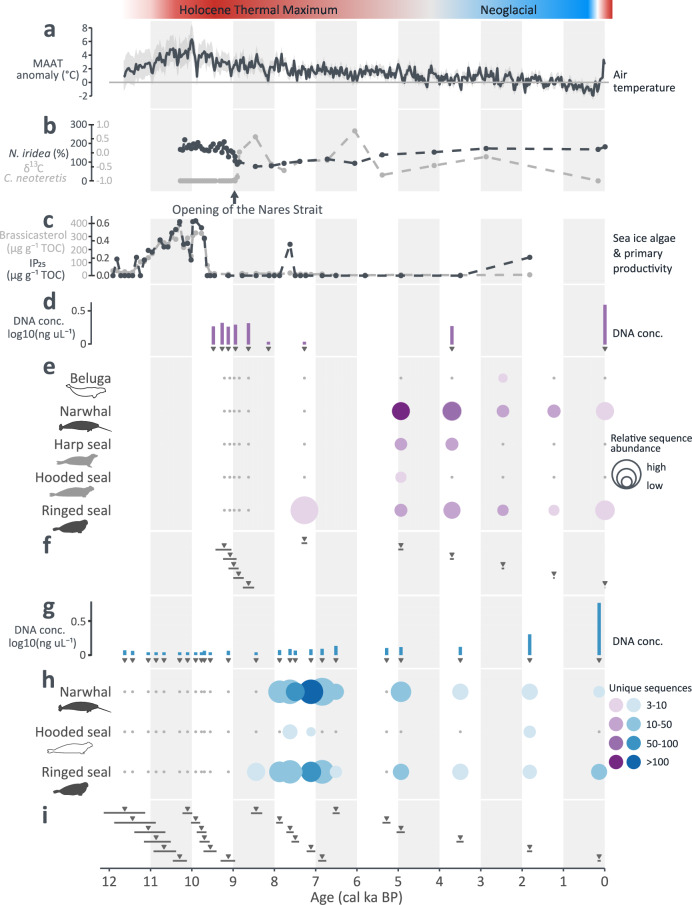
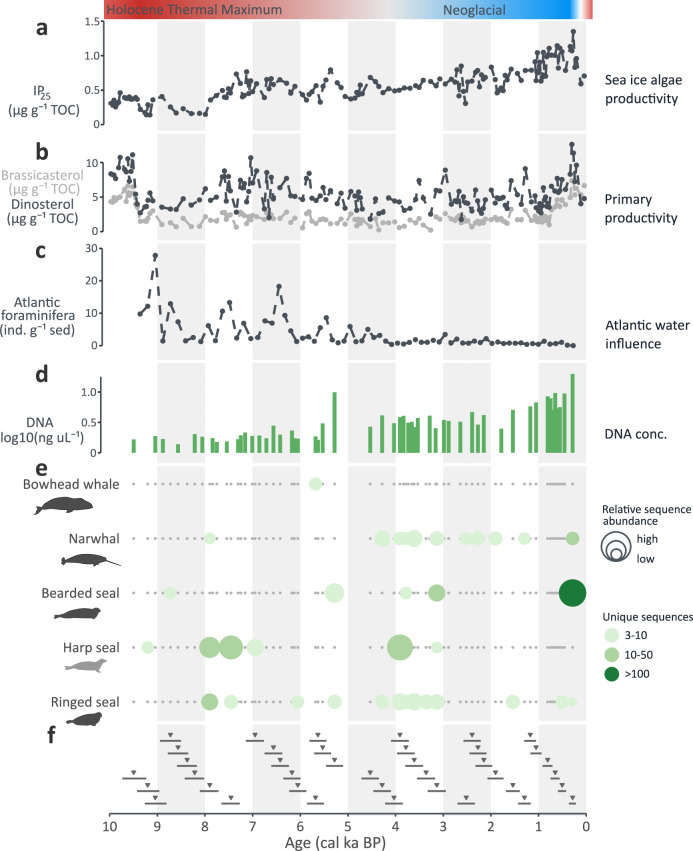
Arctic marine ecosystems have undergone notable reconfigurations in response to Holocene climate and environmental changes. Yet our understanding of how marine mammal occurrence was impacted remains limited, due to their relative scarcity in the fossil record. We reconstruct the occurrence of marine mammals across the past 12,000 years through detections based on sedimentary ancient DNA from four marine sediment cores collected around Northern Greenland, and integrate the findings with local and regional environmental proxy records. Our findings indicate a close association between marine mammals at densities detectable in marine sediments and the deglaciation of high Arctic marine environments at the onset of the Holocene. Further, we identify air temperature and changes in sea ice cover as significant drivers of community change across time. Several marine mammals are detected in the sediments earlier than in the fossil record, for some species by several thousand years. During the Early-to-Mid Holocene, a period of warmer climate, we record northward distribution shifts of temperate and low-arctic marine mammal species. Our findings provide unique, long-term baseline data on the occurrence of marine mammals around Northern Greenland, enabling insights into past community dynamics and the effects of Holocene climatic shifts on the region's marine ecosystems.
© 2025. The Author(s).
Conflict of interest statement
Competing interests: The authors declare no competing interests.
Figures
Similar articles
-
The potential of sedimentary ancient DNA for reconstructing past sea ice evolution.ISME J. 2019 Oct;13(10):2566-2577. doi: 10.1038/s41396-019-0457-1. Epub 2019 Jun 24. ISME J. 2019. PMID: 31235841 Free PMC article.
-
Marine ecosystem shifts with deglacial sea-ice loss inferred from ancient DNA shotgun sequencing.Nat Commun. 2023 Mar 24;14(1):1650. doi: 10.1038/s41467-023-36845-x. Nat Commun. 2023. PMID: 36964154 Free PMC article.
-
Ancient plant DNA reveals High Arctic greening during the Last Interglacial.Proc Natl Acad Sci U S A. 2021 Mar 30;118(13):e2019069118. doi: 10.1073/pnas.2019069118. Proc Natl Acad Sci U S A. 2021. PMID: 33723011 Free PMC article.
-
Climate change impacts on wildlife in a High Arctic archipelago - Svalbard, Norway.Glob Chang Biol. 2017 Feb;23(2):490-502. doi: 10.1111/gcb.13381. Epub 2016 Jun 28. Glob Chang Biol. 2017. PMID: 27250039 Review.
-
Past changes in Arctic terrestrial ecosystems, climate and UV radiation.Ambio. 2004 Nov;33(7):398-403. doi: 10.1579/0044-7447-33.7.398. Ambio. 2004. PMID: 15573568 Review.
Cited by
-
Ancient environmental DNA indicates limited human impact on marine biodiversity in pre-industrial Iceland.Philos Trans R Soc Lond B Biol Sci. 2025 Jul 10;380(1930):20240031. doi: 10.1098/rstb.2024.0031. Epub 2025 Jul 10. Philos Trans R Soc Lond B Biol Sci. 2025. PMID: 40635440 Free PMC article.
References
-
- Rantanen, M. et al. The Arctic has warmed nearly four times faster than the globe since 1979. Commun. Earth Environ.3, 168 (2022).
-
- Yadav, J., Kumar, A. & Mohan, R. Dramatic decline of Arctic sea ice linked to global warming. Nat. Hazards103, 2617–2621 (2020).
-
- Jahn, A., Holland, M. M. & Kay, J. E. Projections of an ice-free Arctic Ocean. Nat. Rev. Earth Environ.5, 164–176 (2024).
-
- Brandt, S., Wassmann, P. & Piepenburg, D. Revisiting the footprints of climate change in Arctic marine food webs: An assessment of knowledge gained since 2010. Front. Mar. Sci.10, 1096222 (2023).
-
- Deb, J. C. & Bailey, S. A. Arctic marine ecosystems face increasing climate stress. Environ. Rev.31, 403–451 (2023).
MeSH terms
Substances
LinkOut - more resources
Full Text Sources
Miscellaneous
