. 2025 May 15;16(1):4521.
doi: 10.1038/s41467-025-59850-8.

GzESTY as an optimized cell-based assay for initial steps in GPCR deorphanization

Affiliations

GzESTY as an optimized cell-based assay for initial steps in GPCR deorphanization

Luca Franchini et al. Nat Commun. .

Abstract

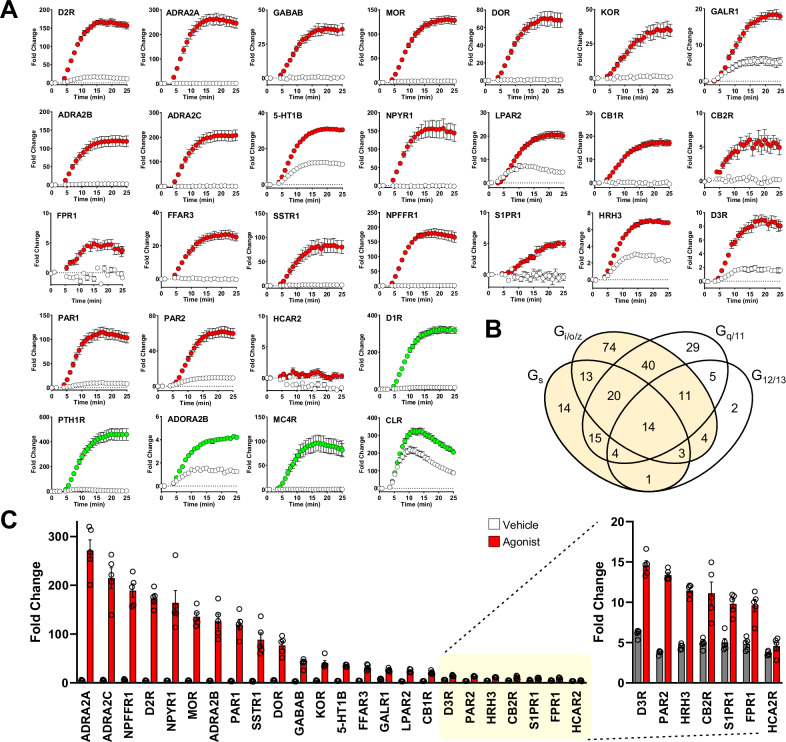
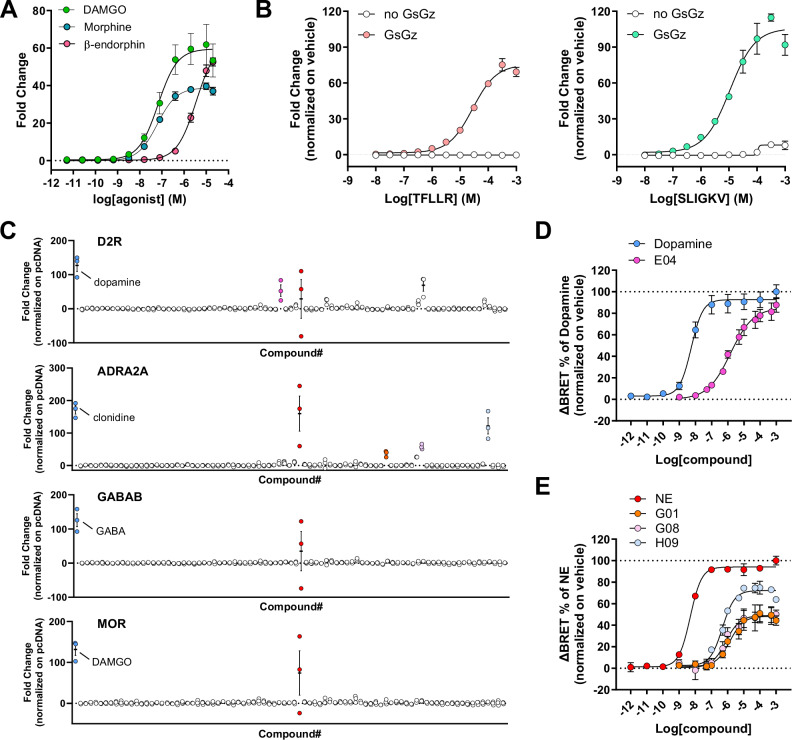
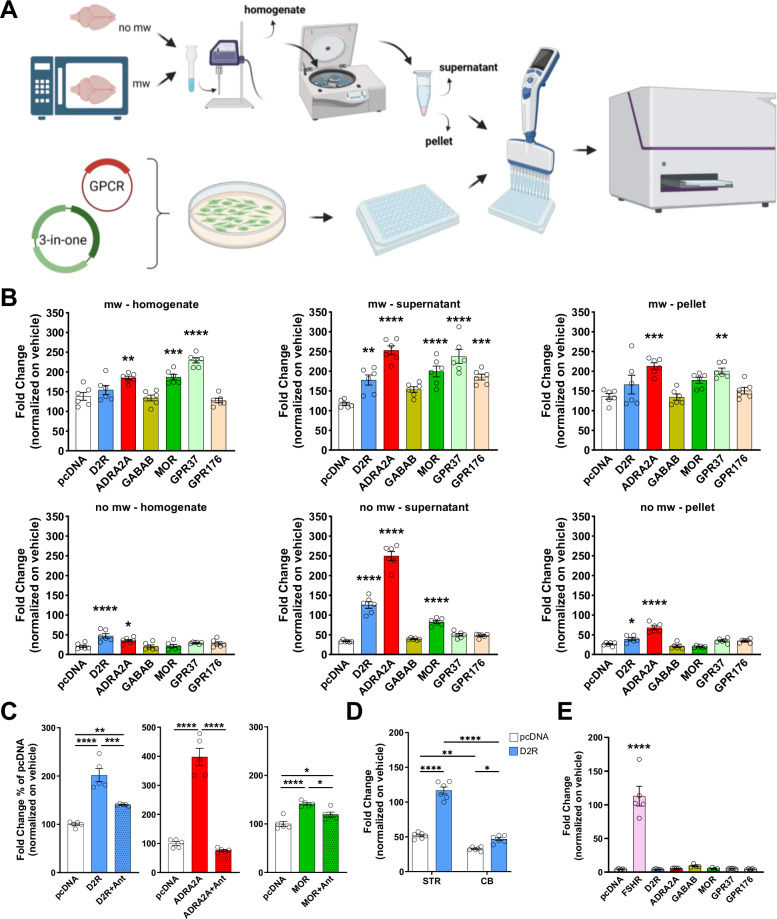
G protein-coupled receptors (GPCRs) are key pharmacological targets, yet many remain underutilized due to unknown activation mechanisms and ligands. Orphan GPCRs, lacking identified natural ligands, are a high priority for research, as identifying their ligands will aid in understanding their functions and potential as drug targets. Most GPCRs, including orphans, couple to Gi/o/z family members, however current assays to detect their activation are limited, hindering ligand identification efforts. We introduce GzESTY, a sensitive, cell-based assay developed in an easily deliverable format designed to study the pharmacology of Gi/o/z-coupled GPCRs and assist in deorphanization. We optimized assay conditions and developed an all-in-one vector employing cloning methods to ensure the correct expression ratio of GzESTY components. GzESTY successfully assessed activation of a library of ligand-activated GPCRs, detecting both full and partial agonism, and responses from endogenous GPCRs. Notably, with GzESTY we established the presence of endogenous ligands for GPR176 and GPR37 in brain extracts, validating its use in deorphanization efforts. This assay enhances the ability to find ligands for orphan GPCRs, expanding the toolkit for GPCR pharmacologists.


Conflict of interest statement

Competing interests: The authors declare no competing interests.

Figures

Fig. 1
Fig. 1. Real-time activation of Gs-based chimeras by Gi/o/z-coupled receptors.
A Kinetics of cAMP accumulation in response to agonist stimulation of indicated GPCRs using 10 µM dopamine, 10 µM clonidine, 10 µM GABA, and 1 µM DAMGO, respectively. B Correlation between maximal amplitude and basal signal for each receptor co-expressed with indicated G protein chimeras. C Fold change calculated as the ratio of maximal amplitude over baseline reported in panel (B). Data are shown as means ± SEM. N = 3 independent replicates (one-way ANOVA with Tukey’s multiple comparisons test, *p  <  0.05; **p  <  0.01). In (C), *p = 0.0155 ADRA2A GsGo vs GsGz, *p = 0.0383 ADRA2A GsGi vs GsGz, *p = 0.0167 for MOR GsGo vs GsGz, **p = 0.0011 for GABAB GsGo vs GsGz, **p = 0.0039 for GABAB GsGi vs GsGz, *p = 0.0167 for MOR GsGo vs GsGz.
Fig. 2
Fig. 2. Optimization of transfection ratios between GzESTY components.
A Activation of indicated GPCRs with increasing amount of transfected Gs-based chimeras. N = 3 independent experiments. B GPCR activation with the introduction of increasing concentrations of PTX-S1 subunit to eliminate the inhibition of adenylyl cyclase by endogenous Gi/o proteins. N=3 independent experiments. C GPCR activation in the presence of increasing amount of transfected GsGz plasmid. N = 3 independent experiments. D Signal fold change with titration of each transfected receptor. N = 3. E Fold-change comparison between standard transfection ratio and optimized ratio 50:47.5:1.8:0.7 (GloSensor:GPCR:GsGz:PTX). The data shown represent the average of 3–6 independent experiments (N = 3–6) (one-way ANOVA with Dunnett’s multiple comparisons test, *p  <  0.05; **p  <  0.01; ***p  <  0.001; ****p  <  0.0001). Data are shown as means ± SEM.
Fig. 3
Fig. 3. GzESTY protocol optimization and Z factor calculation.
A Assay temperature influences assay sensitivity. Assays performed at 28 °C give a significantly higher signal. N = 5 independent experiments. B FBS removal (4 h serum starvation), use of charcoal-stripped FBS, or use of dialyzed FBS did not improve the assay signal. N = 5 independent experiments. C Assays performed with cells in adhesion show a signal improvement for GABAB receptor but not for D2R, ADRA2A, and MOR. N = 3 independent experiments. D Co-treatment with 50 µM IBMX (T 5’ setup) significantly increases the signal with each of the four GPCRs. Data shown represent the average of 3 independent experiments (N = 3). The effect of IBMX alone was subtracted from each experimental condition. One-way ANOVA with Dunnett’s multiple comparisons test, *p <  0.05; **p  <  0.01; ***p  <  0.001; ****p  <  0.0001. Data are shown as means ± SEM. E Cells transiently transfected with D2R were treated with either 10 µM dopamine or vehicle. Dashed lines represent the means of the fold change. Dotted lines display three standard deviations from the mean of each data set. F Cells transfected with indicated plasmids were treated with 10 µM dopamine. Dashed lines represent the means of the fold change for cells expressing D2R or cells not expressing exogenous GPCRs (pcDNA, control). G Z factor calculation. Dotted lines indicate the threshold for robust assays. Data shown in panels (E and F) are representative of three independent experiments quantified in panel (G) as means ± SEM.
Fig. 4
Fig. 4. All-in-one GzESTY plasmids.
A Schematics of GzESTY and each of its components (created in BioRender. Orlandi, C. (2025) https://BioRender.com/hs1vfma). B Promoter efficiency estimation calculated as Nluc luminescence normalized over firefly luminescence signal in HEK293 cells transfected with a plasmid encoding nanoluc under the control of each of the indicated promoters and firefly under the control of UbC promoter. Data are shown as means ± SEM; N = 6 independent transfections. C Maps of the all-in-one plasmids generated. D Assay comparison in cells transiently transfected with four single plasmids or with each of the 4-in-one plasmids encoding each indicated GPCR. MP multiple plasmids. Data are shown as means ± SEM; N = 5 independent transfections.
Fig. 5
Fig. 5. GzESTY applied to a battery of ligand-activated GPCRs.
A Real-time analysis of ligand-mediated activation of a battery of Gi/o/z-PCRs (red) and Gs-PCR (green) in cells co-transfected with indicated receptors and the 3-in-one GzESTY plasmid in the presence of 50 µM IBMX. Cells transfected only with the 3-in-one plasmid served as control (white). The following agonists were applied at 4 min: 10 µM dopamine (D2R, D1R), 100 µM clonidine (ADRA2A, ADRA2B, ADRA2C), 10 µM GABA (GABABR), 10 µM DAMGO (MOR), 1 µM SNC-80 (DOR), 10 µM salvinorin A (KOR), 10 µM human galanin (1–30) (GAL1R), 100 µM serotonin (5-HT1B), 10 µM human neuropeptide Y (13–36) (NPYR1), 10 µM lysophosphatidic acid (LPAR2), 10 µM 2-arachidonoyl glycerol (CB1R, CB2R), 10 µM N-formyl-met-leu-phe (FPR1), 1 mM isobutyric acid (FFAR3), 10 µM somatostatin 14 (SSTR1), 10 µM neuropeptide FF (NPFFR1), 10 µM SEW2871 (S1PR1), 10 µM histamine (HRH3), 10 µM quinpirole (D3R), 10 µM TFLLR (PAR1), 10 µM SLIGKV (PAR2), 10 µM MK-6892 (HCA2R), 1 µM teriparatide PTH (PTH1R), 10 µM AB-MECA (ADORA2B), 10 µM NDP-α-MSH (MC4R), and 10 µM CGRP (CLR). Data are shown as means ± SEM; N = 5 independent transfections. B GPCRs that couple to Gs and/or Gi/o/z and can potentially be detected by GZESTY are highlighted and include 213 out of 249 total ligand-activated GPCRs (86%) (adapted from GPRCdb.org). C Quantification of agonist-induced activity for 24 Gi/o/z-coupled GPCRs. On the right, the response to agonist of the last seven GPCRs is also reported with a different scale. Data are shown as means ± SEM of the fold change obtained; N = 5 independent transfections.
Fig. 6
Fig. 6. GzESTY applications.
A Concentration-response curves obtained for MOR stimulated with DAMGO, morphine, or β-endorphin. Data are shown as means ± SEM; N = 3 independent transfections. B Concentration-response curves of endogenously expressed PAR1 activated with a selective agonist peptide TFLLR (left) or PAR2 activated with selective agonist peptide SLIGKV (right) in cells transfected only with the 3-in-one plasmid. Control cells were transfected with a 2-in-one plasmid not expressing GsGz chimera. Data are shown as means ± SEM; N = 3 independent transfections. C Results obtained applying GzESTY to screen the small library of orphan ligands, 84 compounds with putative or potential biological activity, whose cellular targets are currently unknown (Enzo Life Sciences SCREEN-WELL orphan ligand library). In blue are positive control agonists for each receptor; in red is a common hit likely activating an endogenously expressed GPCR (dihydroxynorephedrine). Data are shown as means ± SEM; N = 3 independent transfections. D Concentration-response curves obtained using G protein nanoBRET assay to validate positive hits activating D2R with compound E04 (salsolinol-1-carboxylic acid) or dopamine. Data are shown as means ± SEM; N = 3 independent transfections. E Concentration-responses for ADRA2A activated in response to the application of compounds G01 (tryptamine), G08 (3-hydroxyphenethylamine), H09 (octopamine), or norepinephrine (NE). Data are shown as means ± SEM; N = 3 independent transfections.
Fig. 7
Fig. 7. Analysis of GPCR activation by tissue extract application using GzESTY.
A Schematics of the protocol applied to prepare six different brain extracts: no-mw-homogenate, no-mw-supernatant, no-mw-pellet, mw-homogenate, mw-supernatant, and mw-pellet. Brain homogenates were sonicated and centrifuged to obtain a supernatant fraction, and a pellet that was resuspended in PBS and further sonicated. Each fraction was then applied to cells transfected with GzESTY and distributed in 96-well plates. cAMP levels were measured before and after brain extract application for a total of 25 min (created in BioRender. Orlandi, C. (2025) https://BioRender.com/f88k131). B The six different brain extract preparations induce different level of activation of D2R, ADRA2A, MOR, GPR37 and GPR176. One-way ANOVA with Dunnett’s multiple comparisons test, *p  <  0.05; **p  <  0.01; ***p  <  0.001; ****p  <  0.0001. Data are shown as means ± SEM; N = 6. C Co-application of 10 µM of selective GPCR antagonists occlude the brain-induced activation of D2R, ADRA2A, and MOR. Antagonists applied were: L-741626 (D2R), RS-79948 (ADRA2A), and naloxone (MOR). One-way ANOVA with Tukey’s multiple comparisons test, *p  <  0.05; **p  <  0.01; ***p  <  0.001; ****p  <  0.0001. Data are shown as means ± SEM; N = 5. D Quantification of D2R response to application of no-mw extracts obtained from mouse striatum (STR) or cerebellum (CB). Cells transfected with pcDNA served as negative control. Two-way ANOVA with Tukey’s multiple comparisons test, *p  <  0.05; **p  <  0.01; ****p  <  0.0001. Data are shown as means ± SEM; N = 6. E Quantification of indicated GPCR activation in response to application of bovine pituitary extract. FSH receptor served as a positive control and pcDNA as negative control. One-way ANOVA with Dunnett’s multiple comparisons test, ****p  <  0.0001. Data are shown as means ± SEM; N = 4–5; mw microwaved, no mw not microwaved.

Similar articles

References

    1. Insel, P. A. et al. GPCRomics: an approach to discover GPCR drug targets. Trends Pharm. Sci.40, 378–387 (2019). - PMC - PubMed
    1. Sriram, K. & Insel, P. A. G protein-coupled receptors as targets for approved drugs: how many targets and how many drugs? Mol. Pharm.93, 251–258 (2018). - PMC - PubMed
    1. Gomes, I. et al. GPR171 is a hypothalamic G protein-coupled receptor for BigLEN, a neuropeptide involved in feeding. Proc. Natl Acad. Sci. USA110, 16211–16216 (2013). - PMC - PubMed
    1. Gomes, I. et al. Identification of GPR83 as the receptor for the neuroendocrine peptide PEN. Sci. Sig9, ra43 (2016). - PMC - PubMed
    1. Yosten, G. L. et al. GPR160 de-orphanization reveals critical roles in neuropathic pain in rodents. J. Clin. Invest.130, 2587–2592 (2020). - PMC - PubMed

LinkOut - more resources