. 2025 May 15;16(1):4525.
doi: 10.1038/s41467-025-59650-0.

Chemotactic Zn micromotor for treatment of high blood ammonia-associated hepatic encephalopathy

Affiliations

Chemotactic Zn micromotor for treatment of high blood ammonia-associated hepatic encephalopathy

Ye Feng et al. Nat Commun. .

Abstract

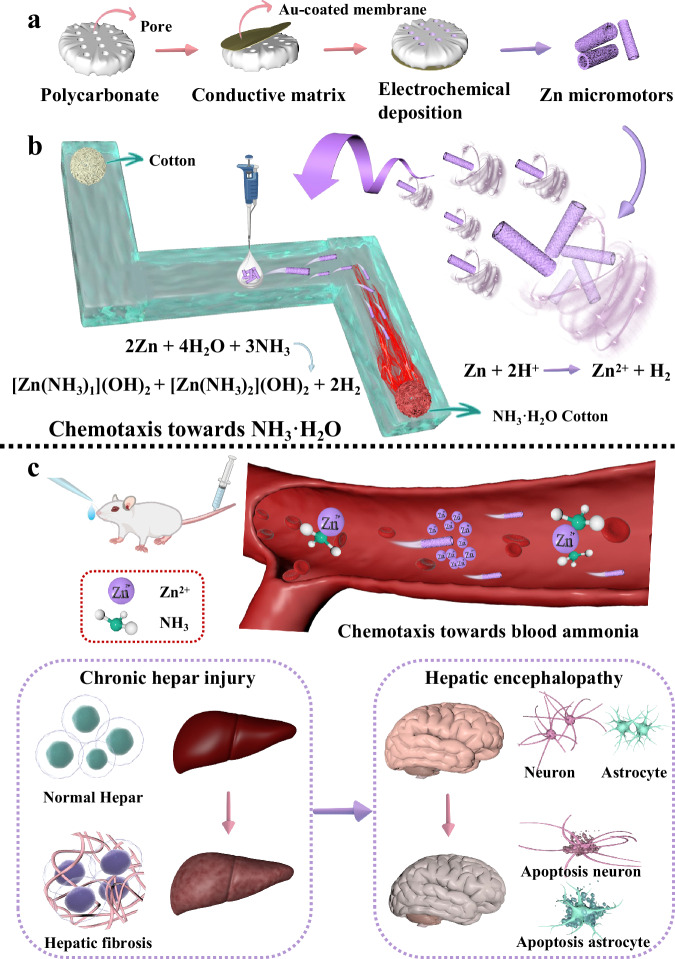
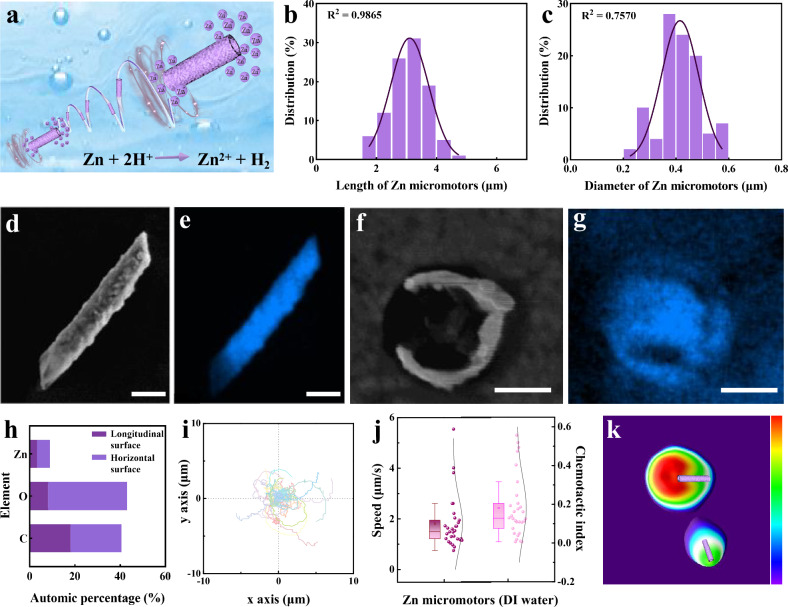
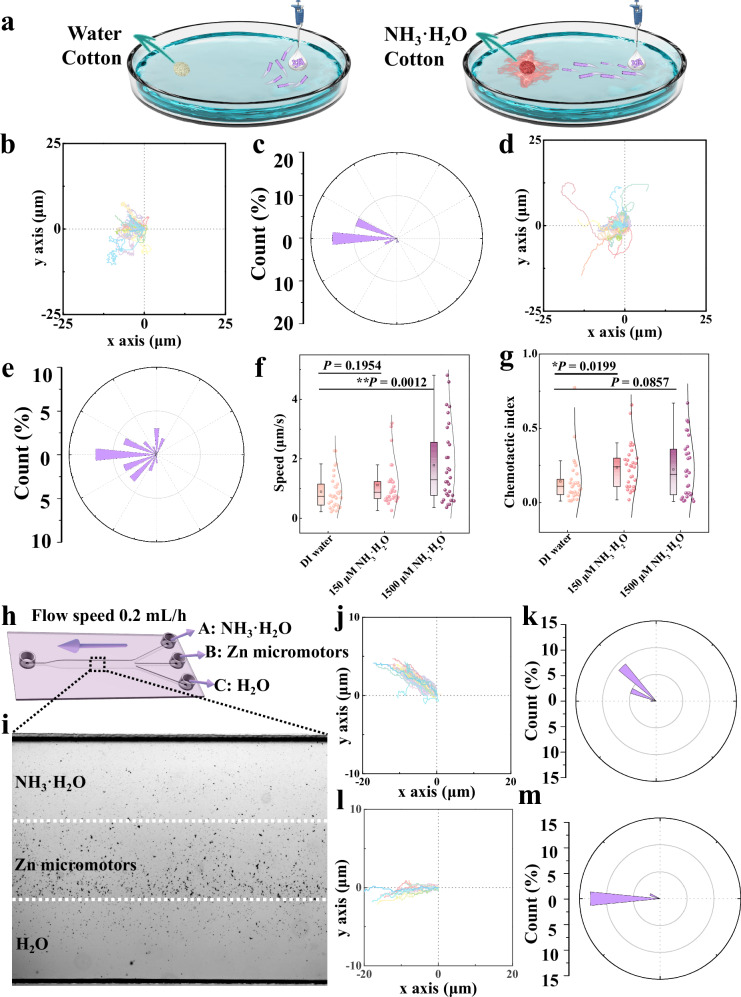
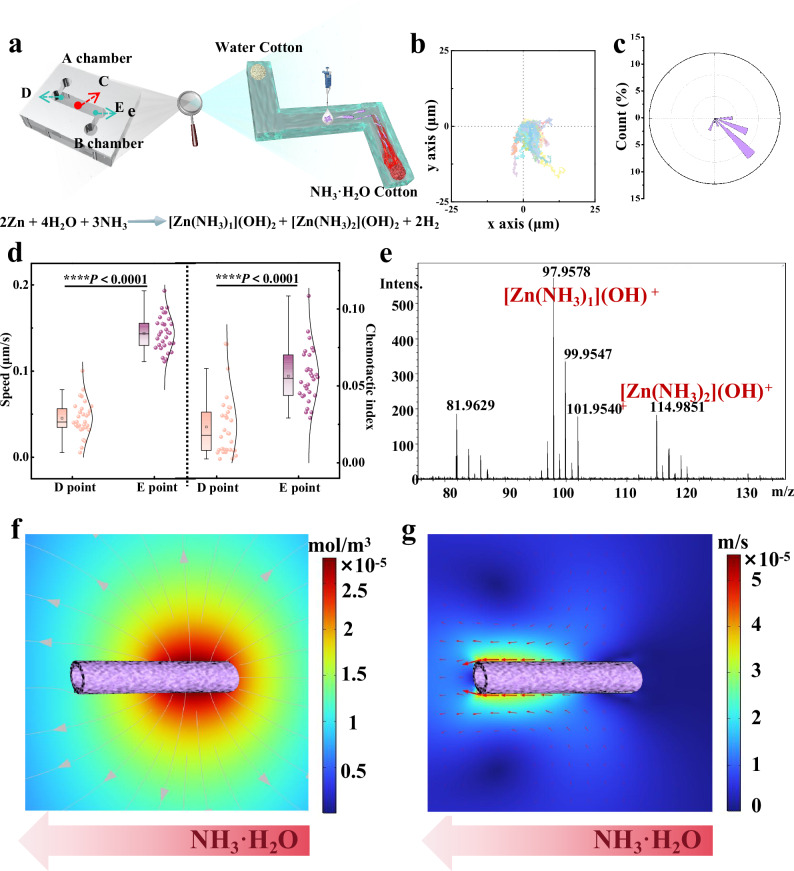
Hepatic fibrosis involves hepatocyte damage, causing blood ammonia accumulation, which exacerbates liver pathology and crosses the blood-brain barrier, inducing hepatic encephalopathy. It is meaningful to construct a therapeutic platform for targeted ammonia clearance. In this work, a biocompatible water-powered Zn micromotor is constructed as an ammonia chemotaxis platform, which can be actuated by the water splitting reaction and the self-generated Zn2+ gradient. It can propel towards NH3·H2O source through the formation of complex ions [Zn(NH3)1](OH)+ and [Zn(NH3)2](OH)+, representing a generalizable chemotaxis strategy via coordination reaction. In vivo, biomimetic collective behavior allows precise navigation and reduction of the intrahepatic ammonia level, reshaping the pathological microenvironment. This mechanism, operating in a green, zero-waste manner, facilitates integration of these micromotors into the domain of biological regulation. Such environment environment-adaptive platform is favorable for targeted treatment of hepatic fibrosis and hepatic encephalopathy caused by hyperammonemia, which is expected to provide inspiration for future personalized and precision medicine.


Conflict of interest statement

Competing interests: The authors declare no competing interests.

Figures

Fig. 1
Fig. 1. Schematic diagram showing the construction of Zn micromotors, chemotactic migration towards NH3·H2O, and targeting to promote ammonia metabolism in vivo.
a Manufacture of Zn micromotors by electrodeposition using the PC membrane template method. b Chemotactic migration evaluation of Zn micromotors towards ammonia. In a Z-shaped glass channel, ammonia is added at one end of the channel, and the diffusion of ammonia creates a concentration gradient, guiding the Zn micromotors to migrate towards ammonia ammonia-enriched region. c Zn micromotors assist ammonia metabolism and improve hepatic fibrosis. Micromotors further reduce brain permeable ammonia, slow down neuronal death, and improve hepatic encephalopathy. Some elements in this figure are reproduced from the MATRIX resource library, copyright Hangzhou SPHERE Tech. Ltd.
Fig. 2
Fig. 2. Characterization and motion performance of Zn micromotors.
a Self- propulsion mechanism of Zn micromotors in water. b Length distribution of Zn micromotors. c Diameter distribution of Zn micromotors. d SEM image of a single Zn micromotor. Scale bar: 600 nm. e Elemental mapping of a Zn micromotor. Scale bar: 600 nm. f SEM image of a single Zn micromotor cross section. Scale bar: 200 nm. g Elemental mapping of a Zn micromotor cross section. Scale bar: 200 nm. h Element composition corresponding to Zn micromotor (on silicon substrate). i Normalized moving trajectories of the Zn micromotors within 10 s (time interval = 100 ms) (n = 30 independent samples). j Statistics of speed and directionality of Zn micromotors in water (n = 30 independent samples). Results were shown as box plots (The box represents the interquartile range (IQR), with the middle line indicating the median, the top and bottom edges of the box show the upper (Q3) and lower (Q1) quartiles respectively, while the whiskers extend to the maximum and minimum values of the dataset.) k Fluorescence intensity analysis of Zn2+ around the Zn micromotors. In d-g, the full name of Zn is Zinc. In d-h and k, the experiment was repeated independently three times with similar results, and a representative result is shown. Data in b, c, i and j represented as mean values ± S.D. Source data are provided as a Source Data file. Some elements in this figure are reproduced from the MATRIX resource library, copyright Hangzhou SPHERE Tech. Ltd.
Fig. 3
Fig. 3. Chemotaxis kinetics evaluation of Zn micromotors.
a Schematic diagram of chemotactic movement of Zn micromotors in Petri dish. b Normalized movement trajectories and c Corresponding statistics of the direction distribution of Zn micromotor movement (n = 30 independent samples) were recorded when cotton soaked with 150 μM NH3·H2O (10 μL) was added to the left side. d Normalized movement trajectories and e Corresponding statistics of the distribution of the direction distribution of Zn micromotors (n = 30 independent samples) were recorded when cotton soaked with 1500 μM NH3·H2O (10 μL) was added to the left side. f The movement speed of each group was compared (n = 30 independent samples). g The Chemotactic Index (CI) values of each group were compared (n = 30 independent samples). Results in f, g were shown as box plots (The box represents the interquartile range (IQR), with the middle line indicating the median, the top and bottom edges of the box show the upper (Q3) and lower (Q1) quartiles respectively, while the whiskers extend to the maximum and minimum values of the dataset.) DI Water is control group. h Schematic of chemotaxis of Zn micromotors in a three-inlet microfluidic channel. NH3·H2O was introduced via channel A, Zn micromotors was introduced via channel B, and H2O is introduced via channel C. i The observation recording site when the solution of each channel reached the steady-state profile. j The trajectories of Zn micromotors were recorded at the junction of channel A and B (n = 15 independent samples). k) Statistics on the moving direction distribution of Zn micromotors at the junction of channel A and B (n = 15 independent samples). l The trajectory of Zn micromotors was recorded at the junction of channel B and C (n = 15 independent samples). m Statistics on the moving direction distribution of Zn micromotors at the junction of channel B and C (n = 15 independent samples). Data in bg and jm represented as mean values ± S.D. P values were analyzed by Student’s t-test (two-tailed). The asterisks (*) denote statistical significance: **p < 0.01, *p < 0.05. Source data are provided as a Source Data file. Some elements in this figure are reproduced from the MATRIX resource library, copyright Hangzhou SPHERE Tech. Ltd.
Fig. 4
Fig. 4. Evaluation of chemotaxis dynamics of Zn micromotors in channel.
a Schematic diagram of chemotactic motion of Zn micromotors in channel. b Normalized motion trajectories and c Record the corresponding statistical data of the distribution of the movement direction of the Zn micromotor (n = 30 independent samples) at point E (near the cotton soaked in 150 mM ammonia solution). d Comparison of the movement speed and CI values of each group (n = 30 independent samples). Results were shown as box plots (The box represents the interquartile range (IQR), with the middle line indicating the median, the top and bottom edges of the box show the upper (Q3) and lower (Q1) quartiles respectively, while the whiskers extend to the maximum and minimum values of the dataset.) DI Water is control group. e ESI-MS of reaction products between Zn micromotors and NH3·H2O. The experiment was repeated independently three times with similar results, and a representative result is shown. f Concentration field of Zn micromotor simulated by COMSOL, a multi-physics field finite element analysis software. g Velocity field of Zn micromotor simulated by COMSOL, a multi-physics field finite element analysis software. Data in bd represented as mean ± S.D. P values were analyzed by Student’s t-test (two-tailed). The asterisks (*) denote statistical significance: ****p < 0.0001. Source data are provided as a Source Data file. Some elements in this figure are reproduced from the MATRIX resource library, copyright Hangzhou SPHERE Tech. Ltd.
Fig. 5
Fig. 5. Therapeutic effect of Zn micromotors on ammonia treated cells.
Oxidative stress indicators a GSH, b SOD and c MDA of AML-12 cells (n = 3 independent samples). Oxidative stress indicators d GSH, e SOD and f) MDA of HT22 cells (n = 3 independent samples). g Cell viability of AML-12 cells and h HT22 cells (n = 3 independent samples). i Cell migration image of AML-12 cells and j HT22 cells. The experiment was repeated independently three times with similar results, and a representative result is shown. Scale bar: 500 μm. Data in a-h represented as mean ± S.D. P values were analyzed by Student’s t-test (two-tailed). The asterisks (*) denote statistical significance: ****p < 0.0001, ***p < 0.001, **p < 0.01, *p < 0.05. Source data are provided as a Source Data file.
Fig. 6
Fig. 6. Evaluation of moving activity and biochemical tests of liver function in mice after Zn micromotor treatment.
a Schematic diagram of mouse treatment. b The balance beam test (n = 5 independent samples). c Y-maze spontaneous alternation experiment (n = 5 independent samples). d Motion trajectories after molding and treatment. Scale bar: 2 cm. e Ammonia. f AST. g ALT. h ALB. i TBIL. and j Zn levels in serum (n = 5 independent samples). Data in bj represent as mean ± S.D. P values were analyzed by Student’s t-test (two-tailed). The asterisks (*) denote statistical significance: ****p < 0.0001, **p < 0.01, *p < 0.05. Source data are provided as a Source Data file. Some elements in this figure are reproduced from the MATRIX resource library, copyright Hangzhou SPHERE Tech. Ltd.
Fig. 7
Fig. 7. Histopathological examination of the liver.
a Liver brain body weight ratio (n = 5 independent samples). b The decreasing rate of blood ammonia in mice of each group (n = 3 independent samples). c The decreasing rate of ammonia content in the liver of mice in each group (n = 3 independent samples). d GSH. e T-SOD. f MDA levels oxidative stress biomarkers in the liver (n = 5 independent samples). g Sirius-red staining images of liver tissue sections. Scale bar: 200 μm, 100 μm. h H&E stained images of liver tissue sections. Scale bar: 200 μm, 100 μm. Data in df represent as mean ± S.D. P values were analyzed by Student’s t-test (two-tailed). The asterisks (*) denote statistical significance: **p < 0.01, *p < 0.05. Source data are provided as a Source Data file.
Fig. 8
Fig. 8. Brain histopathological examination.
a The contents of glutamine in brain tissue of each group. (n = 3 independent samples) b GSH. c T-SOD. d MDA levels, oxidative stress biomarkers in the brain (n = 5 independent samples). e Nissl staining images of cerebral cortex and hippocampus. Scale bar: 100 μm, 200 μm. f Nissl staining statistical analysis of neurons and dark neurons in cerebral cortex (n = 5 independent samples). g Nissl staining statistical analysis of neurons and dark neurons in CA1 area of brain and hippocampus (n = 5 independent samples). h Nissl staining statistical analysis of neurons and dark neurons in CA3 area of brain and hippocampus (n = 5 independent samples). i Nissl staining statistical analysis of neurons and dark neurons in DG area of brain and hippocampus (n = 5 independent samples). Results in fi are shown as box plots (The box represents the interquartile range (IQR), with the middle line indicating the median, the top and bottom edges of the box show the upper (Q3) and lower (Q1) quartiles respectively, while the whiskers extend to the maximum and minimum values of the dataset). Data in ad and fi represent as mean ± S.D. P values were analyzed by Student’s t-test (two-tailed). The asterisks (*) denote statistical significance: ***p < 0.001, **p < 0.01, *p < 0.05. Source data are provided as a Source Data file.
Fig. 9
Fig. 9. Safety evaluation of Zn micromotors in vivo.
a Degradation degree of Zn micromotors in NH3·H2O (n = 30 independent samples). b Hemolysis experiment of Zn micromotors (n = 3 independent samples). Negative control: Red blood cells in 0.9% sodium chloride solution; Positive control: Red blood cells in water. c Metabolic kinetics of Zn micromotors in vivo (n = 3 independent samples). d H&E staining of main organs in each group, scale bar: 100 μm. The experiment was repeated independently three times with similar results, and a representative result is shown. Data in ac represent as mean ± S.D. P values were analyzed by Student’s t-test (two-tailed). Source data are provided as a Source Data file.

Similar articles

References

    1. Savy, N. et al. Acute pediatric hyperammonemia: current diagnosis and management strategies. Hepat. Med.-Evid. Res. 10, 105–115 (2018). - PMC - PubMed
    1. Rangroo Thrane, V. et al. Ammonia triggers neuronal disinhibition and seizures by impairing astrocyte potassium buffering. Nat. Med.19, 1643–1648 (2013). - PMC - PubMed
    1. Häussinger, D. Hepatocyte heterogeneity in glutamine and ammonia metabolism and the role of an intercellular glutamine cycle during ureogenesis in perfused rat liver. Eur. J. Biochem.133, 269–275 (1983). - PubMed
    1. Keiding, S., Munk, O., Roelsgaard, K., Bender, D. & Bass, L. Positron emission tomography of hepatic first-pass metabolism of ammonia in pig. Eur. J. Nucl. Med. Mol.28, 1770–1775 (2001). - PubMed
    1. Wierling, C. Bridging the gap between metabolic liver processes and functional tissue structure by integrated spatiotemporal modeling applied to hepatic ammonia detoxification. J. Gastroen. Hepatol. 60, 1823–1825 (2014). - PubMed

LinkOut - more resources