. 2025 May 15;15(1):16944.
doi: 10.1038/s41598-025-00866-x.

Tumor budding and poorly differentiated clusters as a biological continuum in colorectal cancer invasion and prognosis

Affiliations

Tumor budding and poorly differentiated clusters as a biological continuum in colorectal cancer invasion and prognosis

Tariq Sami Haddad et al. Sci Rep. .

Abstract

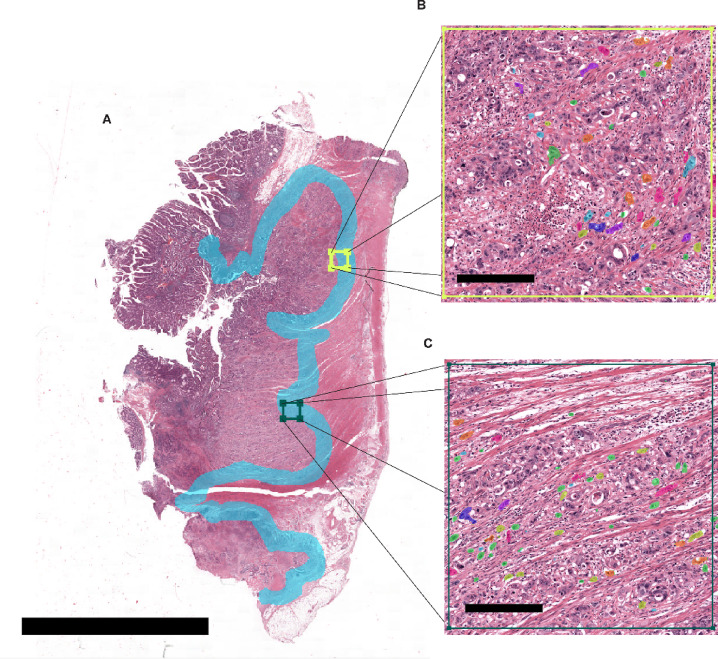
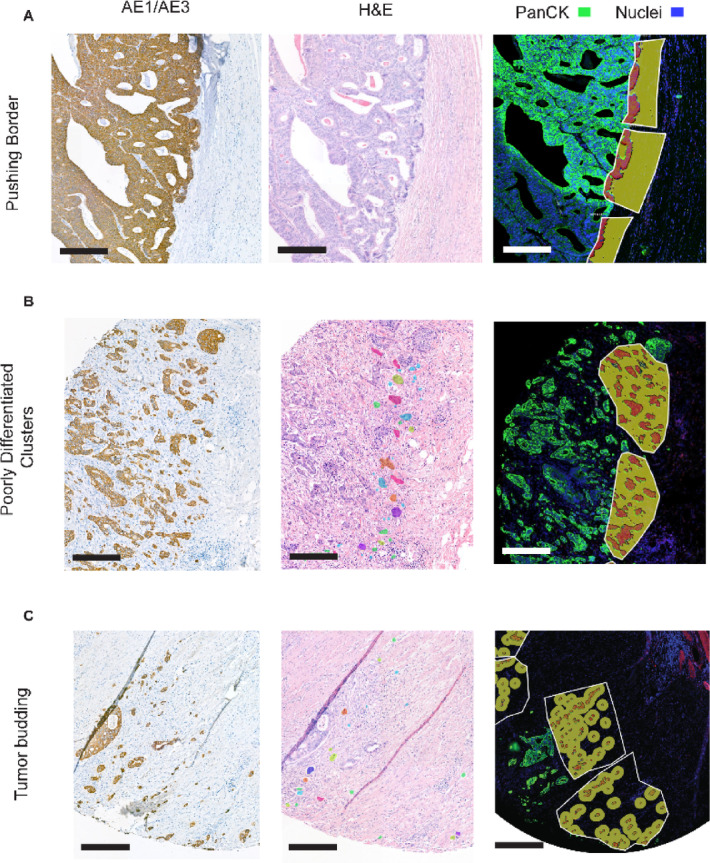
Tumor budding (TB) and poorly differentiated clusters (PDCs) are features of infiltrative growth patterns and powerful independent prognostic factors in colorectal cancer (CRC), yet the underlying biological mechanisms behind their role in CRC invasion is less understood. The aim of this study was to investigate the molecular background and prognostic role of tumor cluster size at the invasive margin (IM) of CRC, and determine whether a biological continuum between TB and PDCs exists. Using a combination of spatial transcriptomic and immunohistochemical (IHC) techniques, we demonstrated a biological continuum from larger to smaller tumor clusters, with TB possessing greater invasive potential than PDCs. We deployed artificial intelligence on a cohort of 1134 Stage I-III CRC resections to automatically detect nearly 400,000 isolated tumor cells/clusters of any particular size across the IM. We determined that 2-celled clusters were the most abundant feature at the IM, and the simultaneous assessment of TB and PDCs yielded a prognostic performance stronger than either independently. Our study provides a deeper understanding of the mechanisms behind CRC invasion while improving risk stratification for Stage I-III CRC.


Conflict of interest statement

Declarations. Competing interests: JvdL was a member of the advisory boards of Philips, the Netherlands and ContextVision, Sweden, and received research funding from Philips, the Netherlands, ContextVision, Sweden, and Sectra, Sweden in the last five years. He is chief scientific officer (CSO) and shareholder of Aiosyn BV, the Netherlands. FC was Chair of the Scientific and Medical Advisory Board of TRIBVN Healthcare, France, and received advisory board fees from TRIBVN Healthcare, France in the last five years. He is shareholder of Aiosyn BV, the Netherlands. All other authors declare no conflict of interest.

Figures

Fig. 1
Fig. 1
Tumor Budding (TB) and Poorly Differentiated Cluster (PDC) assessment using automated detection in H&E using deep learning. (A) An H&E slide processed with the automated TB detection algorithm in H&E used to detect single tumor cells and tumor clusters ≤ 10 cells. A hotspot detection algorithm is used where densities of tumor buds and PDCs along the invasive front are determined. (B) Detection of tumor cells/clusters within the PDC hotspot (area = 0.785 mm. Automatically detected tumor cells/clusters are denoted by the colored overlays. (C) Detection of tumor cells/clusters within the TB hotspot (area = 0.785 mm. Automatically detected tumor cells/clusters are denoted with the colored overlays. Colored overlays are not indicative of size. The TB and PDC hotspots in this particular case do not overlap. (Scale bar = 10 mm; Inset = 250 μm).
Fig. 2
Fig. 2
Overview of Tumor Budding (TB), Poorly Differentiated Cluster (PDC), and Pushing Border (PB) regions. (A) (Left) A PB region from a pan-cytokeratin stained TMA serial section. (Center) The same PB region from an H&E stained serial section. (Right) The same PB region from a TMA serial section processed for Nanostring GeoMx Digital Spatial profiling (DSP). The section was stained with pan-cytokeratin (PanCK, green), CD45 (red) and DNA stainSyto13 (blue). The regions of interest (ROIs) are represented by the white irregular polygons. Within the ROIs, the areas of interest (AOIs) were selected based on segmentation of pan-cytokeratin staining. Tumor AOIs (all epithelium which is segmented red and contained within an ROI) are pan-cytokeratin +. Tumor microenvironment (TME) AOIs (all TME segmented yellow) surrounding the segmented epithelium within the ROI) are pan-cytokeratin –. Each AOI is considered a sample. (B) (Left) A PDC region from a pan-cytokeratin stained TMA serial section. (Center) The same PDC region from an H&E stained TMA serial section. Automatically detected tumor cells/clusters are denoted by the colored overlays. (Right) The same PDC region from a TMA serial section processed for DSP. (C) (Left) A TB region from a pan-cytokeratin stained TMA serial section. (Center) The same TB region from an H&E stained serial section. Automatically detected tumor cells/clusters are denoted by the colored overlays. (Right) The same TB region from a TMA serial section processed for DSP. Colored overlays are not indicative of size. (Scale bar = 250 μm).
Fig. 3
Fig. 3
Quantification of all tumor cells/clusters along the invasive front in a large series of colorectal cancer (CRC) cases. (A) Pie chart depicting percentages of tumor cells/clusters of a particular size out of all tumor cells/clusters ≤ 10 cells automatically detected across the entire invasive margin of all 1134 pTNM stage I-III CRC cases. (B) Pie chart depicting percentages of tumor cells/clusters of a particular size out of all tumor cells/clusters ≤ 4 cells detected and considered tumor budding (TB). (C) Pie chart depicting percentages of tumor cells/clusters of a particular size out of all tumor clusters detected with a size between 5 and 10 cells and considered poorly differentiated clusters (PDCs). (D) Percentage overlap of TB and PDC hotspots in all cases as well as the hotspots of increasing cluster size cut-off through the tiered scoring. (E) Table depicting the statistics of tiered scoring with cut-offs of only single cells and inclusion of cell clusters of incrementally increasing size. The mean number of tumor cells/clusters within a hotspot of each grouping, the distribution (%) of cases between low and high-grade groups, and hazard ratios for each grouping are depicted.
Fig. 4
Fig. 4
Association of Tumor Budding (TB), Poorly Differentiated Clusters (PDCs), and their combined score with DFS for patients with Stage I-III colorectal cancer based on univariable analysis. (A) TB, (B) PDC, and (C) the combination of TB and PDC in overall cohort. HR, hazard ratio; CI, confidence interval.
Fig. 5
Fig. 5
Transcriptional profiles and Differentially Expressed Genes (DEG) between Tumor Budding (TB), Poorly Differentiated Clusters (PDC) and Pushing Border (PB) regions. DEGs between TB, PDC and PB regions using Nanostring GeoMx Digital Spatial Profiling (DSP). (A) Volcano plot demonstrating DEGs within the tumor area of 60 and 85 samples representing PB and PDC, respectively. X-axis represents -Log2 fold change and Y-axis represents -Log10 p value. (B) Volcano plot demonstrating DEGs within the tumor microenvironment (TME) of 60 and 85 samples representing PB and PDC, respectively. (C) Volcano plot demonstrating DEGs within the tumor area of 90 and 85 samples representing TB and PDC, respectively. (D) Volcano plot demonstrating DEGs within the TME of 90 and 85 samples representing TB and PDC, respectively. (E) Spatial deconvolution of immune cell populations within the TME of TB, PDC and PB regions, respectively. Statistical comparison done using a Wilcoxon test.
Fig. 6
Fig. 6
Validation of transcriptomic expression using Immunohistochemistry (IHC). On TMA serial sections, pan-cytokeratin (AE1/AE3) and Fibronectin 1 (FN1) staining was performed for all Tumor Budding (TB), Poorly Differentiated Clusters (PDC), and Pushing Border (PB) regions. (A) The same representative PB region stained with (upper) AE1/AE3 and (lower) FN1. (B) The same representative PDC region stained with (upper) AE1/AE3 and (lower) FN1. (C) The same representative TB region stained with (upper) AE1/AE3 and (lower) FN1. (D) Violin plot showing stromal FN1 expression scored across all TB (dark blue), PDC (light blue), and PB (pink) regions (p < 0.001, T-test). (E) Violin plot showing epithelial FN1 expression scored across all TB (dark blue), PDC (light blue), and PB (pink) regions (p < 0.001, T-test). (Scale bar = 100 μm; Inset = 25 μm).

References

    1. Jass, J. R., Love, S. B. & Northover, J. M. A. A new prognostic classification of rectal cancer. Lancet329, 1303–1306 (1987). - PubMed
    1. Karamitopoulou, E. et al. Tumour border configuration in colorectal cancer: proposal for an alternative scoring system based on the percentage of infiltrating margin. Histopathology67, 464–473 (2015). - PubMed
    1. Zlobec, I., Berger, M. D. & Lugli, A. Tumour budding and its clinical implications in Gastrointestinal cancers. Br. J. Cancer. 123, 700–708 (2020). - PMC - PubMed
    1. Lugli, A. et al. Recommendations for reporting tumor budding in colorectal cancer based on the international tumor budding consensus conference (ITBCC) 2016. Mod. Pathol.30, 1299–1311 (2017). - PubMed
    1. Lugli, A., Zlobec, I., Berger, M. D., Kirsch, R. & Nagtegaal, I. D. Tumour budding in solid cancers. Nat. Reviews Clin. Oncol.18, 101–115 (2020). - PubMed

Substances