. 2025 May 15;16(1):4535.
doi: 10.1038/s41467-025-59873-1.

A self-assembled protein β-helix as a self-contained biofunctional motif

Affiliations

A self-assembled protein β-helix as a self-contained biofunctional motif

Camilla Dondi et al. Nat Commun. .

Abstract

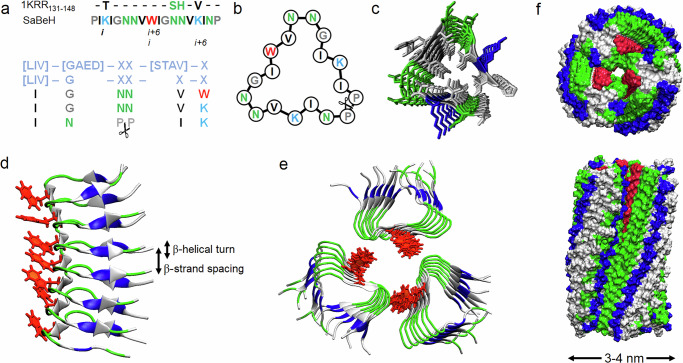
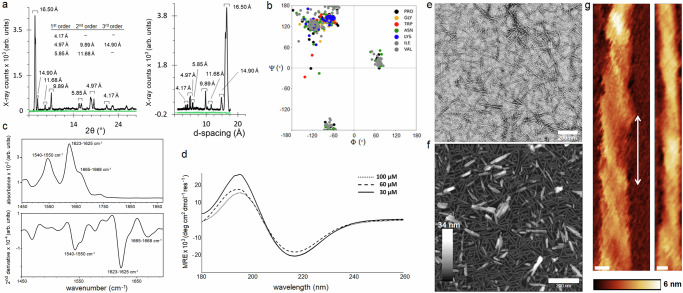
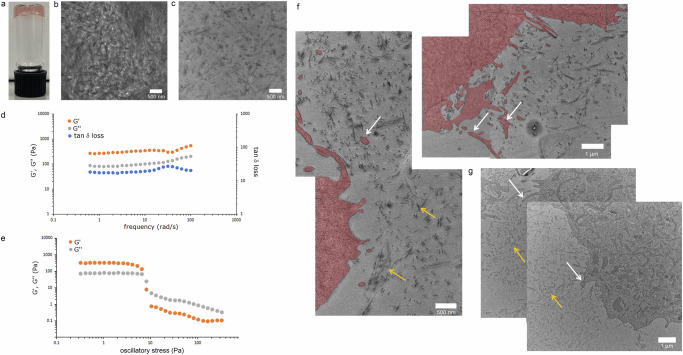
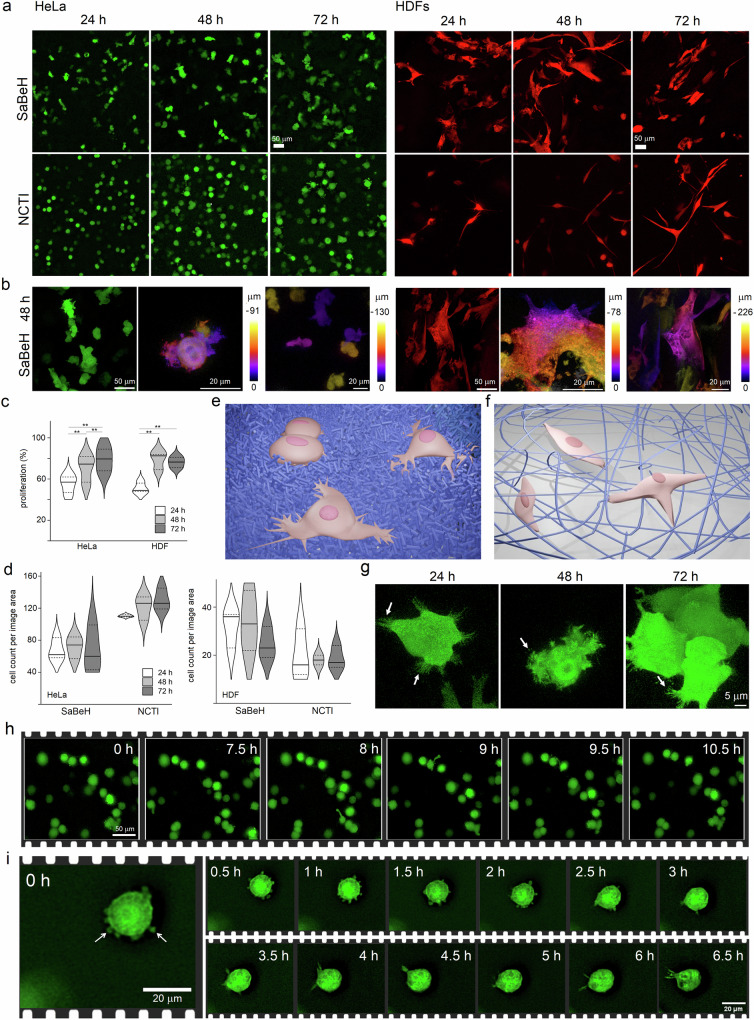
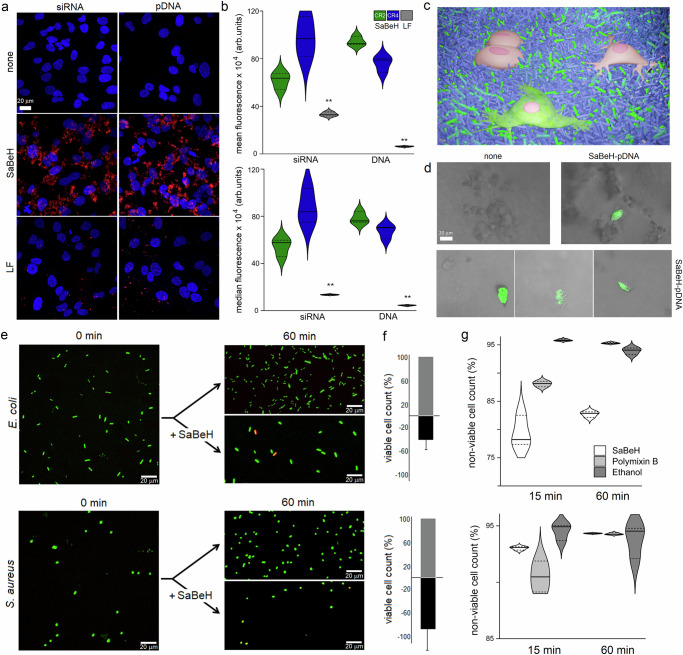
Nature constructs matter by employing protein folding motifs, many of which have been synthetically reconstituted to exploit function. A less understood motif whose structure-function relationships remain unexploited is formed by parallel β-strands arranged in a helical repetitive pattern, termed a β-helix. Herein we reconstitute a protein β-helix by design and endow it with biological function. Unlike β-helical proteins, which are contiguous covalent structures, this β-helix self-assembles from an elementary sequence of 18 amino acids. Using a combination of experimental and computational methods, we demonstrate that the resulting assemblies are discrete cylindrical structures exhibiting conserved dimensions at the nanoscale. We provide evidence for the structures to form a carpet-like three-dimensional scaffold promoting and inhibiting the growth of human and bacterial cells, respectively, while being able to mediate intracellular gene delivery. The study introduces a self-assembled β-helix as a self-contained bio- and multi-functional motif for exploring and exploiting mechanistic biology.


Conflict of interest statement

Competing interests: B.W.H. holds an executive position at an AFM manufacturer Nanosurf. Nanosurf played no role in the design and execution of this study. B.W.H. has no other competing interests. The authors declare no other competing interests.

Figures

Fig. 1
Fig. 1. β-helix design.
a Amino-acid sequence of SaBeH aligned with the sequence of 1KRR131-148 (upper), with hexapeptide repeats characteristic of β-helical domains (lower), and b as configured into a left-handed β-helical rung with each side representing a β-strand. Repeating residues in a hexapeptide repeat (i, i + 6) are highlighted for a lysine ladder. Colour coding: black and blue denote hydrophobic and cationic residues, proline and glycine are in grey, tryptophan is in red, asparagine is in green. c A top-down schematic of the assembly. For clarity only asparagine (green) and lysine (blue) are shown in colour. d Side view of MD simulation performed over 100 ns for a β-helix composed of seven β-helical turns and e top-down view of MD simulation performed over 100 ns for a β-helical trimer. Arginine and lysine residues and tryptophan side chains are shown in green, blue, and red, respectively. f Top-down (upper) and side (lower) views of MD simulation performed over 100 ns for a 12-turn β-helical trimer. Colour coding is as in (e).
Fig. 2
Fig. 2. β-helix folding and assembly.
a XRD patterns for SaBeH (black) and a non-assembly control peptide (green). X-ray counts are shown versus both 2θ (left) and d-spacings (right). b Ramachandran plot for SaBeH as in Fig. 1f. c FT-IR spectrum (upper) and its 2nd derivative (lower) for SaBeH. d CD spectra for SaBeH at different concentrations. e Electron and f atomic force micrographs of SaBeH. Scale bars are 200 nm. Colour (height) scale bar is 34 nm. g Atomic force micrographs of individual SaBeH cylinders highlighting a left-handed twist with a pitch of 28.5 ± 7.3 nm indicated by a double-headed arrow. Scale bars are 5 nm. Colour (height) scale bar is 6 nm. Assembly conditions: 100 μM (unless stated otherwise) in 10 mM 3-(Morpholin-4-yl)propane-1-sulfonic acid (MOPS), pH 7.4, at room temperature. Images in (eg) are representative of at least 3 independent experiments.
Fig. 3
Fig. 3. β-helix forms hydrogel scaffold.
a A photograph of a SaBeH hydrogel (1%, w/v) set in a 5 mL vial. b A representative electron micrograph of the hydrogel imaged as is. c A representative electron micrograph of the hydrogel microtomed at 50 μm thickness. d Storage (G´, orange) and loss (G′′, grey) moduli of the hydrogel (1%, w/v) and the tangent of the loss angle (tan δ loss, blue) measured in the 0.5–100 rad/s frequency range. e Oscillatory stress sweeps of the hydrogel (1%, w/v) showing linear viscoelastic region with a cross-over point (~ 10 Pa) between the moduli characteristic of a gel-sol transition. f Representative electron micrographs of HeLa cells and g representative electron micrographs of MDA-MB-231 cells, grown in the hydrogel over 24 h. White arrows point to cellular lamellipodia. Gold arrows point to individual and clustered SaBeH assemblies. Cell areas (f) are labelled red to help visualize microtomed lamellipodia. Images in (b, c, f, g) are representative of at least 3 independent experiments.
Fig. 4
Fig. 4. β-helix supports 3D cell culture.
a Low and b high magnification fluorescence micrographs of HeLa cells and HDFs, expressing green fluorescent protein (GFP, green) and TurboFP602 (red), respectively. The cells grown in SaBeH and NCTI gels were imaged at fixed time points. b Cells located at different depths from the plane of the image are labeled with false colours matching corresponding rainbow scales indicating depth profiles. c Cell proliferation determined by PrestoBlueTM assays at 24 h (white), 48 h (light grey), 72 h (dark grey) after subtracting background readouts (bare gels). Total number of metabolically viable cells grown in NCTI was taken as 100%. Data are presented as average percentages of metabolically viable cells with standard deviations for six independent biological replicates (n = 6): HeLa (24 h: 55 ± 8.9; 48 h: 70.5 ± 12.5; 72 h: 79.3 ± 12.3); HDF (24 h: 51 ± 5.3; 48 h: 79 ± 8.4; 72 h: 76.3 ± 5.2). Solid horizontal lines denote median, and upper and lower edges correspond to 75th and 25th percentiles, respectively. Statistical analyses were done using the analysis of variance (ANOVA) followed by Bonferroni and unpaired, two-sided t tests. Significant differences are represented with ** for p < 0.01. HeLa: p = 0.00026, p = 0.00003, p = 0.0069; and HDF: p = 0.00025, p = 1.86 × 10−5—significantly higher numbers of metabolically active cells were observed at 72 h than at 24 and 48 h, and significantly higher numbers at 48 h than at 24 h for HeLa cells; and at 72 and 48 h than at 24 h for HDFs. d Cell count of metabolically active cells per image area determined at 24 h (white), 48 h (light grey), 72 h (dark grey) by automated segmentation using StarDist (https://github.com/stardist/stardist). Data are presented as average cell counts per image area with standard deviations for three independent biological replicates (n = 3): HDF/SaBeH (24 h: 32 ± 7.8; 48 h: 34 ± 12.5; 72 h: 24.6 ± 6.6); HDF/NCTI (24 h: 19.6 ± 10; 48 h: 18 ± 2.8; 72 h: 18.6 ± 4.7); HeLa/SaBeH (24 h: 67.6 ± 13.4; 48 h: 71.6 ± 13.6; 72 h: 67.3 ± 28.7); HeLa/NCTI (24 h: 110.3 ± 1.5; 48 h: 121.6 ± 15; 72 h: 130 ± 13.4). Solid horizontal lines denote median, and upper and lower edges correspond to 75th and 25th percentiles, respectively. e Schematic representation of multipolar cell morphologies with shorter projections (pink) on the SaBeH carpet-like scaffold (blue). f Schematic representation of cells (pink) exhibiting limited polarity on long-range networks of collagen fibres (blue). e, f Schematics were created using Blender, a free and open-source 3D creation suite. Blender is distributed under the GNU General Public License (GPL), which grants users the freedom to use, modify, and distribute the software for any purpose, including commercially and for education. Scaffolds and cells are shown in blue and pink, respectively. g High-mag fluorescence micrographs of HeLa cells (green) grown in SaBeH gels taken at fixed time points. White arrows indicate filopodia. h Time-lapse micrographs of HeLa cells (green) grown in SaBeH gels over the first 10 h. i Time-lapse micrographs of a representative HeLa cell (green) in SaBeH gels showing continuous re-arrangements of filopodia (white arrows) over first several hours culminating in a bleb formation (6.5 h). Images in (g, h, i) are representative of at least 3 independent biological replicates. Source data are provided as a Source Data file.
Fig. 5
Fig. 5. β-helix promotes intracellular gene delivery and inhibits bacterial growth.
a Fluorescence micrographs of HeLa cells transfected with siRNA and pDNA (200 ng) labelled with Alexa 647 and Cy5 (red), respectively, using SaBeH (CR4 for siRNA and CR2 for pDNA). Lipofectamine (LF) is used for comparison. Hoechst 33342 (blue) was used to stain nuclei. b Cell uptake for siRNA (blue) and pDNA (orange) determined by flow cytometry at 3 h post-transfection with SaBeH at CR2 (green) and CR4 (blue) and LF (grey). Data are presented as the (upper) and median (lower) fluorescence with standard deviations for three independent biological replicates (n = 3): siRNA/mean × 104 (CR2: 61.7 ± 6.8; CR4: 97.9 ± 16.9; LF: 33.3 ± 1.7); DNA/mean × 104 (CR2: 94.4 ± 3.9; CR4: 75.8 ± 6.3; LF: 6.1 ± 0.4); siRNA/median × 104 (CR2: 54.4 ± 7.4; CR4: 87.4 ± 14.5; LF: 13.5 ± 0.3); DNA/median × 104 (CR2: 78.2 ± 4.8; CR4: 67.2 ± 5.6; LF: 4.4 ± 0.3). Solid horizontal lines denote median, and upper and lower edges correspond to 75th and 25th percentiles, respectively. According to one-sided ANOVA tests, the counts of transfected HeLa cells for siRNA and pDNA when complexed with LF were significantly lower than those complexed with SaBeH. Statistically significant differences are represented with ** for p < 0.01: mean fluorescence siRNA (p = 0.0009), mean fluorescence DNA (p = 6.37 × 10−7), median fluorescence siRNA (p = 0.00023), median fluorescence DNA (p = 1.5 × 106). c Schematic of 3D SaBeH scaffold (blue cylinders) and when complexed with pDNA (green cylinders) showing cells without (pink) and with (green) iLOV expression. The Schematic was created using Blender, a free and open-source 3D creation suite. Blender is distributed under the GNU General Public License (GPL), which grants users the freedom to use, modify, and distribute the software for any purpose, including commercially and for education. d Fluorescence micrographs of HeLa cells grown in SaBeH gels without (none) and with the unlabelled, iLOV-encoding pDNA (SaBeH-pDNA). The micrographs highlight cells with significant iLOV fluorescence (green) and are representative of at least 3 independent biological replicates. e Fluorescence micrographs of Escherichia coli and Staphylococcus aureus cells grown over 60 min without (none) and with SaBeH at 100 μM. f Viable cell counts without (grey) and with (black) treatment with SaBeH (100 μM) over 60 min given in percentage. Negative values denote total counts of dead bacterial cells obtained by subtracting counts of viable bacteria grown without SaBeH (100%) from counts of viable bacteria grown with SaBeH. Data are presented as the percentage of the total counts of dead bacteria with standard deviations for three independent biological replicates (n = 3): SaBeH treated E. coli (−40 ± 19) and S. aureus (−87 ± 43). g Quantification of non-viable E. coli and S. aureus cells treated over 15 and 60 min with SaBeH (white), polymyxin B (light grey) and 70% aq. (v/v) ethanol (dark grey) after subtracting corresponding counts obtained for untreated cells, measured using flow cytometry. Data are presented as the percentages of non-viable bacteria cells in the total number of the cells with standard deviations for three independent biological replicates (n = 3): SaBeH treated E. coli (15 min: 79.3 ± 2.7; 60 min: 82.7 ± 0.5) and S. aureus (15 min: 93 ± 0.15; 60 min: 94.3 ± 0.03); polymyxin B treated E. coli (15 min: 88 ± 0.49; 60 min: 95.3 ± 0.12) and S. aureus (15 min: 90.5 ± 1.3; 60 min: 94.2 ± 0.07); 70% aq. (v/v) ethanol treated E. coli (15 min: 95.8 ± 0.16; 60 min: 93.9 ± 0.6) and S. aureus (15 min: 94.5 ± 0.74; 60 min: 93.8 ± 1.4). Solid horizontal lines denote median, and upper and lower edges correspond to 75th and 25th percentiles, respectively. Source data are provided as a Source Data file.

Similar articles

References

    1. Paladin, L. et al. RepeatsDB in 2021: improved data and extended classification for protein tandem repeat structures. Nucleic Acids Res.49, D452–D457 (2021). - PMC - PubMed
    1. Wicky, B. I. M. et al. Hallucinating symmetric protein assemblies. Science378, 56–61 (2022). - PMC - PubMed
    1. De Santis, E. & Ryadnov, M. G. Peptide self-assembly for nanomaterials: the old new kid on the block. Chem. Soc. Rev.44, 8288–8300 (2015). - PubMed
    1. Yeates, T. O. Geometric principles for designing highly symmetric self-assembling protein nanomaterials. Annu. Rev. Biophys.46, 23–42 (2017). - PubMed
    1. Jumper, J. et al. Highly accurate protein structure prediction with AlphaFold. Nature596, 583–589 (2021). - PMC - PubMed

LinkOut - more resources