. 2025 May 15;16(1):4545.
doi: 10.1038/s41467-025-59811-1.

Spatial mapping of innate lymphoid cells in human lymphoid tissues and lymphoma at single-cell resolution

Affiliations

Spatial mapping of innate lymphoid cells in human lymphoid tissues and lymphoma at single-cell resolution

Nathalie Van Acker et al. Nat Commun. .

Abstract

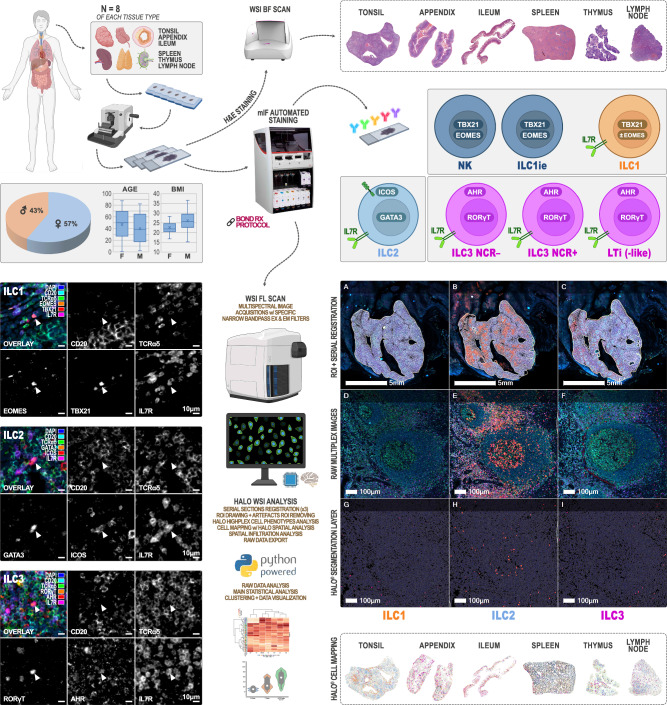
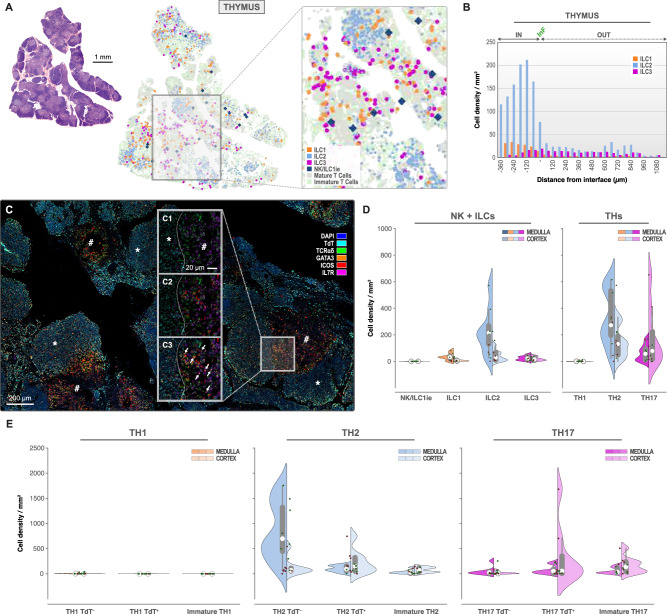
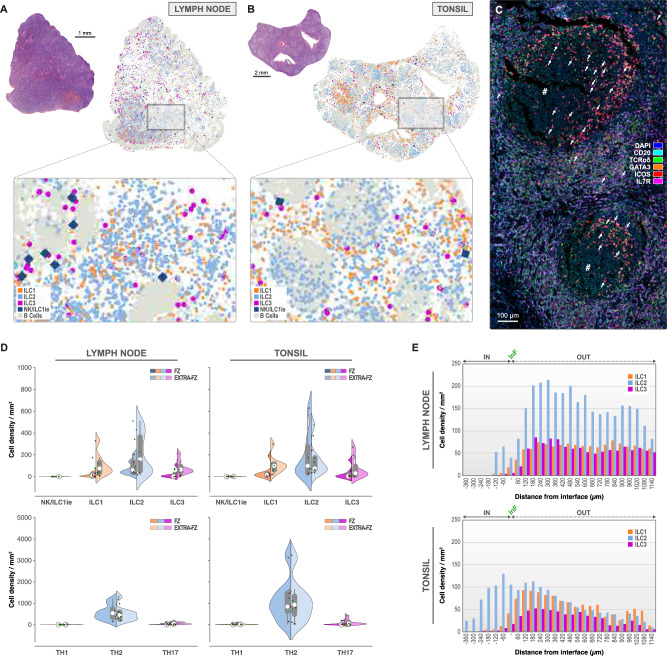
Innate lymphoid cells (ILC) distribution and compartmentalization in human lymphoid tissues are incompletely described. Through combined multiplex immunofluorescence, multispectral imaging, and advanced computer vision methods, we provide a map of ILCs at the whole-slide single-cell resolution level, and study their proximity to T helper (Th) cells. The results show that ILC2 predominates in thymic medulla; by contrast, immature Th cells prevail in the cortex. Unexpectedly, we find that Th2-like and Th17-like phenotypes appear before complete T cell receptor gene rearrangements in these immature thymocytes. In the periphery, ILC2 are more abundant in lymph nodes and tonsils, penetrating lymphoid follicles. NK cells are uncommon in lymphoid tissues but abundant in the spleen, whereas ILC1 and ILC3 predominate in the ileum and appendix. Under pathogenic conditions, a deep perturbation of both ILC and Th populations is seen in follicular lymphoma compared with non-neoplastic conditions. Lastly, all ILCs are preferentially in close proximity to their Th counterparts. In summary, our histopathology tool help present a spatial mapping of human ILCs and Th cells, in normal and neoplastic lymphoid tissues.


Conflict of interest statement

Competing interests: The authors declare no competing interests.

Figures

Fig. 1
Fig. 1. Wet and dry lab work up for high-resolution computational mapping of Innate Lymphoid Cells (ILCs) in human primary and secondary lymphoid organs.
After tissue selection (n = 8 independent biological samples per lymphoid tissue type), 4 to 6 serial FFPE slides were cut at 4 µm. The first slide was stained with H&E for morphological quality control. mIF was performed for the 3 panels (NK/ILC1ie + ILC1, ILC2, and ILC3) in parallel for each tissue sample (7 batches, 1 staining cycle of 3 mIF per lymphoid tissue type) on the BOND RX automated staining platform (Leica Biosystems). 6-channels multispectral fluorescence imaging was performed using a Zeiss AxioScan Z1 whole-slide scanner. Object-oriented whole-slide image analysis was carried out using the Halo framework (Indica Labs). Each image was manually annotated by a certified pathologist with three regions of interest (ROI: “interface”, “extra-interface”, and “interface + extra-interface”). In tonsil, appendix, ileum, lymph node, and follicular lymphoma images, the “interface” and “extra-interface” ROIs matched respectively the follicular and extra-follicular zones, the white and red pulp in the spleen, and the medulla and cortex in thymus. Morphometric features and OPAL dye-intensities were quantified, and each object was tagged and classified for a specific phenotype based on its marker content. Spatial analysis and mapping was based on their X-Y location coordinates. Raw data were exported from the Halo database as.csv text files to be analyzed and visualized using Panda, Matplotlib, and Seaborn (Python packages). Partially created in BioRender. Bezombes, C. (2025) https://BioRender.com/shbs5qf.
Fig. 2
Fig. 2. Cluster analysis reveals distinct ILC and T helper subset partnership.
An important IL-7Rαpool resides within lymphoid organs and ILC2 are the main ILC-subtype penetrating lymphoid follicles (FZ). A A Standardized cell densities clustermap of ILCs and T helper cells in relation to patient characteristics (gender and age range) and tissue types (tonsil, appendix, ileum, lymph node, spleen, and thymus) (n = 8 independent biological samples per lymphoid tissue type). Four clusters as determined using the elbow method and the K-means algorithm: Blue, Green, Beige, Deep red. B B, T, IL-7Rαpool, and ILCs quantification in lymphoid organs. Split-violin plots representing B, T and IL-7Rαpool cell densities (number/mm2) inside (left) and outside (right) of the follicular zone of lymph node, tonsil, appendix and ileum, in the white (left) and red (right) pulp of spleen, and in the medulla (left) and cortex (right) of thymus (n = 8 independent biological samples per lymphoid tissue type). C Split-violin plots representing the percentage of ILC phenotypes (per IL-7Rαpool) inside (left) and outside (right) of the follicular zone of lymph node, tonsil, appendix and ileum, in the white (left) and red (right) pulp of spleen, and in the medulla (left) and cortex (right) of thymus. D–G Classic mIF of tonsil for CD20 (aqua), TCRαδ (green), and IL-7Rα (red). Interface between follicular and extra-follicular zones: dashed line. Scale bar: 100 µm. Exemple of ILC1 (CD20 TCRαδ IL-7Rα+ TBX21+ EOMES±) (H), ILC2 (CD20 TCRαδ IL-7Rα+ GATA-3+ ICOS+) (I), and ILC3 (CD20 TCRαδ IL-7Rα+ RORγT+ AHR+) (J) identified cells. Scale bar: 10 µm. Box-plots within Violin Plots, created using Seaborn in Python, present the median value (white dot, 50th percentile) in between the first quartile (the middle value between “minimum non-outlier” and median (marked as Q1, portrays the 25th percentile) and third quartile (the middle value between “maximum non-outlier” and median (marked as Q3, portrays the 75th percentile)). Source data is provided as a Source Data file.
Fig. 3
Fig. 3. Flow cytometric ILCs identification and quantification in human tonsils (n = 5 independent biological samples performed in a single batch).
A Example of the gating strategy used for identification of ILCs in tonsil, with ILCs defined as lineage negative (Lin) (CD141 CD14 CD11c CD20 FcεRIα CD3 CD34 CD123 CD1a) and CD45+ CD127(IL-7Rα)+ CD56. Following viability assessment, unwanted lineage markers were excluded, and ILCs pool population was defined through the expression of IL-7Rα and the absence of expression of CD56 NK cell marker. B ILCs identification according to Crinier A. et al., Yudanin et al., Bjorklünd et al. based on the relative co-expression of CD117 and CD294 (CRTH2) markers. ILC1 were defined as CD117 CRTH2, ILC2 were defined as CD117± CRTH2+, ILC3 were defined as CD117+ CRTH2. Co-expression of T-Bet/EOMES, GATA3/ICOS, and AHR/RORγT assessment in each determined ILCs subset. C ILCs identification according to mIF gating strategy. ILCs pool was defined as LIN CD45+ CD3 CD56 CD127+ and the populations were defined as T-Bet+ EOMES± for ILC1, GATA3+ ICOS+ for ILC2 and RORγT+ AHR+ for ILC3. Violin plot represents the quantification of ILC1, ILC2, and ILC3 subsets according to the mIF gating strategy in tonsil. T-Bet and EOMES expression (“ILC1 profile”) were assessed in NK cells populations either positive or negative for IL-7Rα expression. D FC and mIF quantification obtained values (% relative to IL-7Rα+ population) were compared through normalized means of cell percentages observed. Source data are provided as a Source Data file.
Fig. 4
Fig. 4. ILC2 and Th2 predominate thymic medulla, whereas Th17 is predominant in thymic cortex.
Topographic distribution of NK/ILC1ie (dark blue), ILC1 (orange), ILC2 (light blue) and ILC3 (pink) in thymus (n = 8 independent biological samples, 1 mIF staining batch). A H&E overview of thymus with corresponding ILC distribution map (detailed in caption). Scale bar: 1 mm. B Infiltration analysis plot with interface (InF) between medulla (IN) and cortex (OUT) for IL-7Rα+ ILC1 (orange), ILC2 (light blue) and ILC3 (pink) in thymus. C mIF staining of TdT (aqua), TCRαδ (green), GATA-3 (orange), ICOS (red) and IL-7Rα (pink). DAPI nuclear counterstain (DAPI, blue). Scale bar: 200 µm. C1–3. Detailed image of mIF in “C”, at medulla/cortex interface (dashed line) presenting TdT (aqua), TCRαδ (green) and IL-7Rα (pink) in “C1”, with additional ICOS (red) in “C2” and GATA-3 (orange) in “C3”. ILC2 indicated by white arrows in “C3”. Scale bar: 20 µm. D Split-violin plots representing the ILC and T helper phenotype densities (number/mm2) in medulla (left) and cortex (right) of thymus (alternative “TdT” mIF panel). E Split-violin plots representing the T-helper phenotype densities (number/mm2) in medulla (left) and cortex (right) of thymus. Box-plots within Violin Plots, created using Seaborn in Python, present the median value (white dot, 50th percentile) in between the first quartile (the middle value between “minimum non-outlier” and median (marked as Q1, portrays the 25th percentile) and third quartile (the middle value between “maximum non-outlier” and median (marked as Q3, portrays the 75th percentile)). Source data are provided as a Source Data file.
Fig. 5
Fig. 5. NK/ILC1ie and ILC1 dominate red pulp of spleen, accompagnied by Th1. Th17 is the dominant population in white pulp.
Topographic distribution of NK/ILC1ie (dark blue), ILC1 (orange), ILC2 (light blue), and ILC3 (pink) in spleen (n = 8 independent biological samples, 1 mIF staining batch). A H&E overview of the spleen with corresponding ILCs distribution map (detailed in caption). Scale bar: 2 mm. B Classic mIF staining of CD20 (aqua), TCRαδ (green), EOMES (orange), TBX21 (red) and IL-7Rα (pink). DAPI nuclear counterstain (DAPI, blue). Scale bar: 250 µm. B1–3. Detailed image of mIF in “B”, at white pulp (hashtag)/red pulp interface (dashed line) presenting CD20 (aqua), TCRαδ (green) and IL-7Rα (pink) in “B1”, with additional TBX21 (red) in “B2” and EOMES (orange) in “B3”. ILC1 (TBX21+/EOMES) indicated by white arrows and ILC1 (TBX21+/EOMES+) indicated by white triangles. Scale bar: 20 µm. C Split-violin plots representing the ILC and T helper phenotype densities (number/mm2) in white (left) and red pulp (right) of the spleen (classic mIF panel). D Infiltration analysis plot with interface (InF) between white (IN) and red pulp (OUT) for IL-7Rα+ ILC1 (orange), ILC2 (light blue), and ILC3 (pink) in spleen. E Spatial Transcriptomics (GEO Accession N° GSE228056) with mapping of ILCs and NK signatures in reactive spleen. Box-plots within Violin Plots, created using Seaborn in Python, present the median value (white dot, 50th percentile) in between the first quartile (the middle value between “minimum non-outlier” and median (marked as Q1, portrays the 25th percentile) and third quartile (the middle value between “maximum non-outlier” and median (marked as Q3, portrays the 75th percentile)). Source data are provided as a Source Data file.
Fig. 6
Fig. 6. ILC1 and ILC3 are the dominant ILC-populations in intestinal mucosal tissue, where they are colocalizing with Th2.
Topographic distribution of NK/ILC1ie (dark blue), ILC1 (orange), ILC2 (light blue), and ILC3 (pink) in appendix (A) and ileum (B, C) (n = 8 independent biological samples for each tissue type, 1 mIF staining batch per tissue type). A H&E overview of appendix with corresponding ILC distribution map (detailed in caption). B cells (light grey) are used to highlight the follicular areas. Scale bar: 2 mm. B H&E overview of ileum with corresponding ILC distribution map (detailed in caption). B cells (light grey) are used to highlight the follicular areas. Scale bar: 2 mm. C Classic mIF staining for CD20 (aqua), TCRαδ (green), EOMES (orange), TBX21 (red), and IL-7Rα (pink) in ileum. DAPI nuclear counterstain (blue). Dashed line and hashtag indicating the follicular zone. ILC1s indicated by white arrows. Scale bar: 200 µm. D Split-violin plots representing the ILC phenotype densities (number/mm2) in the follicular (left) and extra-follicular (right) zones of the appendix and ileum (classic mIF using CD20). E Infiltration analysis plot with interface (InF) between extra-follicular zone (OUT) and follicular zone (IN) for IL-7Rα+ ILC1 (orange), ILC2 (light blue) and ILC3 (pink) in appendix (upper) and ileum (lower). Box-plots within Violin Plots, created using Seaborn in Python, present the median value (white dot, 50th percentile) in between the first quartile (the middle value between “minimum non-outlier” and median (marked as Q1, portrays the 25th percentile) and third quartile (the middle value between “maximum non-outlier” and median (marked as Q3, portrays the 75th percentile)). Source data are provided as a Source Data file.
Fig. 7
Fig. 7. ILC2 and Th2 dominate the lymph node and tonsil.
Topographic distribution of NK/ILC1ie (dark blue), ILC1 (orange), ILC2 (light blue) and ILC3 (pink) in lymph node (A) and tonsil (B, C) (n = 8 independent biological samples for each tissue type, 1 mIF staining batch per tissue type). A H&E overview of lymph node with corresponding ILC distribution map (detailed in the caption). B cells (light grey) are used to highlight the follicular areas. Scale bar: 1 mm. B H&E overview of tonsil with corresponding ILC distribution map (detailed in caption). B cells (light grey) are used to highlight the follicular areas. Scale bar: 2 mm. C Classic mIF staining for CD20 (aqua), TCRαδ (green), GATA-3 (orange), ICOS (red), and IL-7Rα (pink) in tonsil. DAPI nuclear counterstain (blue). Hashtag indicating the germinal center. ILC2 indicated by white arrows. Scale bar: 100 µm. D Split-violin plots representing the ILC phenotype densities (number/mm2) in the follicular (left) and extra-follicular (right) zones of the lymph node and tonsil (classic mIF using CD20). E Infiltration analysis plot with interface (InF) between extra-follicular zone (OUT) and follicular zone (IN) for IL-7Rα+ ILC1 (orange), ILC2 (light blue), and ILC3 (pink) in lymph node (upper) and tonsil (lower). Box-plots within Violin Plots, created using Seaborn in Python, present the median value (white dot, 50th percentile) in between the first quartile (the middle value between “minimum non-outlier” and median (marked as Q1, portrays the 25th percentile) and third quartile (the middle value between “maximum non-outlier” and median (marked as Q3, portrays the 75th percentile)). Source data is provided as a Source Data file.
Fig. 8
Fig. 8. Loss of IL-7Rαpool and ILC subtypes, and altered T helper cell subsets in follicular lymphoma.
Topographic distribution of NK/ILC1ie (dark blue), ILC1 (orange), ILC2 (light blue), and ILC3 (pink) in follicular lymphoma (FL) (n = 8 independent biological samples, 1 mIF staining batch). A H&E overview of FL with corresponding ILC distribution map (detailed in caption). B cells (light grey) are used to highlight the follicular areas. Scale bar: 2 mm. B Infiltration analysis plot with interface (InF) between extra-follicular regions (OUT) and follicular regions (IN) for IL-7Rα+ ILC1 (orange), ILC2 (light blue) and ILC3 (pink) in FL. C Classic mIF staining for CD20 (aqua), TCRαδ (green), EOMES (orange), TBX21 (red), and IL-7Rα (pink) showing ILC1s (white arrows) in follicular regions (dashed line and hashtag) and outside the follicles. DAPI nuclear counterstain (blue). Hashtag indicating the follicles. Scale bar: 100 µm. D Same as “C” but for classic mIF staining using GATA-3 (orange) and ICOS (red) (instead of EOMES and TBX21) and showing the spatial distribution of ILC2 around the follicle interface (dashed line). Scale bar: 100 µm. E Split-violin plots (left panel) representing the ILC and T helper densities (number/mm2) in the follicular (left) and extra-follicular (right) zones of the FL. Bubble plots (right panel) comparing the overall relative cell densities (bubble size) and the spatial distribution of each ILCs with their T helper counterparts around the follicular interfaces in the lymph node, tonsil, and FL. X-axis: mean cell density % inside the interface (log10 scale). Y-axis: mean cell density % outside the interface. LN: Lymph Node (yellow). TS Tonsil (green). FL Follicular Lymphoma (orange). Box-plots within Violin Plots, created using Seaborn in Python, present the median value (white dot, 50th percentile) in between the first quartile (the middle value between “minimum non-outlier” and median (marked as Q1, portrays the 25th percentile) and third quartile (the middle value between “maximum non-outlier” and median (marked as Q3, portrays the 75th percentile)). Source data are provided as a Source Data file.
Fig. 9
Fig. 9. Proximity analysis of Th cells within 50 µm of each ILC subtype in thymus (A, C) and spleen (B, D) (n = 8 independent biological samples for each tissue type, 1 mIF staining batch per tissue type).
Heatmaps show the percentage of Th1, Th2 or Th17 (red gradient) according to the ILC1, ILC2 or ILC3 distance (blue gradient, 5 µm steps) in thymus (A) and spleen (B, left panel). Bars show the percentage of Th cells within 50 µm of a single ILC1, ILC2 or ILC3 in the thymus (A) and spleen (B, left panel). In the spleen, where NK/ILC1ie cells were abundant, proximity analysis was also computed for NK/ILC1ie cells versus the three ILC and Th subtypes (B, right panel). C, D Schematic overview of the proximity analysis data. Each circular diagram represents the proximity of each “small” cell (Th cells for thymus and spleen, and ILCs for spleen only) within a 50 µm radius (2 × 25 µm concentric) of the center of the target cell nucleus drawn in the middle (ILC1, ILC2, and ILC3 for thymus and ILC1, ILC3 and NK/ILC1ie for spleen). The mean number and location of each “small” cell are shown schematically within the 2 × 25 µm radius proximity of the target cells (ILC1, ILC2, and ILC3 for thymus and ILC1, ILC3 and NK/ILC1ie for spleen). The small mirrored pie charts represent the percentages of each “small” cell population (Th cells for thymus and spleen, and ILCs for spleen only) within (when located inside the circular diagram, dark grey pie part) or over (when located outside the circular diagram, dark grey pie part) the 50 µm radius of the target cells (ILC1, ILC2, and ILC3 for thymus and ILC1, ILC3 and NK/ILC1ie for spleen). Caption in “C”. Detail of IndicaLabs Halo distribution map with proximity analysis visualization output in thymus. Source data is provided as a Source Data file. Partially created in BioRender. Bezombes, C. (2025) https://BioRender.com/shbs5qf.
Fig. 10
Fig. 10. Proximity analysis of Th cells within 50 µm of each ILC subtype in appendix, ileum, lymph node, tonsil, and follicular lymphoma (n = 8 independent biological samples for each tissue type, 1 mIF staining batch per tissue type).
Schematic overview of the proximity analysis data for appendix, ileum, lymph node, tonsil, and follicular lymphoma. Each circular diagram represents the proximity of each “small” cell (Th2 cells in A, Th1 and Th17 cells in B) within a 50 µm radius (2 × 25 µm concentric) of the center of the target cell nucleus, drawn in the middle (ILC1, ILC2, and ILC3). The mean number and location of each “small” cell are shown schematically within the 2 × 25 µm radius proximity of the target cells (ILC1, ILC2, and ILC3). The small pie charts represent the percentages of each “small” cell population (Th cells) within (dark grey pie part) and over (light grey pie part) the 50 µm radius of the target cells (ILC1, ILC2, and ILC3). Only one circular diagram is shown in (B) because the number and location pattern of Th1 and Th17 cells is the same for all the tissue types analyzed, whereas each diagram for each ILC subtype is divided by 5 (for appendix, ileum, lymph node, tonsil and follicular lymphoma) in (A) to display per quadrant the proximity analysis data overview that are different for each tissue type. C Heatmaps show the percentage of Th1, Th2 or Th17 (red gradient) according to the ILC1, ILC2, or ILC3 distance (blue gradient; 5 µm steps) in tonsil, lymph node, and follicular lymphoma, appendix and ileum. Bars show the percentage of Th cells within 50 µm of an ILC1, ILC2, or ILC3 in tonsil, lymph node, follicular lymphoma, appendix, and ileum. Source data are provided as a Source Data file. Partially created in BioRender. Bezombes, C. (2025) https://BioRender.com/shbs5qf.

Similar articles

References

    1. Artis, D. & Spits, H. The biology of innate lymphoid cells. Nature517, 293–301 (2015). - PubMed
    1. Klose, C. S. N. & Artis, D. Innate lymphoid cells control signaling circuits to regulate tissue-specific immunity. Cell Res.30, 475–491 (2020). - PMC - PubMed
    1. Bal, S. M., Golebski, K. & Spits, H. Plasticity of innate lymphoid cell subsets. Nat. Rev. Immunol.20, 552–565 (2020). - PubMed
    1. Spits, H. & Di Santo, J. P. The expanding family of innate lymphoid cells: regulators and effectors of immunity and tissue remodeling. Nat. Immunol.12, 21–27 (2011). - PubMed
    1. Lopes, N. et al. Tissue-specific transcriptional profiles and heterogeneity of natural killer cells and group 1 innate lymphoid cells. Cell Rep. Med.3, 100812 (2022). - PMC - PubMed

MeSH terms

LinkOut - more resources