. 2025 Jun;26(6):894-907.
doi: 10.1038/s41590-025-02151-5. Epub 2025 May 15.

GFI1-driven transcriptional and epigenetic programs maintain CD8+ T cell stemness and persistence

Affiliations

GFI1-driven transcriptional and epigenetic programs maintain CD8+ T cell stemness and persistence

M Zeeshan Chaudhry et al. Nat Immunol. 2025 Jun.

Abstract

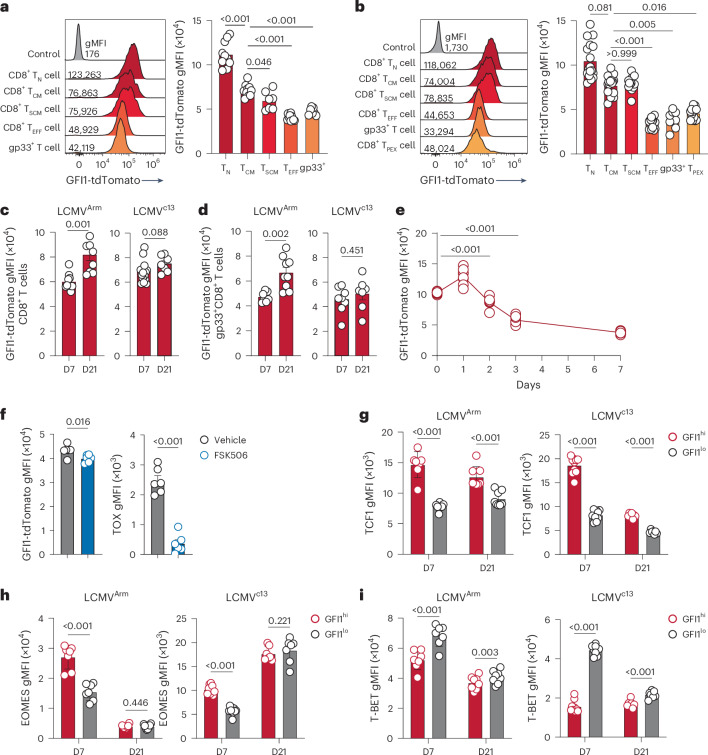
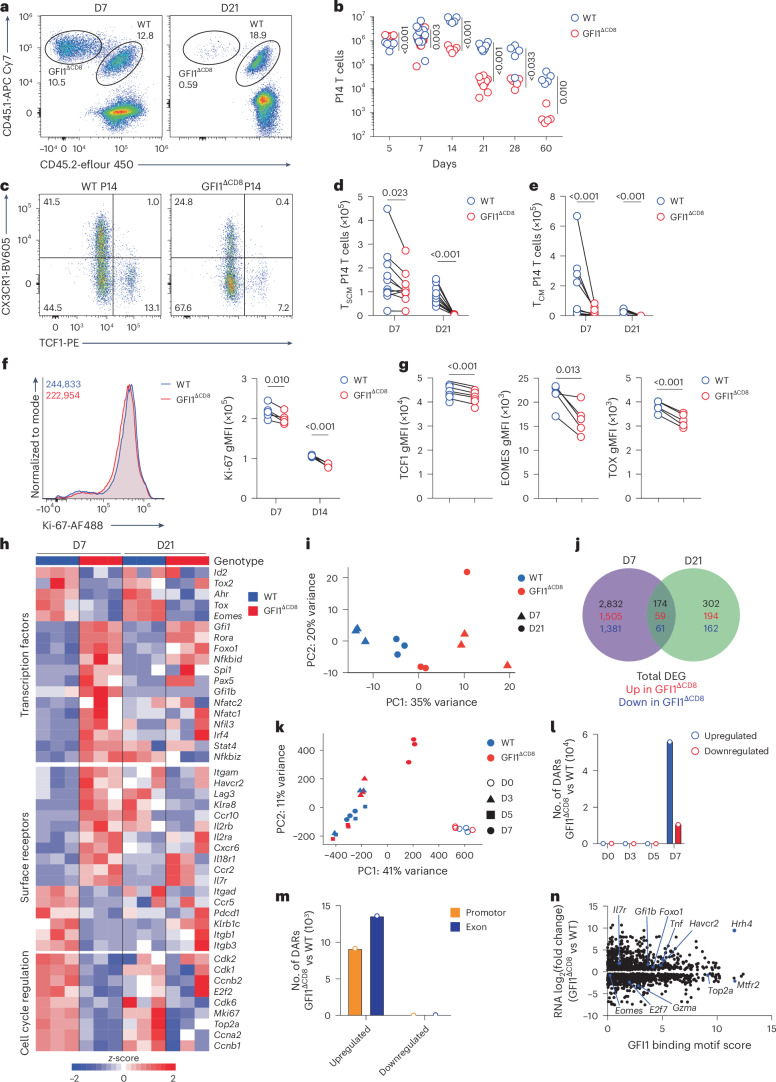
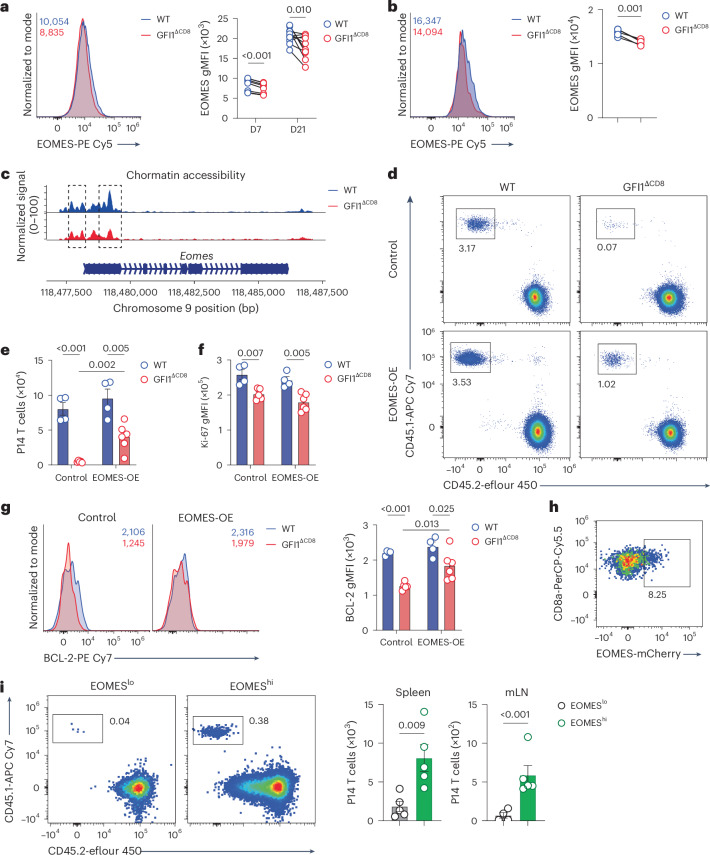
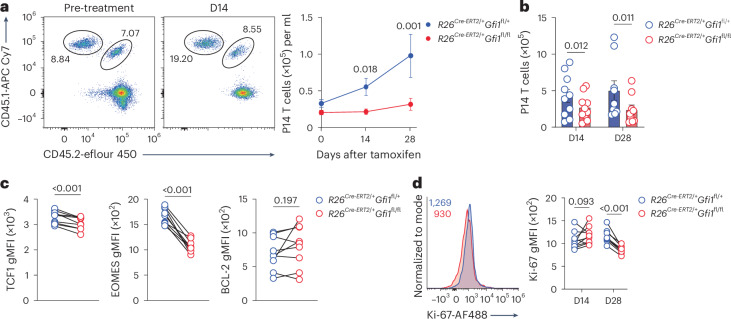
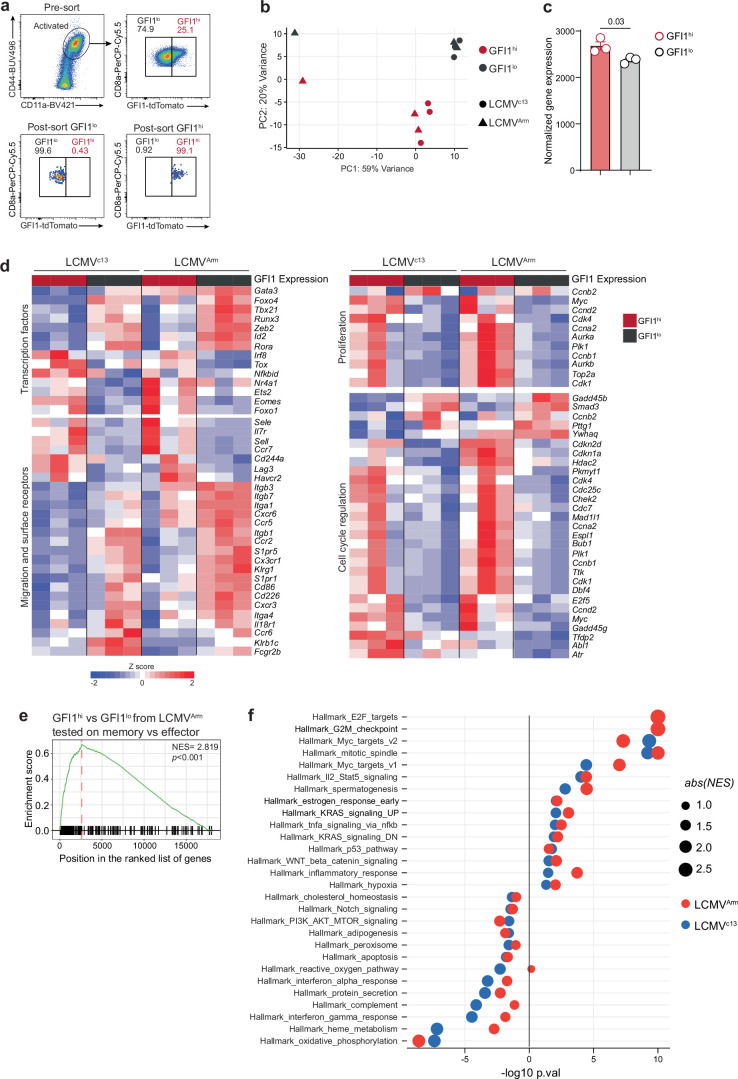
Long-lived memory CD8+ T cells are essential for the control of persistent viral infections. The mechanisms that preserve memory cells are poorly understood. Fate mapping of the transcriptional repressor GFI1 identified that GFI1 was differentially regulated in virus-specific CD8+ T cells and was selectively expressed in stem cell memory and central memory cells. Deletion of GFI1 led to reduced proliferation and progressive loss of memory T cells, which in turn resulted in failure to maintain antigen-specific CD8+ T cell populations following infection with chronic lymphocytic choriomeningitis virus or murine cytomegalovirus. Ablation of GFI1 resulted in downregulation of the transcription factors EOMES and BCL-2 in memory CD8+ T cells. Ectopic expression of EOMES rescued the expression of BCL-2, but the persistence of memory CD8+ T cells was only partially rescued. These findings highlight the critical role of GFI1 in the long-term maintenance of memory CD8+ T cells in persistent infections by sustaining their proliferative potential.


Conflict of interest statement

Competing interests: The authors declare no competing interests.

Figures

Fig. 1
Fig. 1. GFI1 is differentially expressed in CD8+ T cell effector subsets during chronic infection.
a, Representative histogram (left) and quantification (right) of GFI1-tdTomato expression in splenic CD11aCD44CD8+ TN cells from C57BL/6 mice (control) and CD8+ TN, CD11a+CD44+CD62L+CD27+CD8+ TCM cells, CD11a+CD44+TCF1+CX3CR1CD8+ TSCM cells, TCF1-CX3CR1+CD8+ TEFF cells and gp33+CD8+ T cells from the spleen of Gfi1tdTomato/+ mice at day 7 (D7) post infection with LCMVArm. Data are pooled from two experiments (n = 7 mice). gMFI, geometric mean fluorescence intensity. b, Representative histogram (left) and quantification (right) of GFI1-tdTomato expression in splenic CD8+ TN cells from C57BL/6 mice (control) and CD8+ TN, CD8+ TCM, CD8+ TSCM, CD8+ TEFF, CD8+gp33+ and TCF1+TOX+CD8+ TPEX cells from the spleen of LCMVc13-infected Gfi1tdTomato/+ mice at D7. Pooled from four experiments (n = 13 mice). c,d, GFI1-tdTomato in total CD8+ T cells (c) and gp33+CD8+ T cells (d) from the spleen of LCMVArm and LCMVc13-infected Gfi1tdTomato/+ mice at D7 and D21. Pooled from two experiments (n = 8 or 17 mice per time point). e,f, Expression of GFI1-tdTomato in splenic CD8+ P14 T cells at D0–D7 post LCMVc13 infection (n = 8 mice per time point) (e) and GFI1-tdTomato and TOX in splenic CD8+ P14 T cells at D7 post LCMVc13 infection (f) in C57BL/6 mice transferred with congenically labeled Gfi1tdTomato/+ CD8+ P14 TN cells, infected with LCMVc13 1 day later (e,f) and treated with FK506 or vehicle daily from D4–D6 post infection (f). Pooled from two experiments (n = 6 mice). gi, TCF1 (g), EOMES (h) and T-BET (i) expression in activated CD11a+CD44+GFI1hi and CD11a+CD44+GFI1lo CD8+ T cells from LCMVArm-infected and LCMVc13-infected Gfi1tdTomato/+ mice at D7 and D21 post infection. Data pooled from two experiments (n = 7 or 8 mice). Individual values and means are shown; error bars, s.e.m. Error bars not shown in e. Statistical significance using a one-way ANOVA and Dunnett’s post hoc test for a, b and e; two-tailed Student’s t-test for c, d and f; Wilcoxon signed-rank two-tailed paired t-test for gi.
Fig. 2
Fig. 2. GFI1-expressing CD8+ T cells exhibit a TM cell molecular program.
a, Shared and unique DEGs (P < 0.05) in activated CD11a+CD44+GFI1hi CD8+ T cells isolated from the spleen of Gfi1tdTomato/+ mice at D7 post infection with LCMVc13 or LCMVArm and analyzed by RNA-seq. b, Volcano plot of DEGs in GFI1hi CD8+ T cells from LCMVc13-infected mice as in a. Blue and red indicate genes upregulated in activated GFI1lo and GFI1hi CD8+ T cells, respectively. Gray dots indicate P > 0.05. c, DEseq2-normalized expression of selected genes in GFI1hi and GFI1lo CD8+ T cells isolated from LCMVc13-infected mice as in a. d, Gene set enrichment analysis of GFI1hi and GFI1lo CD8+ T cells isolated from LCMVc13-infected mice as in a, using a memory CD8+ T cells gene signature. NES, normalized enrichment score. e, Shared and unique DEGs (P < 0.05) in CD44+CD62L+GFI1hi and CD44+Ly108+GFI1hi CD8+ TM cells isolated from the spleen of Gfi1tdTomato/+ mice at D7 post infection with LCMVc13 and analyzed by RNA-seq. f,g, Representative flow cytometry plots (f) and quantification (g) of spleen donor CD45.2+CD8+ T cells at D7 post LCMVArm infection in congenic C57BL/6 mice transferred intravenously (i.v.) with splenic CD8+ T cells isolated at D21 post LCMVArm infection from CD45.2+ Gfi1tdTomato/+ mice and infected with LCMVArm 24 h later. Data pooled from two experiments (n = 7 mice per group). h, Total donor CD45.2+CD8+ T cells at D14 post LCMVc13 infection in the spleen of congenic C57BL/6 recipients infected with LCMVc13 7 days before transfer of infection-matched (D7) CD8+ T cells isolated from LCMVc13-infected CD45.2+ Gfi1tdTomato/+ mice. Data pooled from two experiments (n = 5 or 7 mice per group). P values were calculated using a Wald’s test (b, d and e) or a two-tailed Student’s t-test (g and h). Data in g and h show means; error bars, s.e.m.
Fig. 3
Fig. 3. GFI1 drives epigenetic and transcriptional changes to promote antiviral CD8+ T cell persistence.
a,b, Representative flow cytometry plots (a) and total number (b) of WT and GFI1ΔCD8 live CD8+ P14 T cells at D5–D60 post infection in the spleen of C57BL/6 mice that received a 1:1 mix of congenically labeled WT and GFI1ΔCD8 TN cells followed by LCMVc13 infection 24 h later. Data are pooled from two (n = 10 mice for D7 and D21) or one experiment (n = 5 for D5, D14, D28 and D60). c, Representative plots showing frequency of CD8+ TSCM cells at D7 in the spleen of LCMVc13-infected mice as in a. d,e, Total number of CD8+ P14 TSCM (d) and CD8+ P14 TCM (e) cells in the spleen of LCMVc13-infected mice as in a. Data are pooled from two experiments (n = 10 mice per time point). f, Representative histograms at D7 (right) and quantification (left) of Ki-67 expression in WT and GFI1ΔCD8 CD8+P14 T cells as in a. D7 data are representative of two experiments (n = 5 mice); D14 data are representative of one experiment. g, TCF1, EOMES and TOX expression in CD8+ P14 T cells at D7 in the spleen of LCMVc13-infected mice. Data are representative of two experiments (n = 6 mice). h, Expression of selected genes in WT and GFI1ΔCD8 CD8+ P14 T cells from the spleen of C57BL/6 mice transferred i.v. with congenically marked WT or GFI1ΔCD8 CD8+ P14 TN cells, infected with LCMVc13 24 h post transfer and analyzed by RNA-seq at D7 and D21 post LCMVc13 infection. i, PCA plot of WT or GFI1ΔCD8 CD8+P14 T cells at D7 and D21 post LCMVc13 infection based on RNA-seq as in h. j, Shared and unique DEGs at D7 and D21in GFI1ΔCD8 CD8+ T cells as in h. k, ATAC-seq PCA plot of splenic WT and GFI1ΔCD8 CD8+ T cells at D0, D3, D5 and D7 post LCMVc13 infection in C57BL/6 mice transferred i.v. with congenically labeled WT or GFI1ΔCD8 CD8+ P14 T cells 24 h before infection. l, Total number of DARs detected in GFI1ΔCD8 CD8+ P14 T cells versus WT CD8+ P14 T cells at D0, D3, D5 and D7 post LCMVc13 infection as in k. m, Number of DARs annotated in promotor or exon regions in GFI1ΔCD8 CD8+ P14 T cells compared with WT CD8+ P14 T cells as in l. n, Predicted GFI1 binding motif by HOMER analysis using DEGs from GFI1ΔCD8 CD8+ T cells isolated at D7 post LCMVc13 infection as in h. Statistical significance was calculated using a two-tailed paired t-test (b and dg) or Wald’s test (j, l and m).
Fig. 4
Fig. 4. GFI1 is essential for persistent CD8+ T cell responses to cytomegalovirus infection.
a,b, Representative flow cytometry plots at D7 and D90 (a) and total number at D0–D90 (b) of CD45.1+M45+ and CD45.1+M38+ CD8+ T cells post infection with MCMV in the peripheral blood of chimeric C57BL/6 mice that were reconstituted with a 1:1 mix of congenically labeled Cd8acre/+ (WT) CD45.1+ and WT CD45.2+ (WT) or Cd8acre/+Gfi1fl/fl (GFI1ΔCD8) CD45.1+ and WT CD45.2+ (GFI1ΔCD8) bone marrow (BM) after lethal irradiation and infected with MCMV 8 weeks post BM reconstitution. c, Frequency of blood CD45.1+CD8+ T cells and CD45.1+CD4+ T cells among CD8+ and CD4+ T cells in WT and GFI1ΔCD8 mice as in a. d, Total splenic M38+CD45.1+CD8+ and m139+CD45.1+CD8+ T cells at D90 post infection with MCMV in WT and GFI1ΔCD8 mice as in a. e, Representative plot (left) and quantification (right) of CD45.1+KLRG1+CD27 CD8+ TSLEC cells and CD45.1+KLRG1CD27+ CD8+ TMPEC cells in spleen at D90 post infection with MCMV in WT and GFI1ΔCD8 mice as in a. f, Kinetics of WT or GFI1ΔCD8 CD8+ P14 T cells at D0, D14, D30, D60 and D90 post MCMV-ie2-gp33 infection in the peripheral blood of C57BL/6 mice that received 1:1 mix of congenically labeled WT and GFI1ΔCD8 CD8+ P14 TN cells followed by infection with MCMV-ie2-gp33 24 h post transfer. g, Number of WT and GFI1ΔCD8 CD8+ T cells in the spleen, mLN and lung at D90 post infection with MCMV-ie2-gp33 as in f. h, Number of CD8+ TSCM and CD8+ TCM cells in the spleen at D90 post infection with MCMV-ie2-gp33 as in f. Data are shown as means; error bars, s.e.m. i, Normalized gene expression in splenic WT and GFI1ΔCD8 CD8+ P14 T cells at D7 post infection with MCMV-ie2-gp33 as in f. j, Frequency of upregulated and downregulated DARs in splenic GFI1ΔCD8 CD8+ P14 T cells at D7 post infection with MCMV-ie2-gp33 as in f. Outer donut, distribution of DARs within the exonic regions (3′-UTR, 5′-UTR, CDS and other exons). P values: two-tailed Student’s t-test (be); two-tailed paired t-test (fh). Data in be are pooled from three experiments; mean values are shown; error bars, s.e.m. (n = 10 mice per group); data in fh are pooled from two experiments (n = 10 mice). CDS, coding DNA sequence; UTR, untranslated region.
Fig. 5
Fig. 5. scMultiome-seq delineates GFI1-mediated epigenetic and transcriptional regulation in virus-specific CD8+ T cells following infection with LCMVc13.
a, UMAP showing unsupervised clustering of 7,629 WT and 5,805 GFI1ΔCD8 CD8+ T cells isolated at D7 post infection with LCMVc13 from the spleen of C57BL/6 mice transferred i.v. with congenically labeled WT or GFI1ΔCD8 CD8+ TN cells 24 h before infection, analyzed using scMultiome-seq (scRNA-seq + scATAC-seq Seurat-integrated data). b, UMAP showing WT and GFI1ΔCD8 CD8+ P14 T cell distribution in integrated data clusters as in a. c, Percentage of WT and GFI1ΔCD8 CD8+ P14 T cells in each cluster as in a. d, UMAP showing normalized expression of Btg1, E2f2, Eomes and Tcf7 in WT and GFI1ΔCD8 CD8+ P14 T cells as in a. e, Dot plot showing expression of selected genes in WT and GFI1ΔCD8 CD8+ P14 T cells in clusters 1–7 as in a. Dot size indicates fraction of cells expressing gene; color represents mean expression. f, DEGs (top) and DARs (bottom) from cluster 1 as in a, using pseudobulk analysis of scRNA-seq and scATAC-seq, respectively. g, Selected top-ranking transcription-factor-linked eRegulons predicted by SCENIC+ analysis using scRNA-seq and scATAC-seq as in a. Color scale shows gene expression-based enrichment score; dot size illustrates chromatin accessibility-based enrichment score for each eRegulon and cell cluster. h, WT and GFI1ΔCD8 CD8+ T cell chromatin accessibility and gene expression at Tcf7 gene locus in cluster 1 as in a. Dashed boxes highlight differentially accessible chromatin regions.
Fig. 6
Fig. 6. GFI1 is required for secondary CD8+ T cell responses.
a,b, Representative plot (left) and quantification (right) of donor WT and GFI1ΔCD8 CD8+ T cells at D7 post infection with LCMVArm (a) or MCMV-ie2-gp33 (b) in the spleen of secondary C57BL/6 recipients transferred with 1:1 mix of congenically labeled activated WT and GFI1ΔCD8 CD8+ T cells isolated at D7 post infection with LCMVc13 from the spleen of primary C57BL/6 recipients that received congenically labeled WT or GFI1ΔCD8 CD8+ TN cells 24 h before infection with LCMVc13. Data are pooled from two experiments (n = 9 or 10 mice); mean values are shown; error bars, s.e.m. c, Weight-loss kinetics of Rag2–/–Il2rγ–/– mice that received activated WT or GFI1ΔCD8 CD8+ P14 T cells from C57BL/6 mice that received WT or GFI1ΔCD8 CD8+ P14 TN cells 1 day before infection with LCMVc13. d, Virus titer in the lungs and liver of Rag2–/–Il2rγ–/– at D14 post transfer of activated WT or GFI1ΔCD8 CD8+ P14 T cells as in c. Dashed line, assay detection limit. e, scMultiome-seq data showing expression of Bcl2 in splenic WT and GFI1ΔCD8 CD8+ T cells isolated at D7 post infection from C57BL/6 mice that received congenically labeled WT or GFI1ΔCD8 CD8+ TN cells 24 h before LCMVc13 infection. f, Representative histogram (top) and quantification (bottom) of BCL-2 expression at D7 in splenic CD8+ P14 T cells isolated from C57BL/6 mice transferred with a 1:1 mix of congenically labeled WT and GFI1ΔCD8 TN cells 24 h before LCMVc13 infection. Data are representative of two experiments (n = 6 mice). g, Cluster 1 WT (blue) and GFI1ΔCD8 (red) CD8+ T cell chromatin accessibility and gene expression at the Bcl2 locus as in e. Dashed boxes, DARs. h, Representative plots (left) and quantification (right) of splenic WT and GFI1ΔCD8 caspase-3+CD8+ T cells at D7 post LCMVc13 infection as in f. Control, FMO staining of WT CD8+ T cells. Data are representative of two experiments (n = 5 mice). i, BCL-2 expression in CD8+ TN cells from the spleen of naive WT and GFI1ΔCD8 mice; mean ± s.e.m. Data are pooled from two experiments (n = 6 or 7 mice per genotype). P values were calculated using a two-tailed paired t-test (a, b, f and h) or two-tailed Student’s t-test (c, d and i). Data in c and d are representative of two experiments; mean values are shown; error bars, s.e.m. (n = 4, 5 or 6 mice per condition).
Fig. 7
Fig. 7. GFI1 epigenetically regulates EOMES expression in memory CD8+ T cells.
a, Representative histogram (left) and quantification (right) of EOMES expression in splenic WT and GFI1ΔCD8 CD8+ P14 T cells at D7 post infection in C57BL/6 mice that received a 1:1 mix of congenically labeled WT and GFI1ΔCD8 CD8+ P14 T cells 24 h before infection with LCMVc13. Data are pooled from two experiments (n = 10 mice per time point). b, Representative histogram (left) and quantification (right) of EOMES expression in splenic WT and GFI1ΔCD8 CD8+ TSCM cells at D7 post LCMVc13 infection as in a. One of two experiments is shown (n = 5 mice). c, Chromatin accessibility at Eomes locus in WT (blue) and GFI1ΔCD8 (red) CD8+ T cells isolated at D7 post infection from the spleen of C57BL/6 mice that received congenically labeled WT or GFI1ΔCD8 CD8+ TN cells 24 h before infection with LCMVc13; analyzed with scMultiome-seq. Dashed boxes, DARs. d,e Representative plots (d) and quantification (e) of WT and GFI1ΔCD8 CD45.1+CD8+ P14 T cells at D14 in the spleen of CD45.2+ C57BL/6 mice transferred with WT or GFI1ΔCD8 CD45.1+CD8+ P14 T cells transduced with control or EOMES-expressing (EOMES-OE) lentivirus and infected with LCMVc13 24 h later. f, Ki-67 expression in splenic WT and GFI1ΔCD8 CD8+ P14 T cells as in d. g, Representative histograms (left) and quantification (right) of BCL-2 expression in splenic WT and GFI1ΔCD8 CD8+ P14 T cells as in d. h, Representative flow cytometry of splenic EOMEShiCD8+ P14 T cells at D7 post infection in C57BL/6 mice that received congenically labeled EomesmCherry/+ CD8+ P14 TN cells 24 h before infection with LCMVc13. Data are representative of two independent experiments. i, Representative flow cytometry plot (left) and quantification (right) of splenic CD45.1+CD8+ P14 T cells at D21 post LCMVc13 infection in secondary infection recipients that at D7 post infection received matched (D7 post infection) activated CD45.1+EOMEShi or CD45.1+EOMESlo CD8+ T cells isolated from primary-infected C57BL/6 mice, which were adoptively transferred with EomesmCherry/+ CD8+ P14 TN cells 1 day before primary infection with LCMVc13. Data are from one experiment; mean values are shown; error bars, s.e.m. (n = 5 mice per condition). P values were calculated using a two-tailed paired t-test (a, b and j) or two-tailed Student’s t-test (eg). Data in dg are pooled from two experiments (n = 4 or 6 mice per condition); mean values are shown; error bars, s.e.m.
Fig. 8
Fig. 8. Continuous expression of GFI1 is required to maintain CD8+ T cell persistence following chronic viral infection.
a, Representative flow cytometry plot (left) and quantification (right) of R26Cre-ERT2/+Gfi1fl/+ and R26Cre-ERT2/+Gfi1fl/fl CD8+ P14 T cells in peripheral blood of MCMV-ie2-gp33-infected C57BL/6 mice that received 1:1 mix of congenically labeled R26Cre-ERT2/+Gfi1fl/+ and R26Cre-ERT2/+Gfi1fl/fl CD8+ P14 T cells 30 days before tamoxifen treatment and were infected with MCMV-ie2-gp33 1 day post CD8+ T cell adoptive transfer; mean values are shown; error bars, s.e.m. b, Number of R26Cre-ERT2/+Gfi1fl/+ and R26Cre-ERT2/+Gfi1fl/fl CD8+ P14 T cells in spleen at D14 and D28 after tamoxifen treatment as in a; mean values are shown; error bars, s.e.m. c, Expression of TCF1, EOMES and BCL-2 in R26Cre-ERT2/+Gfi1fl/+ and R26Cre-ERT2/+Gfi1fl/fl CD8+ P14 T cells at D28 after tamoxifen treatment as in a. d, Representative histogram at D28 (right) and quantification at D14 and D28 (left) of Ki-67 expression in splenic R26Cre-ERT2/+Gfi1fl/+ and R26Cre-ERT2/+Gfi1fl/fl CD8+ P14 T cells as in a. In bd, data are pooled from two independent experiments (n = 9 or 10 mice per time point). P values were calculated using a two-tailed paired t-test.
Extended Data Fig. 1
Extended Data Fig. 1. GFI1 expression in antiviral CD8+ T cell following virus infection.
a, Expression of GFI1-tdTomato in naïve CD8+ T cells (live CD45+CD3+TCRb+CD8a+) isolated from different tissues of naïve Gfi1tdTomato mice. Control CD8+ T cells were isolated from the spleen of a naïve C57BL/6 mouse. Histograms show geometric mean florescence intensity (gMFI) of GFI1-tdTomato expression. Data representative of three independent experiments except for the bone marrow (BM) data which is from a single experiment. b, Flow cytometric dot plots showing frequency of GFI1hi and GFI1lo cell among total CD8+ T cells (live CD3+TCRb+CD8a+) isolated from spleen of naïve, LCMVArm- or LCMVc13-infected Gfi1tdtomato mice at D7 after infection. c, GFI1-tdTomato expression in total CD8+ T cells isolated from spleen of naïve, LCMVArm- or LCMVc13-infected Gfi1tdtomato mice at D7 after infection. Data are pooled from two experiments (n = 7, 10 or 15 mice/condition). p values were calculated using a two-tailed unpaired Student’s t test. d, Gating strategy for naïve (TN, CD11aCD44) and activated (CD11a+CD44+) CD8+ T cells among total CD8+ T cells (live CD45+CD3+CD8a+). Activated CD8+ T cells were further separated into TCM (CD27+CD62L+), TSCM (TCF1+CX3CR1-), TEFF (TCF1-CX3CR1+) and TPEX (TCF1+TOX+) populations. e, Flow cytometric dot plots showing TSCM (red dots) and TEFF (blue dots) cells isolated from spleen at D7 after LCMVc13 infection (left panel). GFI1-tdTomato expression in TSCM and TEFF CD8+ T cells isolated from spleen of LCMVc13 infected mice (right panel). Data pooled from two experiments (D0, D7 and D21, n = 6, 7 or 13 mice/timepoint), or a single experiment (D14, n = 4 mice) and show individual responses. p values were determined using the Wilcoxon signed-rank paired t test. f, Frequency of CD62L+ TPEX (blue dots) and CD62L TPEX (red dots) among total CD8+ TPEX T cells isolated from spleen at D7 after LCMVc13 infection (left panel). GFI1-tdTomato expression in CD62L+ and CD62L TPEX CD8+ T cells isolated from spleen at D7 (right panel). p values were calculated using a Wilcoxon signed-rank paired t test. Data are pooled from two independent experiments (n = 13 mice). g, h, GFI1-tdTomato expression in gp33+CD8+ T cells in spleen, mLN and lungs following LCMVArm (g) or LCMVc13 (h) infection. Data pooled from two experiments (D7 and D21, n = 6, 7 or 8 mice/timepoint), or a single experiment (D14 for panel h, n = 4 mice) and show individual responses. p values were calculated using a two-tailed unpaired Student’s t test. i,j, Naïve Gfi1tdTomato P14 T cells (CD45.1+CD45.2+, 1×10⁵ cells) were transferred to congenic recipients (CD45.2+) and the next day recipients were infected with LCMVc13. i, Flow cytometric plots showing P14 T cells frequency among total CD8+ T cells following LCMVc13 infection. j, Expression of GFI1-tdTomato by P14 T cells isolated from mLN following infection. p values were calculated using one-way ANOVA and Dunnett’s post-test. Data pooled from two independent experiments (n = 8 mice/ timepoint).
Extended Data Fig. 2
Extended Data Fig. 2. Transcriptional profile of antiviral GFI1high and GFI1low CD8+ T cells following chronic or acute LCMV infection.
Gfi1tdTomato/+ mice were infected with LCMVc13 or LCMVArm virus via tail vein or intraperitoneal injection, respectively. Activated (CD11a+CD44+) GFI1hi and GFI1lo CD8+ T cells were flow cytometrically sorted at D7 after infection and RNA-seq was performed. a, Gating strategy used to sort GFI1hi and GFI1lo CD8+ T cells from spleen of infected Gfi1tdTomato/+ mice at D7. b, Principal component analyses (PCA) plot showing clustering of CD8+ T cells. Replicates of the same group are indicated by the same colour and shape. c, DEseq2 normalized gene expression for Gfi1 in GFI1hi and GFI1lo CD8+ T cells following LCMVc13 infection. p value was calculated using two-tailed Student’s t test. d, DEseq2 normalized expression of selected genes in CD8+ T cells isolated from LCMVc13 or LCMVArm infected Gfi1tdTomato mice. e, GSEA analysis of CD8+ T cells isolated from LCMVArm-infected mice tested on memory CD8+ T cells gene signature. p value was calculated using Wald’s test. f, GSEA Hallmark pathway analysis. Dot plots show the changes in GSEA hallmark pathways, where size of dot represents absolute pathway enrichment in GFI1hi vs GFI1lo comparison. p values were calculated using Wald’s test.
Extended Data Fig. 3
Extended Data Fig. 3. Transcriptional profile of GFI1high central memory and stem cell memory CD8+ T cells.
a,b, Gfi1tdTomato/+ mice were infected with LCMVc13 via tail vein injection. GFI1hi and GFI1lo CD8+ T cells from CD44+CD62L+ (TCM) and CD44+Ly108+ (TSCM precursor) CD8+ T cells were flow cytometrically sorted from spleen and mLN at D7 after infection and RNA-seq was performed. p values were calculated using Wald’s test. a, Volcano plot showing DEGs (p < 0.05) in CD44+CD62L+ and CD44+Ly108+ GFI1hi CD8+ T cells isolated from LCMVc13-infected mice. Blue and red dots show genes upregulated in GFI1lo and GFI1hi CD8+ T cells, respectively. b, DEseq2 normalized expression of selected genes in CD44+CD62L+ and CD44+Ly108+ CD8+ T cells isolated from LCMVc13-infected Gfi1tdTomato mice. c, Schematic of Gfi1tdTomato/+ CD8+ T cell isolation and transfer (1×10⁵ cells/recipient) to congenic mice followed by challenge with LCMVArm infection. d, Total donor cells in mLN of recipients at D7 after LCMVArm infection. Data pooled from two experiments (n = 7 mice/group). p value calculated using two-tailed Student’s t test. e, CD44+Ly108+GFI1hi, CD44+CD62L+GFI1hi or CD44+GFI1lo CD8+ T cells were flow cytometrically isolated from spleen of Gfi1tdTomato mice (CD45.2+) at D21 after LCMVArm infection. Each population was adoptively transferred (5×10⁴ cells) into congenic recipient mice (CD45.1+CD45.2+ or CD45.1+), then infected with LCMVArm. Flow cytometric dot plots show frequency of donor cells (CD45.2+) among total CD8+ T cells isolated from spleen at D7 after LCMVArm infection (left plots). Total number of donor cells in spleen of recipients at D7 after LCMVArm infection. Data are pooled from two independent experiments (n = 6 or 7 mice/group). p values were calculated using Kruskal-Wallis test followed by Benjamini–Hochberg FDR test for individual comparison. f, Schematic of Gfi1tdTomato/+ CD8+ T cell isolation and transfer (1×10⁵ cells/recipient) to infection matched mice.
Extended Data Fig. 4
Extended Data Fig. 4. Phenotypic characterisation of naïve GFI1ΔCD8 CD8+ T cells.
a, Frequency of CD4+ single positive (SP) and CD8+ SP cells among total live cells isolated from thymus of naïve age matched Cd8acre/+Gfi1+/+ (WT) and Cd8acre/+Gfi1fl/fl (GFI1ΔCD8) mice. b, Total number of CD8+ (live TCRb+CD4-CD8+) and CD4+ (live TCRb+CD4+CD8-) T cells in thymus of naïve Cd8acre/+Gfi1+/+ (WT) and Cd8acre/+Gfi1fl/fl (GFI1ΔCD8) mice. c, Frequency of CD4+ and CD8+ T cells among total T cells (live TCRb+CD3+) isolated from spleen of naïve Cd8acre/+Gfi1+/+ (WT) and Cd8acre/+Gfi1fl/fl (GFI1ΔCD8) mice. d, Total number of CD8+ (live CD3+CD8+) and CD4+ (live CD3+CD4+) T cells in spleen of naïve Cd8acre/+Gfi1+/+ (WT) and Cd8acre/+Gfi1fl/fl (GFI1ΔCD8) mice. e, TCF1, EOMES, T-BET and TOX expression in naïve CD8+ T cells isolated from spleen of naïve Cd8acre/+Gfi1+/+ (WT) and Cd8acre/+Gfi1fl/fl (GFI1ΔCD8) mice. b, d, and e, data pooled from two independent experiments (n = 6 or 7 mice/genotype). p values were determined using a two-tailed Student’s t test.
Extended Data Fig. 5
Extended Data Fig. 5. CD8+ T cell responses mounted by GFI1-deficient following chronic LCMV infection.
a-e, Congenically-labelled naïve WT (CD45.1+) and GFI1ΔCD8 (CD45.1+CD45.2+) P14 T cells were co-transferred (5×10³ cells each) to C57BL/6 mice that were subsequently infected with LCMVc13 24 h later. a, Total number of WT and GFI1ΔCD8 P14 T cells in peripheral blood, mLN and Lungs. b, Total number of TSCM P14 T cells in spleen. a, b, Data pooled from two (n = 10 mice for D7 and D21) or one experiment (n = 5 for D5, D14, D28 and D60). c, Total number of TCF1-CX3CR1+ and TCF1-CX3CR1- P14 T cells in spleen at D7 after infection. Data are pooled from two independent experiments (n = 11 mice). d, CD127, CX3CR1, FOXO1, KLRG1, PD-1, TIM3 and T-BET expression in WT and GFI1ΔCD8 P14 T cells at D7 after LCMVc13 infection. Data show expression from one of two independent experiments (n = 6 mice). e, Genes differentially expressed between GFI1ΔCD8 and WT P14 T cells were subjected to GO pathway enrichment analysis. Bar plots show top 10 significantly upregulated and downregulated pathways. p values calculated using Wald’s test followed by Benjamini–Hochberg FDR testing. a, b, data show mean ± s.e.m. b-e p values were determined with a two-tailed paired t test.
Extended Data Fig. 6
Extended Data Fig. 6. Characterization of transcriptional and epigenetic profile of GFI1-deficient CD8+ T cells following chronic LCMV infection.
a, Naïve congenically labelled WT or GFI1ΔCD8 P14 CD8+ T cells (CD45.1+) were adoptively transferred into C57BL/6 mice that were subsequently infected with LCMVc13. P14 T cells were isolated from spleen at D7 after infection and analysed using RNA-seq. DEseq2 normalized expression of selected genes is shown. b-e, Congenically-labelled naïve WT (CD45.1+) and GFI1ΔCD8 (CD45.1+CD45.2+) P14 T cells were mixed 1:1 and co-transferred to C57BL/6 mice that were subsequently infected with LCMVc13 24 h later. Splenic P14 T cells were analysed at D7 after infection. b, Uptake of fluorescent glucose analog 2-NBDG and fluorescent fatty acid (BODIPY C16) in P14 T cells isolated from spleen at D7. c, Mitochondrial mass and membrane potential determined by Mitotracker Green and Mitotracker Red (CMX ROS) labeling, respectively, in P14 T cells isolated at D7. d, Plots showing frequency of P14 cells with dysfunctional mitochondria (left panels). Data showing frequency of P14 cells with dysfunctional mitochondria (right panel). e, Histograms showing granzyme B expression in WT (blue line) and GFI1ΔCD8 (red line) P14 CD8+ T cells following gp33 peptide stimulation. Control (black dotted line) shows unstimulated WT P14 CD8+ T cells (left panel). Data show granzyme B expression in P14 T cells at D7. b-e Data are representative of two experiments (n = 6 mice). p values calculated using a two-tailed paired t test. f,g, Naïve congenically-labelled WT or GFI1ΔCD8 P14 CD8+ T cells (CD45.1+) were adoptively transferred into C57BL/6 mice that were infected with LCMVc13 24 h later. Nuclei from activated splenic P14 T cells (D7 after infection) and naïve P14 T cells were isolated to perform bulk ATAC-seq. f, Chromatin accessibility read density enrichment around peak centres for P14 T cells. Upper panels show the average profile around detected peak centres. Lower panels show read intensity heatmaps ranked by total read intensity. Reads are centred on the middle of the accessible peak ±1.5 Kbp. Data pooled from three samples to generate read density map. g, Number of differentially accessible regions detected in naïve GFI1ΔCD8 P14 CD8+ T cells and annotated in and around promotor or exon regions.
Extended Data Fig. 7
Extended Data Fig. 7. CD8+ T cell responses mounted by GFI1-deficient following latent MCMV infection.
a, Schematic showing irradiation, BM cells injection, MCMV infection, peripheral blood and tissue analysis. b,c, Mixed bone marrow chimeras were generated by adoptive transfer of equal mix of WT CD45.1+ and WT CD45.2+ (WT + WT) or GFI1ΔCD8 CD45.1+ and WT CD45.2+ (WT + GFI1ΔCD8) bone marrow cells into irradiated C57BL/6 mice that were infected with MCMV intraperitoneally 60 days after reconstitution. b, Total number of CD45.1+CD8+ T cells in peripheral blood 8 weeks following bone marrow reconstitution. c, Flow cytometric dot plots showing frequency of TSLEC (KLRG1+CD27-) and TMPEC (KLRG1-CD27+) among activated (CD11a+CD44+) CD8+ T cells isolated from the spleen of bone marrow chimeric mice at D90 after infection (left panels). Total number of TSLEC and TMPEC CD45.1+CD8+ T cells in spleen at D90 (right panels). b, c Data pooled from 2 experiments (n = 9 or mice/condition) is shown as mean ± s.e.m. p values were calculated using a two-tailed unpaired Student’s t test. d,e, Naïve congenically-labelled WT (CD45.1+) and GFI1ΔCD8 (CD45.1+CD45.2+) P14 T cells were mixed 1:1 and co-transferred to C57BL/6 mice that were subsequently infected with MCMV-ie2-gp33 the next day. Mice were euthanized at D7 after infection to assess CD8+ T cell responses in tissues. d, Frequency of TSELC and TMPEC among WT and GFI1ΔCD8 P14 CD8+ T cells isolated from spleen at D7 after infection. Data pooled from two experiments (n = 10 mice). e, Data show Ki-67, TCF1, EOMES, T-BET and TOX expression from one of two independent experiments (n = 6 mice). f, Frequency of IFN-γ+ and IFN-γ+TNFα+ among total WT and GFI1ΔCD8 P14 CD8+ T cells isolated from spleen following gp33 peptide stimulation (left panels). Data showing frequency of IFN-γ+ and TNFα+ P14 CD8+ T cells from one of two independent experiments (n = 5 mice). d-f, p values calculated using a two-tailed paired t test. g, Chromatin accessibility read density enrichment around peak centres for adoptively transferred congenically-labelled WT or GFI1ΔCD8 P14 CD8+ T cells (CD45.1+) in response to MCMV-ie2-gp33 at D7. Upper panels show the average profile around detected peak centres. Lower panels show read intensity heatmaps ranked by total read intensity. Reads are centred on the middle of the accessible peak ±1.5 Kbp. Data pooled from three samples to generate read density map.
Extended Data Fig. 8
Extended Data Fig. 8. scMultiome-seq analysis of virus-specific CD8+ T cells following chronic virus infection.
Naïve congenically-labelled WT or GFI1ΔCD8 P14 CD8+ T cells (CD45.1+) were transferred to C57BL/6 mice that were subsequently infected with LCMVc13 the next day. P14 T cells were isolated on D7 after infection for scMutiomic-seq. a, Schematics showing scMutiomic-seq workflow. b, UMAP projection showing unsupervised clustering of WT and GFI1ΔCD8 CD8+ T cells (WT + GFI1ΔCD8 Seurat integrated data). c, UMAP projection showing cell-cycle phases of WT and GFI1ΔCD8 CD8+ T cells based on expression of G2/M and S phase genes (scRNA-seq data). d, Aggregate gene expression of top 20 upregulated genes for each cluster. e, Cluster 1 and 5 WT (blue histogram and violin plots) and GFI1ΔCD8 (red histogram and violin plots) CD8+ T cell chromatin accessibility and gene expression at Btg1 gene locus. Dashed boxes highlight differentially assessable chromatin regions. f, Transcription factor linked gene regulatory networks identified by SCENIC+ analysis. Core regulatory genes shown in red and target genes in blue. g, Cluster 1 and 2 WT (blue histogram and violin plots) and GFI1ΔCD8 (red histogram and violin plots) CD8+ T cell chromatin accessibility at E2f1 (left panel) and E2f7 (right panel) gene locus. Dashed boxes highlight differentially assessable chromatin regions.
Extended Data Fig. 9
Extended Data Fig. 9. GFI1-deficient CD8+ T cells exhibit reduced proliferation and are prone to activation induced T cell death.
a, Schematic representation showing naïve P14 CD8+ T cells transfer to C57BL/6 mice that were infected with LCMVc13 after 24 h. P14 T cells were isolated at D5 after infection, labelled with CTV then cultured in vitro for 4 days with IL-2, IL-2 + IL-7 or IL-2 + CD3/CD28 beads. b, Flow cytometric histograms showing WT (blue) and GFI1ΔCD8 (red) CD8+ T cell proliferation. Dotted lines mark cell divisions. c, Total number of WT and GFI1ΔCD8 CD8+ T cells per well after 4 days in vitro culture shown as mean ± s.e.m. Data pooled from two independent experiments (n = 6 mice). p values were calculated using a two-tailed Student’s t test. d, Schematics showing P14 T cell activation with primary infection, sorting, and transfer to secondary recipients and virus infection. e, Naïve congenically-labelled WT or GFI1ΔCD8 P14 CD8+ T cells (CD45.1+) were transferred to C57BL/6 mice that were subsequently infected with LCMVc13 the next day. P14 T cells were isolated on D7 after infection for scMutiomic-seq. Dot plot showing expression of selected cell death related genes in WT and GFI1ΔCD8 P14 T cells, with dot size indicating fraction of cells expressing gene and colour representing mean expression. f, Mixed bone marrow chimeras were generated by adoptive transfer of equal mix of WT CD45.1+ and WT CD45.2+ (WT + WT) or GFI1ΔCD8 CD45.1+ and WT CD45.2+ (WT + GFI1ΔCD8) bone marrow into irradiated C57BL/6 mice that were infected with MCMV intraperitoneally at D60 after reconstitution. Histograms (left panel) and bar plots (right panels) showing expression of BCL-2 in CD8+ T cells isolated from spleen at D7 after infection shown as mean ± s.e.m. g, Flow cytometric plot showing frequency of caspase-3+ (casp-3) CD45.1+CD8+ T cells isolated from spleen 7 days after infection (left panels). Frequency of casp-3+ CD45.1+ CD8+ T cells in spleen 7 days after infection shown as mean ± s.e.m. (right panel). f, g, Data pooled from two experiments (n = 5 or 6mice). p values were determined using a two-tailed unpaired Student’s t test.
Extended Data Fig. 10
Extended Data Fig. 10. Continuous expression of GFI1 is required to maintain persistence of antiviral CD8+ T cells.
a-d, Congenically-labelled naïve R26Cre-ERT2/+Gfi1fl/+ and R26Cre-ERT2/+Gfi1fl/fl P14 T cells were co-transferred to C57BL/6 mice that were subsequently infected with MCMV-ie2-gp33 the next day. Mice were treated with tamoxifen daily for 4 days from day 30 after infection and CD8+ T cell responses analysed at D14 or D28 after tamoxifen. a, Schematic showing P14 T cell transfer, virus infection, tamoxifen treatment and analysis. b, Total number of P14 T cells in lungs and liver at D14 and D28 after tamoxifen treatment. c, Total number of TSCM P14 T cells in spleen at D14 and D28 after tamoxifen treatment. d, Expression of TCF1, EOMES, T-BET, FOXO1 and BCL-2 in P14 T cells isolated from spleen of tamoxifen-treated animals at D14 after treatment. b-d Data pooled from two experiments/timepoint (n = 9 or 10 mice/timepoint). e, Congenically-labelled naïve R26Cre-ERT2/+Gfi1fl/+ and R26Cre-ERT2/+Gfi1fl/fl P14 T cells were co-transferred to C57BL/6 mice that were subsequently infected with LCMVc13 the next day. Mice were treated with tamoxifen at D15 after infection for 4 days and CD8+ T cell responses were analysed on D30 after infection. Plot showing frequency of TSCM P14 T cells in spleen at D30 (left panel). Total number of P14 and TSCM T cells in spleen and lungs (left panel). Data pooled from two experiments (n = 11 mice). b-e Data show mean ± s.e.m. p values were determined using a two-tailed paired t test.

Similar articles

References

    1. Gattinoni, L., Speiser, D. E., Lichterfeld, M. & Bonini, C. T memory stem cells in health and disease. Nat. Med.23, 18–27 (2017). - PMC - PubMed
    1. Hammarlund, E. et al. Duration of antiviral immunity after smallpox vaccination. Nat. Med.9, 1131–1137 (2003). - PubMed
    1. Soerens, A. G. et al. Functional T cells are capable of supernumerary cell division and longevity. Nature614, 762–766 (2023). - PMC - PubMed
    1. Utzschneider, D. T. et al. T cell factor 1-expressing memory-like CD8+ T cells sustain the immune response to chronic viral infections. Immunity45, 415–427 (2016). - PubMed
    1. Zehn, D., Thimme, R., Lugli, E., de Almeida, G. P. & Oxenius, A. ‘Stem-like’ precursors are the fount to sustain persistent CD8+ T cell responses. Nat. Immunol.23, 836–847 (2022). - PubMed

MeSH terms

LinkOut - more resources