

Automation of flow cytometry data analysis with elastic image registration
- PMID: 40374736
- PMCID: PMC12081842
- DOI: 10.1038/s41598-025-99118-1
Automation of flow cytometry data analysis with elastic image registration
Abstract
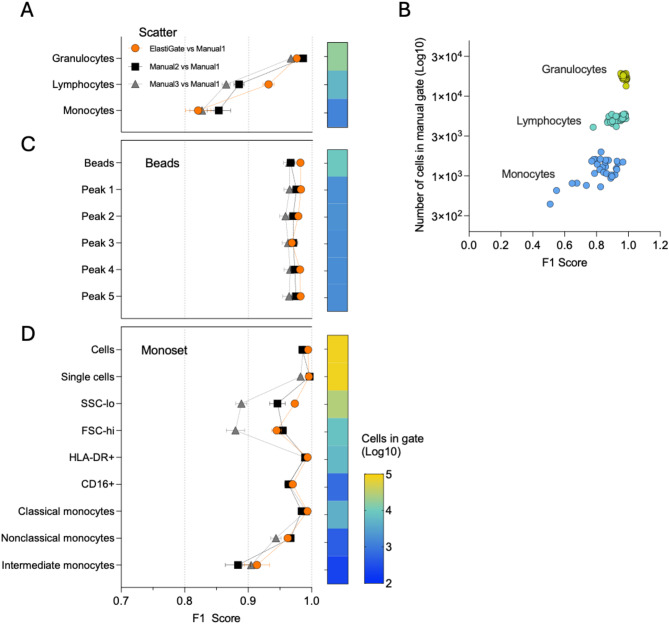
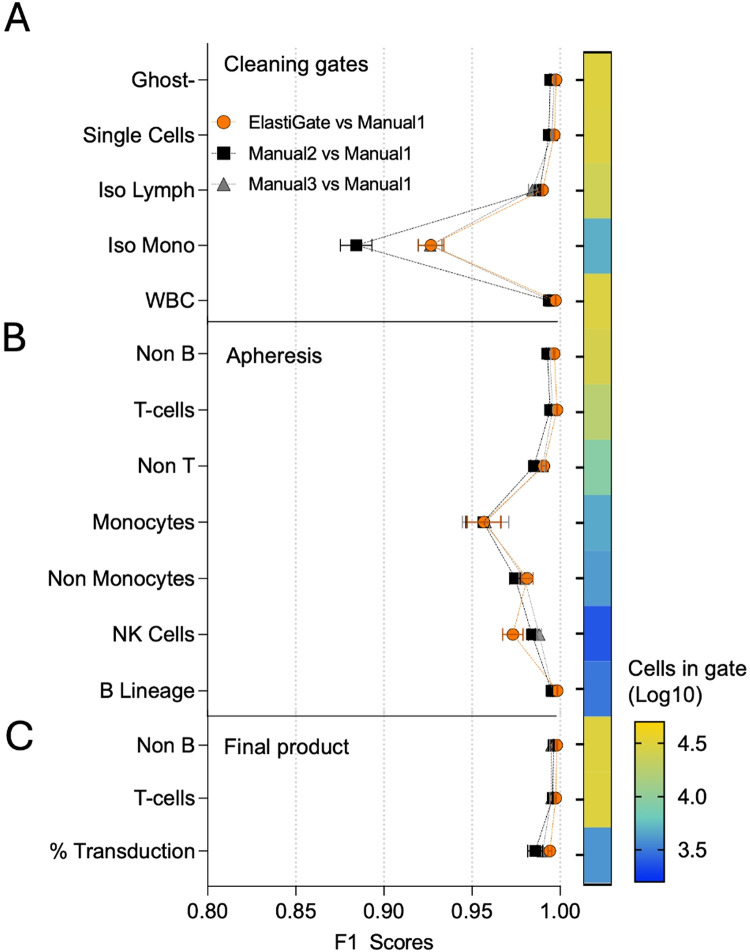
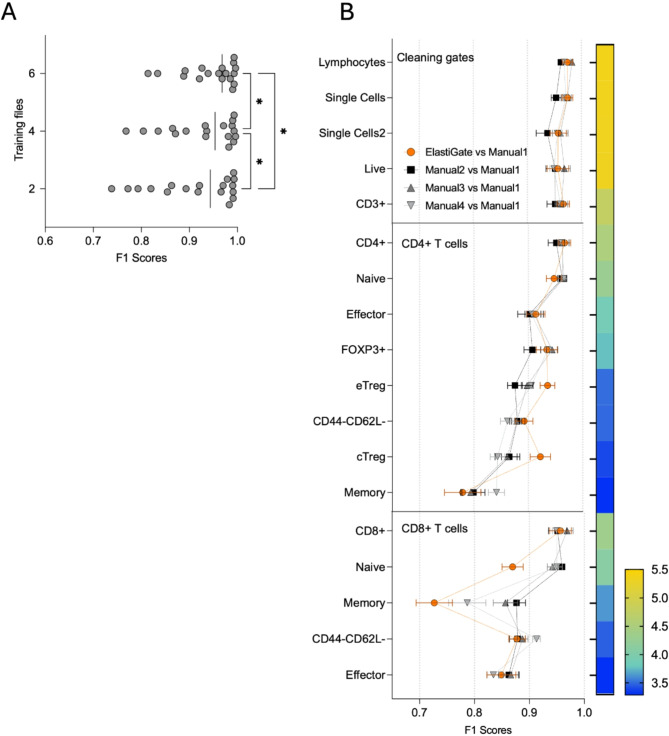
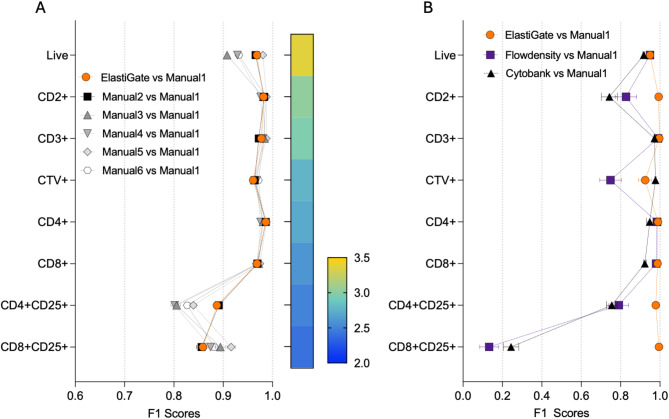
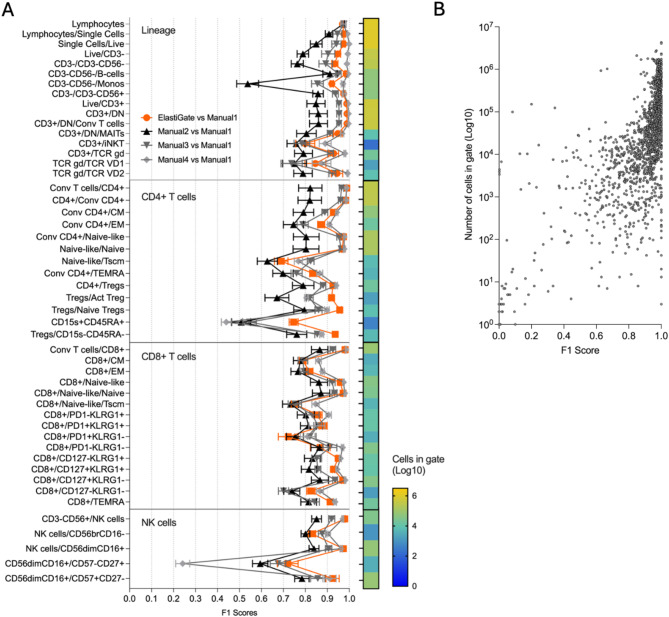
Cell populations in flow cytometry are typically identified via visual manual gating, a time-consuming and error-prone approach to select subpopulations based on expression of cellular markers. Batch processing can be used to automate the analysis of bimodally distributed data but underperforms with highly-variable or continuously-expressed markers. We developed a visual pattern recognition automated gating tool, BD ElastiGate Software (hereafter ElastiGate), to recapitulate the visual process of manual gating by automatically adjusting gates to capture local variability. ElastiGate converts histograms and two-dimensional plots into images, then uses elastic B-spline image registration to transform pre-gated training plot images and their gates to corresponding ungated target plot images, thereby adjusting for local variations. ElastiGate was validated with biologically relevant datasets in CAR-T cell manufacturing, tumor-infiltrating immunophenotyping, cytotoxicity assays (> 500 data files), and a high-dimensional dataset. Accuracy was evaluated against corresponding manually gated analysis using F1 score statistics. ElastiGate performed similarly to manual gating, with average F1 scores of > 0.9 across all gates. ElastiGate, accessible as a FlowJo Software plugin or in BD FACSuite Software, uses minimal training samples to automate gating while substantially reducing analysis time and outperforming existing 2D plot autogating solutions in F1 scores and ease of implementation.
© 2025. The Author(s).
Conflict of interest statement
Declarations. Competing interests: A.I. and S.J.B. are employees of and own stock in BD. M.M., L.H., F.D., T.F. and R.C. are employees of AstraZeneca with stock ownership and/or stock options in the company. S.P. and A.P. are employees of and own stock in Novartis. J.O. declares no potential conflicts of interest.
Figures
Similar articles
-
Automated analysis of flow cytometry data with minimal training files: Research evaluation of an elastic image registration algorithm for TBNK, stem cell enumeration, and lymphoid screening tube assays.Cytometry B Clin Cytom. 2024 Oct 17. doi: 10.1002/cyto.b.22210. Online ahead of print. Cytometry B Clin Cytom. 2024. PMID: 39417216
-
Automated cytometric gating with human-level performance using bivariate segmentation.Nat Commun. 2025 Feb 12;16(1):1576. doi: 10.1038/s41467-025-56622-2. Nat Commun. 2025. PMID: 39939580 Free PMC article.
-
QUAliFiER: an automated pipeline for quality assessment of gated flow cytometry data.BMC Bioinformatics. 2012 Sep 28;13:252. doi: 10.1186/1471-2105-13-252. BMC Bioinformatics. 2012. PMID: 23020243 Free PMC article.
-
Current trends in flow cytometry automated data analysis software.Cytometry A. 2021 Oct;99(10):1007-1021. doi: 10.1002/cyto.a.24320. Epub 2021 Feb 19. Cytometry A. 2021. PMID: 33606354 Review.
-
Automation for clinical CD4 T-cell enumeration, a desirable tool in the hands of skilled operators.Cytometry B Clin Cytom. 2017 Nov;92(6):445-450. doi: 10.1002/cyto.b.21370. Epub 2016 Mar 30. Cytometry B Clin Cytom. 2017. PMID: 26990810 Review.
References
-
- Cheung, M. et al. Current trends in flow cytometry automated data analysis software. Cytometry A99, 1007–1021 (2021). - PubMed
-
- Conrad, V. K. et al. Implementation and validation of an automated flow cytometry analysis pipeline for human immune profiling. Cytometry A95, 183–191 (2019). - PubMed
-
- Czechowska, K. et al. Cyt-Geist: current and future challenges in cytometry: Reports of the CYTO 2019 Conference workshops. Cytometry A95, 1236–1274 (2019). - PubMed
-
- Flores-Montero, J. et al. EuroFlow Lymphoid Screening Tube (LST) data base for automated identification of blood lymphocyte subsets. J. Immunol. Methods475, 112662 (2019). - PubMed
MeSH terms
LinkOut - more resources
Full Text Sources
