. 2025 May 15;15(1):16959.
doi: 10.1038/s41598-025-01343-1.

The protective effects of propolis against lipopolysaccharide-induced acute liver injury by modulating serum metabolites and gut flora

Affiliations

The protective effects of propolis against lipopolysaccharide-induced acute liver injury by modulating serum metabolites and gut flora

Zhengxin Liu et al. Sci Rep. .

Abstract

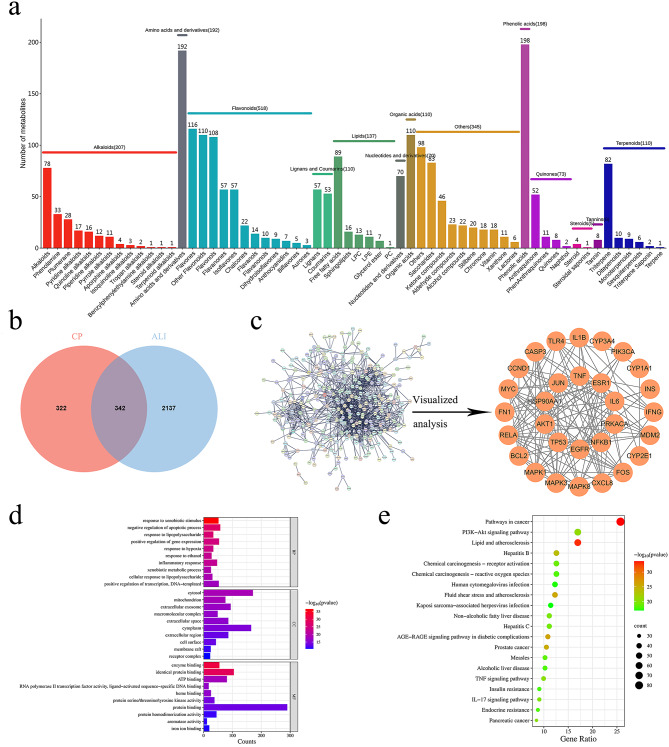
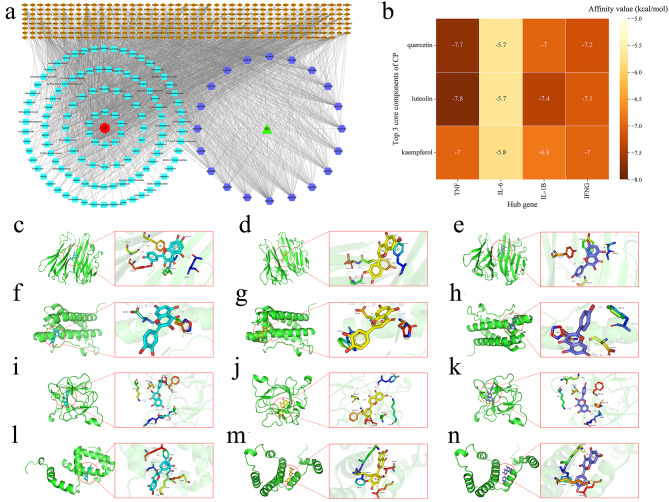
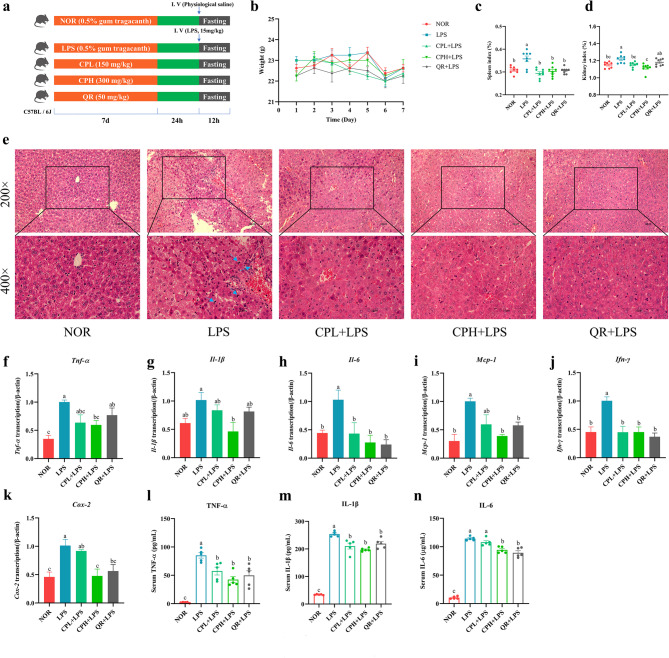
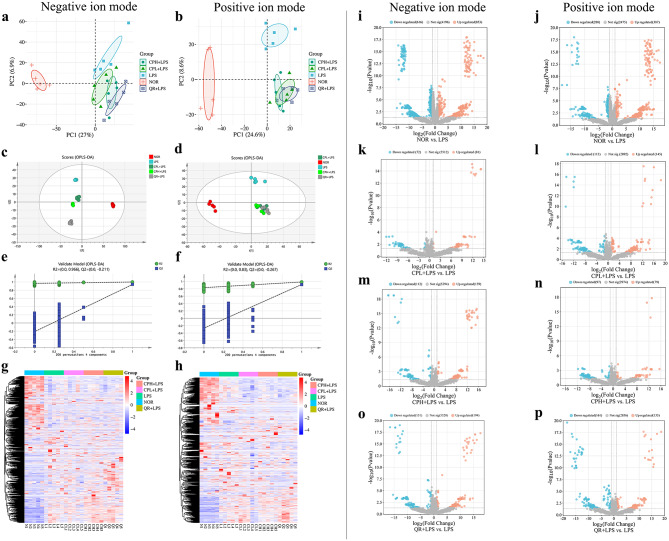
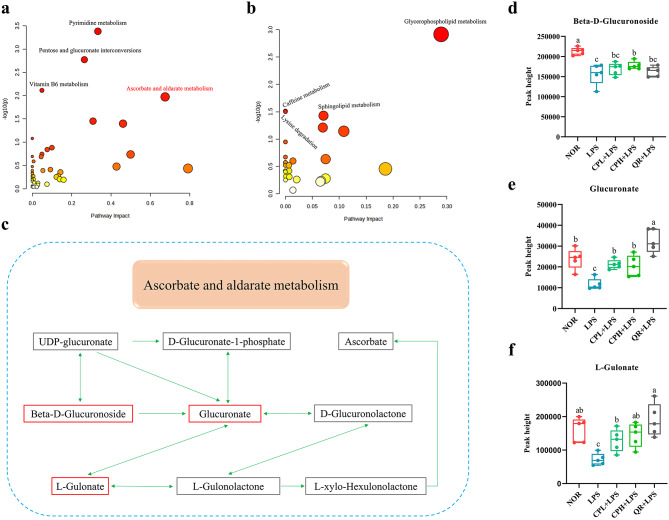
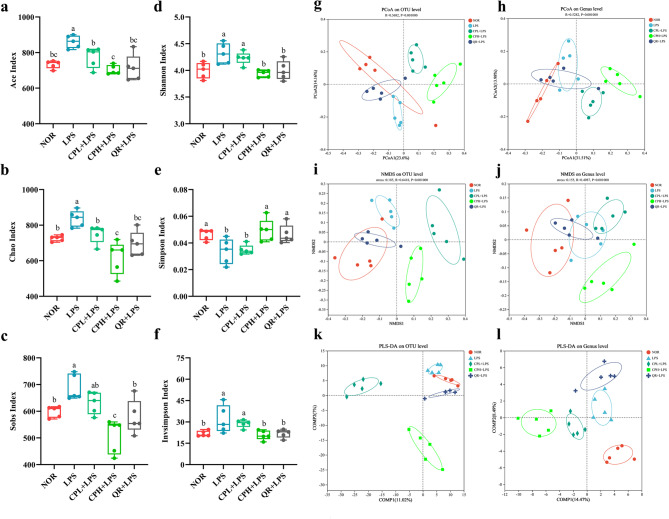
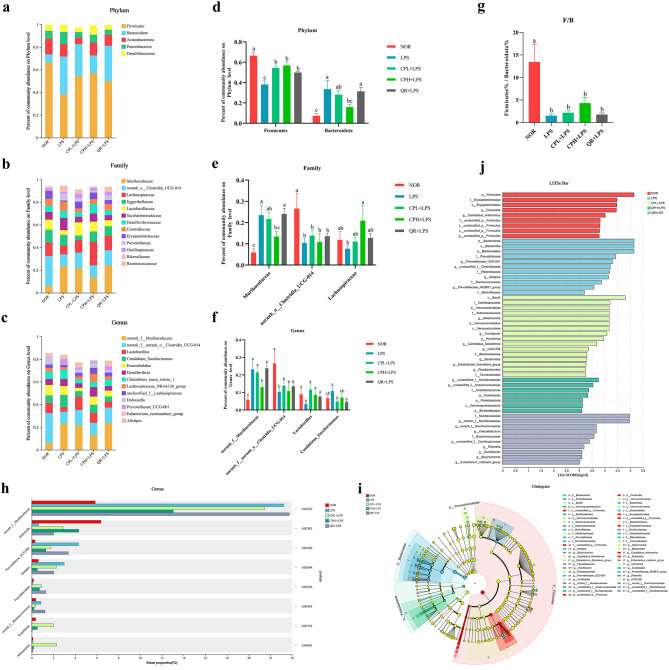
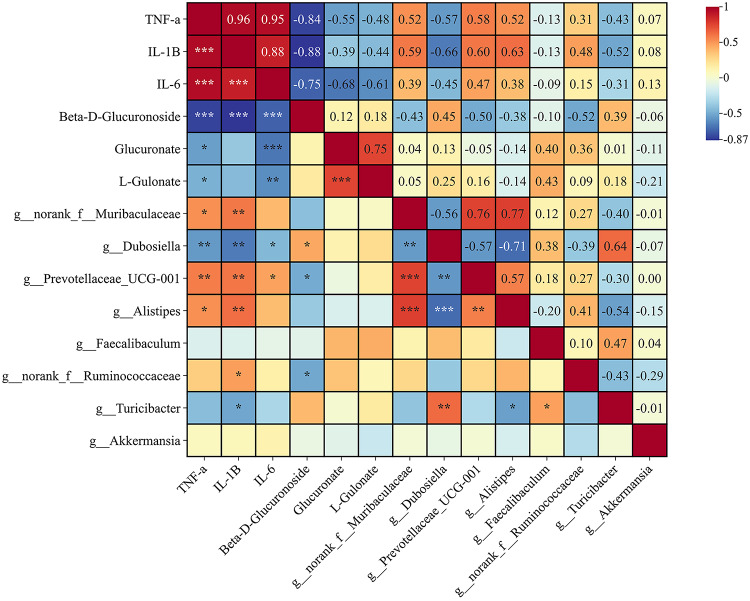
Propolis has significant hepatoprotective effects, but the active components, targets, and mechanisms have not been fully elucidated. Here, we integrated network pharmacology, serum metabolomics, and 16 S rRNA sequencing to disclose the hepatoprotective effects of Chinese propolis (CP) by lipopolysaccharide (LPS)-induced acute liver injury (ALI) in mice. The core active ingredients of CP against ALI, including quercetin, luteolin, and kaempferol, can bind stably to pro-inflammatory factors such as TNF-α, IL-6, IL-1β, and IFN-γ. CP and its active ingredient quercetin obviously alleviated LPS-induced ALI in mice and downregulated the levels of pro-inflammatory genes (Tnf-α, Il-1β, Il-6, Mcp-1, Ifn-γ, and Cox-2) while increasing the protein expression levels of the antioxidant factors Nrf2 and HO-1. Untargeted serum metabolomics analysis indicated that CP and quercetin ameliorated LPS-induced metabolic disorders mainly by modulating the ascorbate and aldarate metabolisms. 16 S rRNA sequencing demonstrated that CP and quercetin modulated the gut microbiota, augmenting the relative abundance of anti-inflammatory bacteria like Lactobacillus and Dubosiella and diminishing the pro-inflammatory bacteria like Alistipes. Spearman correlation analysis revealed that there existed significant correlations among inflammatory factors, gut microbiota, and differential metabolites of serum after propolis pretreatment. Our research indicated that propolis effectively alleviated pathological damage in LPS-induced ALI mice mainly through partially restoring the ecology of gut flora and metabolic disorders to reduce inflammation.

Keywords: Acute liver injury; Chinese propolis; Gut flora; Metabolomics; Network Pharmacology; Quercetin.


Conflict of interest statement

Declarations. Competing interests: The authors declare no competing interests. Ethics approval: All animal experiments followed the Chinese Guidelines for the Care and Use of Laboratory Animals, which were approved by Liaocheng University’s Special Committee on Scientific Research Ethics (2023103106), and we confirm the study is reported in accordance with ARRIVE guidelines. Conflict of interest: The authors declare that there are no conflicts of interest.

Figures

Fig. 1
Fig. 1
Construction of the PPI network and GO and KEGG analyses of the common targets. (a) UPLC-MS/MS analysis on CP. (b) The Venn diagram of the overlapping targets of the active components between CP and ALI. The red circle represents the target of the active components of CP, and the blue circle signifies ALI’s targets. (c) The PPI network and the visualization of the top 30 hub genes of CP in the treatment of ALI. The orange nodes represent the potential therapeutic targets of the active components of CP against ALI. (d) GO enrichment analysis bar with color gradients. (e) Bubble plots for KEGG pathway enrichment analysis.
Fig. 2
Fig. 2
Screening of the top three core components and results of molecular docking. (a) The network of CP-key components-common targets-major pathways-ALI. The red circle is CP, the blue rectangles are the 119 key components, the orange rhombuses are the 342 key targets, the purple hexagons are the KEGG numbers of the 20 major pathways, and the green triangle is ALI. (b) Heatmap of the affinity value. The darker color represents lower binding energy for the core component and hub gene, signifying a more stable binding conformation. (c-n) The visualization of molecular docking. Blue molecules for quercetin, yellow molecules for luteolin, and purple molecules for kaempferol. Hydrogen bonds are depicted by blue dashed lines, hydrophobic interactions by grey dashed lines, π-stacking (P-type) interactions by light-green dashed lines, π-stacking (T-type) interactions by dark-green dashed lines, and π-cation interactions by orange dashed lines. (c) TNF-Quercetin. (d) TNF-Luteolin. (e) TNF-Kaempferol. (f) IL-6-Quercetin. (g) IL-6-Luteolin. (h) IL-6-Kaempferol. (i) IL-1β-Quercetin. (j) IL-1β-Luteolin. (k) IL-1β-Kaempferol. (l) IFN-γ-Quercetin. (m) IFN-γ-Luteolin. (n) IFN-γ-Kaempferol.
Fig. 3
Fig. 3
CP and quercetin treatments alleviated LPS-induced ALI in mice. (a) Establishment of a mouse model with LPS-induced ALI. (b) Body weight changes of mice in various groups during gavage. (c) Spleen weight-to-body weight ratio. (d) Kidney weight-to-body weight ratio. (e) H&E staining of mouse liver tissue. Blue arrows point to eosinophils. (f-k) Tnf-α, Il-1β, Il-6, Mcp-1, Ifn-γ, and Cox-2 mRNA expression levels in liver tissues. Serum (l) TNF-α, (m) IL-1β, and (n) IL-6 levels were determined by ELISA. All data are expressed as mean ± SEM, n = 3 (f-k), 5 (l-n), or 8 (b-d) per group. Different superscript letters denoting significant differences (P < 0.05). (NOR: normal group, LPS: model group, CPL + LPS: low-dose propolis treated group, CPH + LPS: high-dose propolis treated group, QR + LPS: quercetin treated group).
Fig. 4
Fig. 4
Modulation of CP and quercetin treatment on serum metabolism in mice with LPS-induced ALI. PCA score plots in negative (a) and positive (b) ion modes. OPLS-DA score plot in negative (c) and positive (d) ion modes. Permutation analysis of the corresponding OPLS-DA models in both negative (e) and positive (f) ion modes. R represents the explained variance, while Q indicates the predictive capability of the model. Cluster heatmap analysis of serum metabolites in negative (g) and positive (h) ion modes. Volcano plots depict serum metabolites of the normal and LPS groups in both negative (i) and positive (j) ion modes, the CPL and LPS groups in negative (k) and positive (l) ion modes, the CPH and LPS groups in negative (m) and positive (n) ion modes, and the quercetin and LPS groups in negative (o) and positive (p) ion modes. Blue for metabolites downregulated, red for metabolites upregulated. (NOR, N: normal group, LPS, L: model group, CPL + LPS, CL: low-dose propolis treated group, CPH + LPS, CH: high-dose propolis treated group, QR + LPS, Q: quercetin treated group).
Fig. 5
Fig. 5
Effect of CP and quercetin treatment on serum metabolic pathways in mice with LPS-induced ALI. KEGG metabolic pathway enrichment analysis of serum differential metabolites for groups in negative (a) and positive (b) ion mode. Each circle’s size and color were determined by the pathway impact value and p-value, respectively. (c) Effect of CP and quercetin treatment on ascorbate and aldarate metabolism in ALI mice. Comparison of (d) β-D-glucuronoside, (e) glucuronate, and (f) L-gulonate for different groups in ascorbate and aldarate metabolism. Data for (d-f) were expressed as mean ± SEM, n = 5 per group. Different superscript letters denoting significant differences (P < 0.05). (NOR: normal group, LPS: model group, CPL + LPS: low-dose propolis treated group, CPH + LPS: high-dose propolis treated group, QR + LPS: quercetin treated group).
Fig. 6
Fig. 6
Effects of CP and quercetin on the diversity of gut microbiota in ALI mice (n = 5). The alpha diversity analysis of the gut microbiota in cecal contents, including (a) Ace, (b) Chao, (c) Sobs, (d) Shannon, (e) Simpson, and (f) Insimpson index changes in different groups. PCoA plot on (g) OTU level and (h) genus level. NMDS plot on (i) OTU level and (J) genus level. PLS-DA plot on (k) OTU level and (l) genus level. Data for (a-f) are expressed as mean ± SEM. Different superscript letters denoting significant differences (P < 0.05). (NOR: normal group, LPS: model group, CPL + LPS: low-dose propolis treated group, CPH + LPS: high-dose propolis treated group, QR + LPS: quercetin treated group).
Fig. 7
Fig. 7
Relative abundance and differential analysis of gut microbiota in groups. Relative abundances of the gut microbiota at the (a) phylum, (b) family, and (c) genus level. (d-f) The two most abundant phyla, the three most abundant families, and the four most abundant genera were analyzed separately. (g) Ratio of relative abundance of Firmicutes and Bacteroidetes (F/B). (h) The top 8 differential gut microbiota at the genus level (*P < 0.05, Kruskal-Wallis sum-rank test). (i, j) LEfSe analysis revealed gut microbiota biomarkers in groups, with LDA > 3. Data for (D-G) are expressed as mean ± SEM, n = 5 per group. Different superscript letters denoting significant differences (P < 0.05). (NOR: normal group, LPS: model group, CPL + LPS: low-dose propolis treated group, CPH + LPS: high-dose propolis treated group, QR + LPS: quercetin treated group).
Fig. 8
Fig. 8
Spearman correlation analysis of inflammation-related cytokines, differential metabolites of ascorbate and aldarate metabolism, and the top 8 differential gut microbiota. In the visualization, red signifies positive correlations, while blue indicates negative correlations. The intensity of the color reflects the strength of the correlation, with numerical values representing Spearman correlation coefficients.

Similar articles

References

    1. Sforcin, J. M. Biological properties and therapeutic applications of propolis. Phytother Res.30 (6), 894–905. 10.1002/ptr.5605 (2016). - PubMed
    1. Vasques, F., Cavazza, A. & Bernal, W. Acute liver failure. Curr. Opin. Crit. Care. 28 (2), 198–207. 10.1097/mcc.0000000000000923 (2022). - PubMed
    1. Milosevic, I. et al. Gut-liver axis, gut microbiota, and its modulation in the management of liver diseases: a review of the literature. Int. J. Mol. Sci.20 (2). 10.3390/ijms20020395 (2019). - PMC - PubMed
    1. Ahmed, O., Robinson, M. W. & O’Farrelly, C. Inflammatory processes in the liver: divergent roles in homeostasis and pathology. Cell. Mol. Immunol.18 (6), 1375–1386. 10.1038/s41423-021-00639-2 (2021). - PMC - PubMed
    1. Yang, Y. M., Kim, S. Y. & Seki, E. Inflammation and liver cancer: molecular mechanisms and therapeutic targets. Semin Liver Dis.39 (1), 26–42. 10.1055/s-0038-1676806 (2019). - PMC - PubMed

MeSH terms