. 2025 May 15;15(1):16882.
doi: 10.1038/s41598-025-01803-8.

Chronic rejection models for vascularized composite tissue allotransplantation

Affiliations

Chronic rejection models for vascularized composite tissue allotransplantation

Daniel T Fisher et al. Sci Rep. .

Abstract

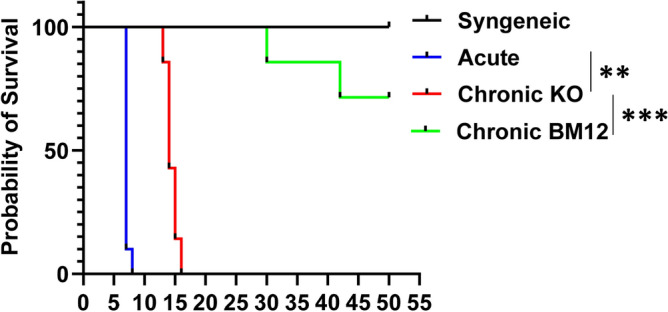
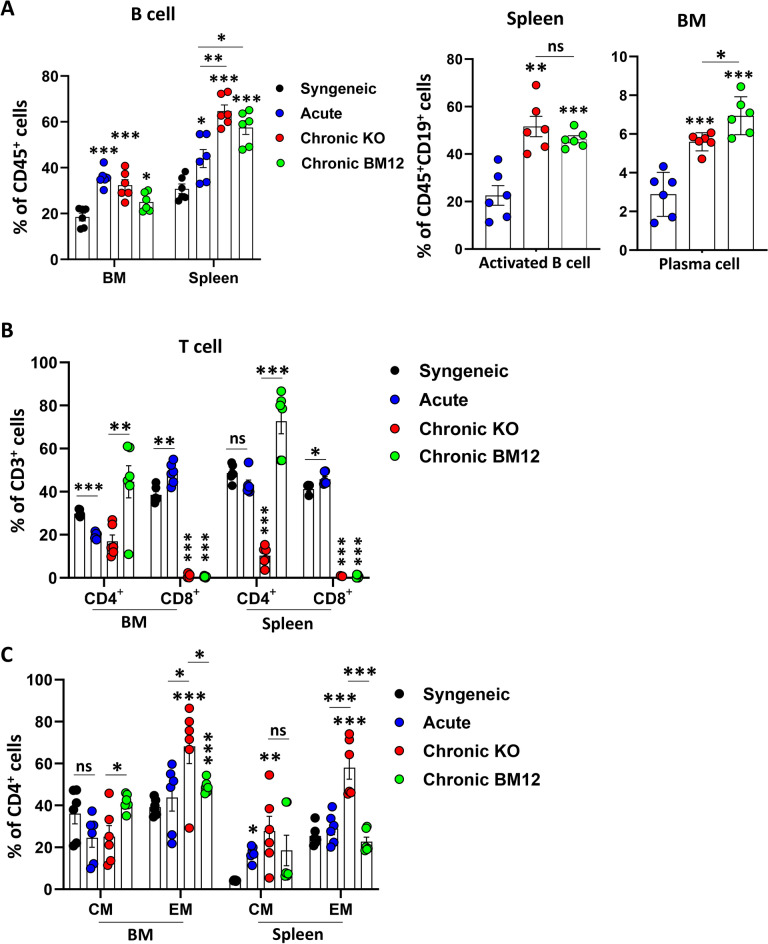
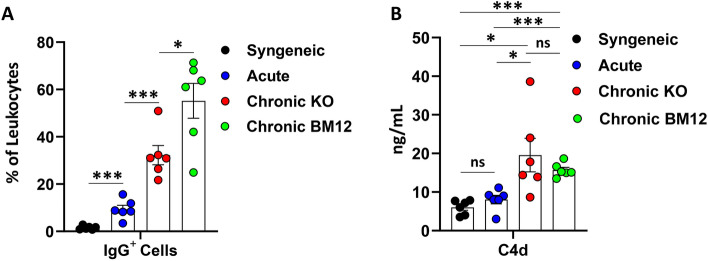
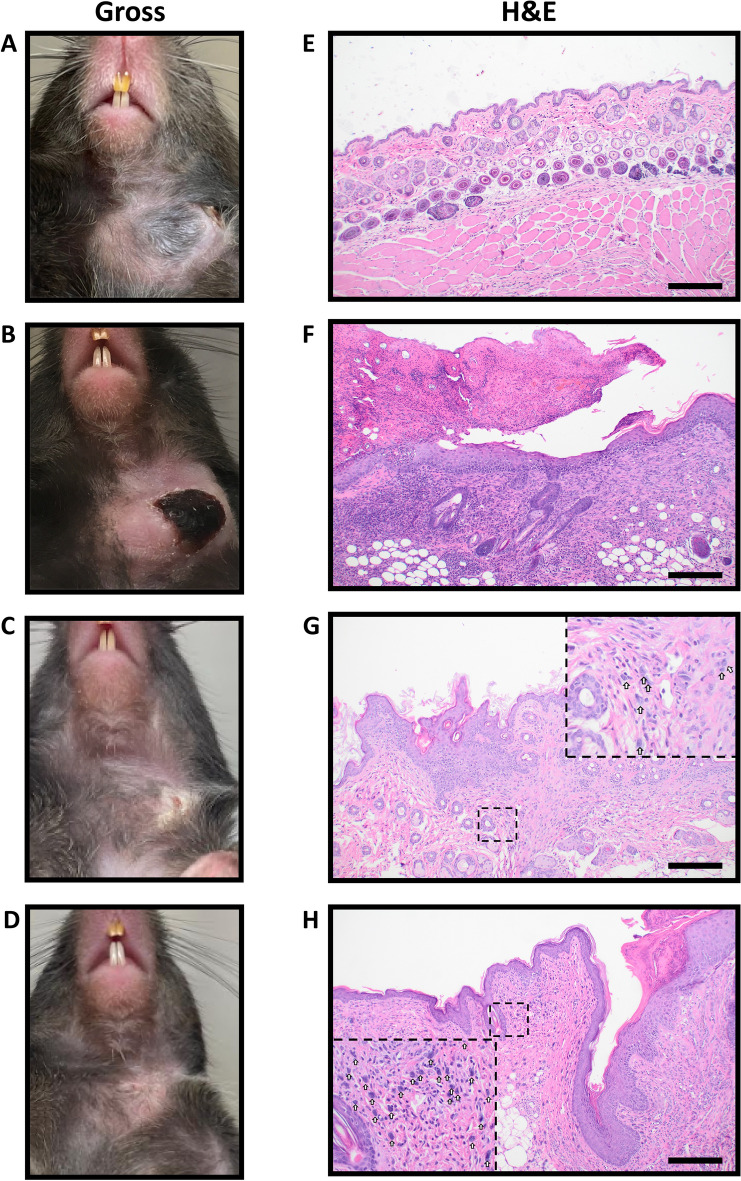
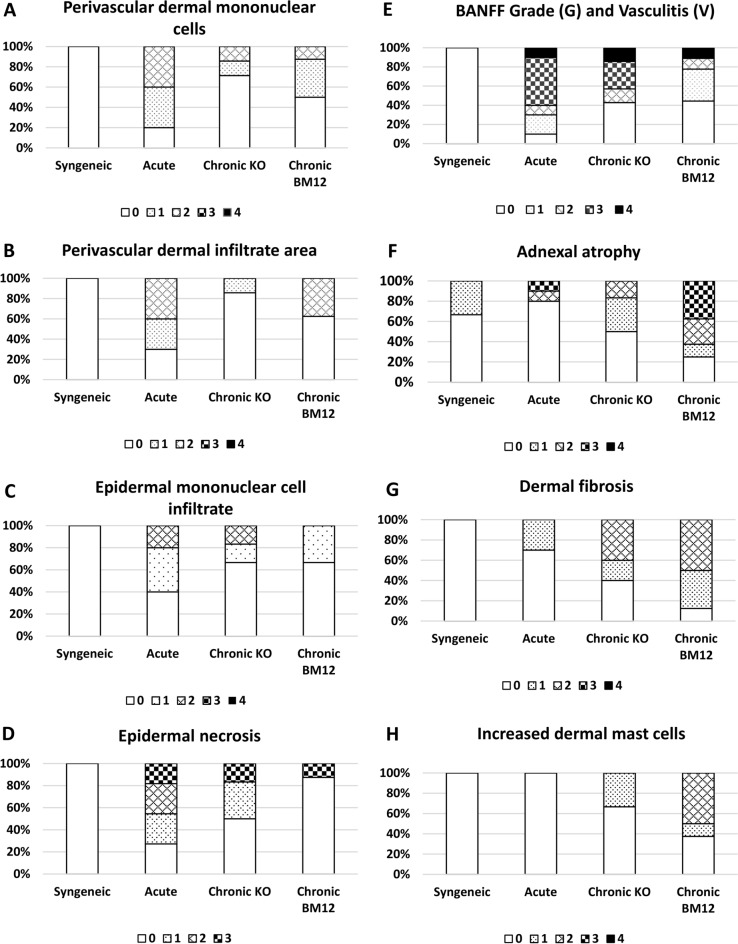
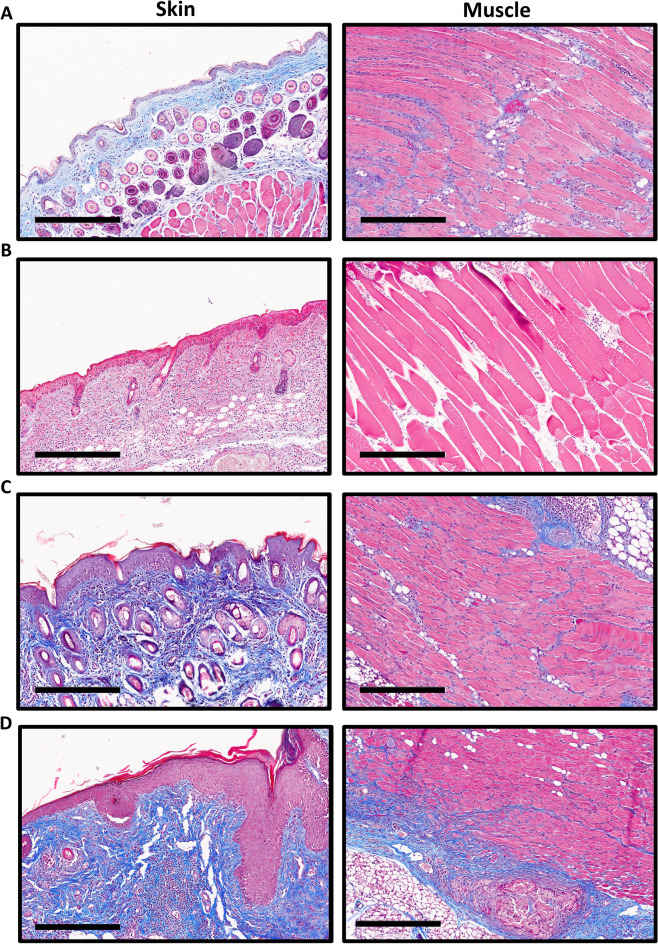
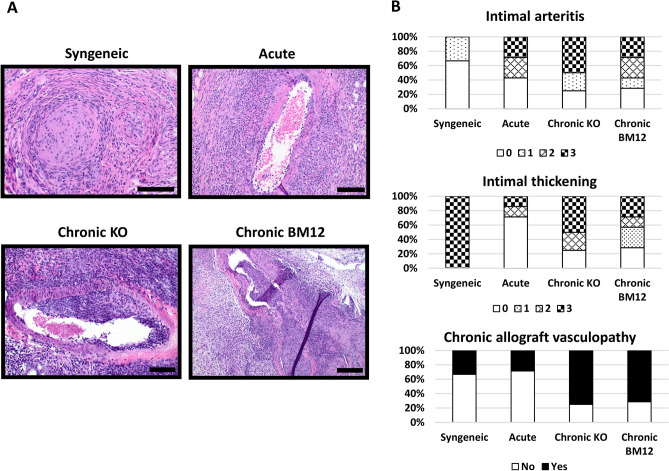
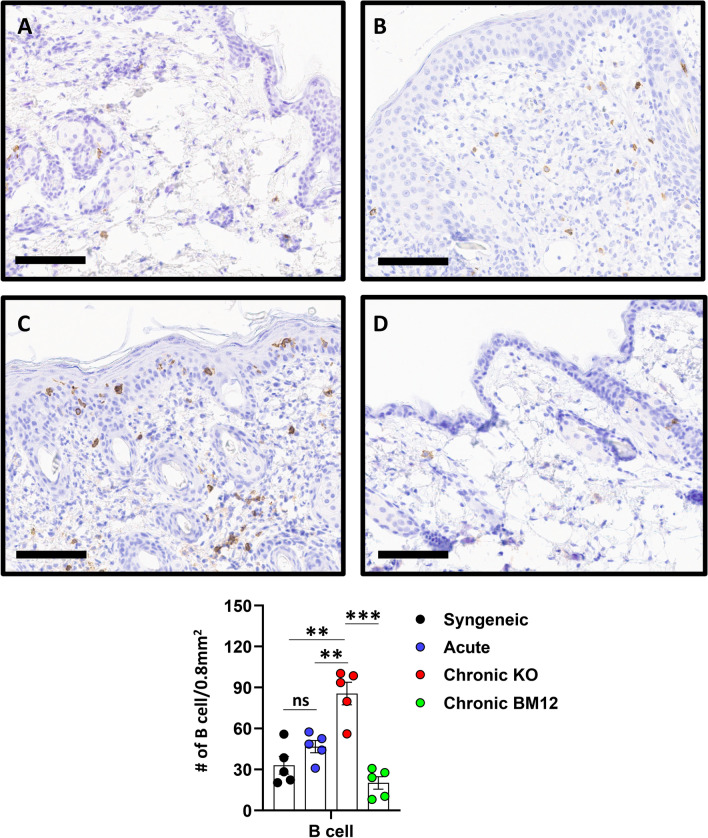
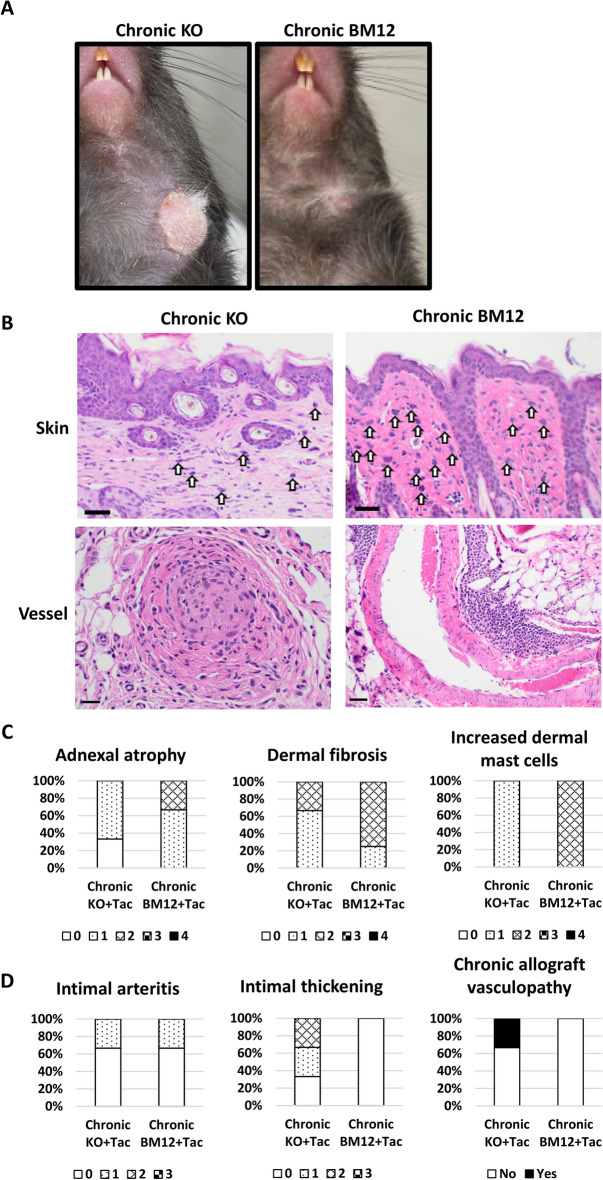
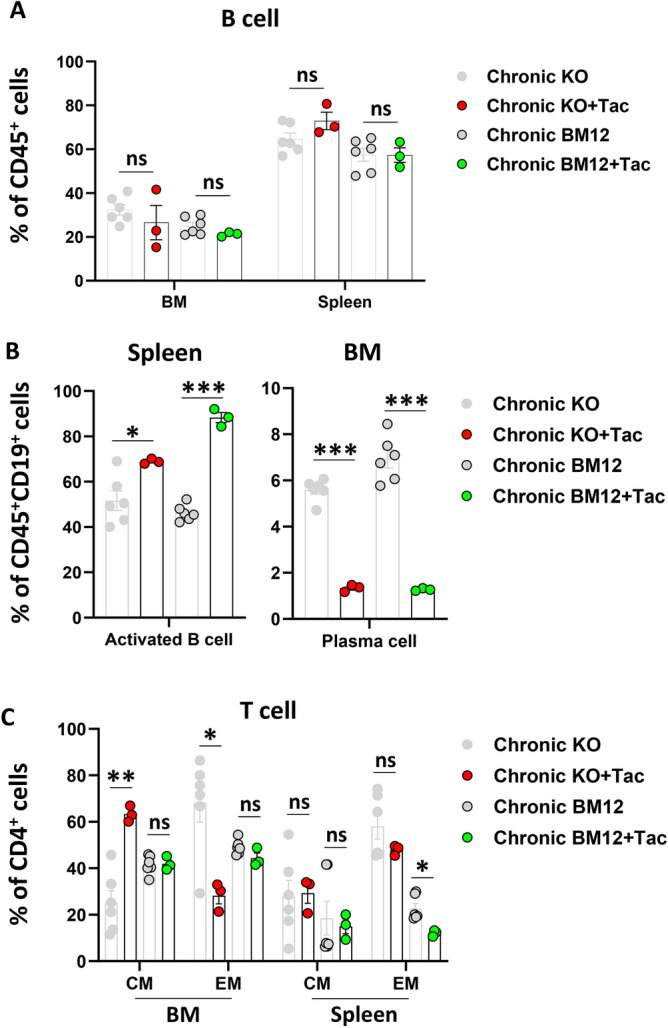
Vascularized composite tissue allotransplantation (VCA) has transformed patients' lives by enabling limb, face, abdominal wall, and penile transplants. Despite advancements in screening and immunosuppression, chronic rejection continues to limit the success of VCA. Lack of reliable preclinical models exacerbates this challenge. Here, we report on new mouse models of chronic rejection following heterotopic hind limb VCA. We employed different levels of MHC mismatch using CD8 knockout C57BL/6 mice as recipients along with BALB/c or B6 H2-Ab1bm12 mice as donors. Transient CD4 T cell depletion was induced to allow graft maturation. Evaluation included gross findings, changes in immune status changes, production of donor-specific antibodies (DSA), C4d levels, and histopathological alterations. Two chronic rejection models displayed common features of clinical chronic graft rejection, such as skin stricture, hair loss, adnexal atrophy, extensive fibrosis and mast cell infiltration without widespread necrotic changes common in acute rejection. Similar to chronic rejection patients, large populations of activated B and plasma cells were detected in the recipient's immune system as well as increased DSA and C4d production. Collectively, our models closely replicate the immunological and histopathological aspects of chronic graft rejection post-VCA, and could provide a new platform for evaluation of novel therapeutic interventions prior to clinical evaluation.


Conflict of interest statement

Declarations. Competing interests: The authors declare no competing interests.

Figures

Fig. 1
Fig. 1
Graft survival curves after vascularized composite tissue allotransplantation (VCA) in the syngeneic, acute, chronic KO, and chronic BM12 rejection models. C57BL/6 mice were used as donors and recipients in the syngeneic model, and BALC/c strain was used as a donor for the acute and chronic KO rejection models with different strains for recipients as C57BL/6 WT and C57BL/6 CD8 KO respectively. In the chronic BM12 model, B6(C)-H2-Ab1bm12 donors were transplanted to C57BL/6 CD8 KO recipients. VCA was performed at Day 0, and the gross finding was assessed every day. The survival of the syngeneic group was significantly prolonged compared to the acute and chronic KO rejection groups (***P < 0.001), and the grafts in the chronic rejection groups showed significantly delayed rejection responses compared to the acute rejection group (chronic KO; **P < 0.01, chronic BM12; **P < 0.001). In addition, the chronic BM12 group showed significant rejection delay compared to the chronic KO group. Pooled data from 3 independent experiments. Syngeneic; n = 5, acute; n = 10, chronic KO; n = 7, and chronic BM12; n = 9., ****P < 0.0001 by Log-rank test with GraphPad Prism.
Fig. 2
Fig. 2
Analysis of immune cell populations after VCA in the context of acute and chronic rejection. Activated B cells, plasma cells, and CD4 effector memory T cells increase significantly in the chronic rejection models. A, The composition of B cell population (CD45+CD3-B220+) was analyzed in the BM and spleen at week 4 for the syngeneic, at week 1 for the acute, at week 2 for the chronic KO, and at week 6 for the chronic BM12 rejection model after VCA. And activated B cell (CD45+CD3-B220+CD19+MHC II+CD138-) and plasma cell (CD45+CD3-B220+CD19+MHC II+CD138+) were analyzed in the spleen and BM respectively. B, The compositions of CD4 and CD8 T cell populations were investigated in the BM and spleen under different settings. C, CD4 T cells were subclassified depending on the status of CD44 and CD62L positivity such as central memory (CM; CD44+CD62L+) and effector memory (EM; CD44+CD62L-) in the BM and spleen. Pooled data from 3 independent experiments. n = 6, ns; not significant, *P < 0.05, **P < 0.01, ***P < 0.001 by Student’s t test, error bar; standard error of the mean.
Fig. 3
Fig. 3
Increases in the levels of donor specific antigen (DSA) and C4 d in the systemic circulation of chronic rejection model recipients. A, A rapid ex-vivo incubation was performed between a donor’s (BALB/c or C57BL/6 backgrounds) lymphocytes and a recipient’s plasma. The plasma was collected after 4 weeks for the syngeneic, 1 week for acute, 2 weeks for chronic KO, and 6 weeks for chronic BM12 rejection groups after VCA. After 1 h incubation at 37 °C, Ig G+ cells on lymphocytes were analyzed by flow cytometry. n = 6, ***P < 0.001 by Student’s t test, error bar; standard error of the mean. B, C4 d levels were measured by ELISA using recipients’ plasma. Representative data from 3 independent experiments. n = 6, ns; not significant, *P < 0.05 by Student’s t test, error bar; standard error of the mean.
Fig. 4
Fig. 4
Representative gross and histologic changes in mice after VCA. A, Gross image of a syngeneic recipient’s graft 4 weeks after VCA. B, Gross image of an acutely rejected recipient’s graft 1 week after VCA. C, Gross image of a chronic KO rejected recipient’s graft 2 weeks after VCA. D, Gross image of a chronic BM12 rejected recipient’s graft 6 weeks after VCA. E, H&E-stained image of a skin section from syngeneic recipient 4 weeks after VCA. Scale bar; 100 µm. F, H&E-stained image of a skin section from acute rejection recipient 1 week after VCA. Scale bar; 100 µm. G, H&E-stained image of a skin section from chronic KO recipient 2 weeks after VCA. Scale bar; 100 µm. H, H&E-stained image of a skin section from chronic BM12 recipient 6 weeks after VCA. Arrows; mast cell, scale bar; 100 µm.
Fig. 5
Fig. 5
Histopathological scores of the transplanted grafts. A. Stacked column graph of perivascular mononuclear cell infiltration in the superficial and deep dermis (0; < 10cells/vessel, 1; 10–25 cells/vessel, 2; 26–50 cells/vessel, 3; > 50cells/vessel). B, Stacked column graph of perivascular mononuclear cell dermal infiltrate area expressed as percent area occupied by the most involved dermal vessels at 40 × (0; < 25%, 1; 25–50%, 2; 50–75%, 3; > 75%). C, Stacked column graph of mononuclear cell infiltrate into epidermis (0; < 10 cells per 4, 20 × fields, 1; 10–20 cells per 4, 20 × fields, 2; > 20 cells per 4, 20 × fields, and 3; transdermal infiltrate). D, Stacked column graph of epidermal necrosis as presence of keratinocyte apoptosis and necrosis (0; none, 1; apoptosis, 2; focal necrosis, 3; sloughed). E, Stacked column graph of BANFF rejection scores. F, G, and H, Stacked column graph of adnexal atrophy, dermal fibrosis, and mast cell counts in the dermis, respectively (0; none, 1; minimal, 2; mild, 3; moderate, 4; severe). Pooled data from 3 independent experiments. Syngeneic; n = 3, acute; n = 10, chronic KO; n = 7, and chronic BM12; n = 9.
Fig. 6
Fig. 6
Representative findings of trichrome stain in the skin and muscle after VCA. A, Syngeneic graft. B, Acute rejection graft. C, Chronic KO rejection graft. D, Chronic BM12 rejection graft. Scale bar; 300 µm.
Fig. 7
Fig. 7
Evaluation of chronic allograft vasculopathy (CAV). CAV was defined as the simultaneous occurrence of intimal thickening and endarteritis. A, H&E-stained image of arteries from different rejection models. Scale bar; 100 µm in syngeneic, acute, and chronic KO images, 200 µm in the chronic BM12 image. B, Stacked column graphs of intimal arteritis (mononuclear cells underneath arterial endothelium; 0; none, 1; < 25%, 2; > 25%, 3; transmural involvement, intimal thickening (0; none, 1; < 25%, 2; 25–50%, 3; > 50%), and CAV. Pooled data from 3 independent experiments. Syngeneic; n = 3, acute; n = 7, chronic KO; n = 4, and chronic BM12; n = 7.
Fig. 8
Fig. 8
Increased B cell infiltration in the grafts undergoing chronic rejection. Immunohistochemistry was performed with B220 antibody with grafts 4, 1, 2, and 6 weeks after VCA for the syngeneic, acute, chronic KO, and chronic BM12 rejection groups respectively. Positive cells with the antibody were counted by Image J program. Scale bar; 100 µm. Pooled data from 3 independent experiments. Over 4 fields from n = 5/group, ns; not significant, **P < 0.01 by Student’s t test, error bar; standard error of the mean.
Fig. 9
Fig. 9
Chronic rejection features following VCA under conventional immunosuppression. A, Representative gross findings 2 weeks and 6 weeks after chronic KO and BM12 VCA respectively. B, H&E-stained images of skin and vessels from chronic rejection models after using low-dose of tacrolimus. Scale bar; 20 µm, arrows; mast cell. C, Histopathological scores of the transplanted grafts. Stacked column graph of adnexal atrophy, dermal fibrosis, and mast cell counts in the dermis, respectively (0; none, 1; minimal, 2; mild, 3; moderate, 4; severe). D, Stacked column graphs of intimal arteritis (mononuclear cells underneath arterial endothelium; 0; none, 1; < 25%, 2; > 25%, 3; transmural involvement, intimal thickening (0; none, 1; < 25%, 2; 25–50%, 3; > 50%), and CAV. Data represent one independent experiment, n = 3 per group. Tac; low-dose tacrolimus.
Fig. 10
Fig. 10
Chronic rejection immune responses with low-dose of tacrolimus usage after VCA. Flow cytometric analysis of immune cell populations following VCA under low-dose tacrolimus. A, The composition of B cell population (CD45+CD3-B220+) was analyzed in the BM and spleen at week 2 for the chronic KO, and at week 6 for the chronic BM12 rejection model after VCA. And activated B cell (CD45+CD3-B220+CD19+MHC II+CD138-) and plasma cell (CD45+CD3-B220+CD19+MHC II+CD138+) were analyzed in the spleen and BM respectively. B, The compositions of CD4 and CD8 T cell populations were investigated in the BM and spleen under different settings. C, CD4 T cells were subclassified depending on the status of CD44 and CD62L positivity such as central memory (CM; CD44+CD62L+) and effector memory (EM; CD44+CD62L-) in the BM and spleen. Comparisons were made between the tacrolimus untreated (gray; data previously shown in Fig. 2) and treated chronic models. Data represent one independent experiment, n = 3 per group, ns; not significant, *P < 0.05, **P < 0.01, and ***P < 0.001 by Student’s t test, error bar; standard error of the mean. Tac; low-dose tacrolimus.

Similar articles

References

    1. Dubernard, J. M., Owen, E. R., Lanzetta, M. & Hakim, N. What is happening with hand transplants. Lancet357, 1711–1712. 10.1016/S0140-6736(00)04846-7 (2001). - PubMed
    1. Petit, F., Minns, A. B., Dubernard, J. M., Hettiaratchy, S. & Lee, W. P. Composite tissue allotransplantation and reconstructive surgery: First clinical applications. Ann. Surg.237, 19–25. 10.1097/01.SLA.0000041228.23111.30 (2003). - PMC - PubMed
    1. Devauchelle, B. et al. First human face allograft: Early report. Lancet368, 203–209. 10.1016/S0140-6736(06)68935-6 (2006). - PubMed
    1. Siemionow, M. & Kulahci, Y. Facial transplantation. Semin. Plast. Surg.21, 259–268. 10.1055/s-2007-991196 (2007). - PMC - PubMed
    1. Kaufman, C. L. et al. Current Status of Vascularized Composite Allotransplantation. Am. Surg.85, 631–637 (2019). - PubMed

LinkOut - more resources