. 2025 May 15;15(1):16838.
doi: 10.1038/s41598-025-01927-x.

Coupling relationship between glucose and oxygen metabolisms to serve as an imaging biomarker for Alzheimer's disease

Affiliations

Coupling relationship between glucose and oxygen metabolisms to serve as an imaging biomarker for Alzheimer's disease

Ze Yang et al. Sci Rep. .

Abstract

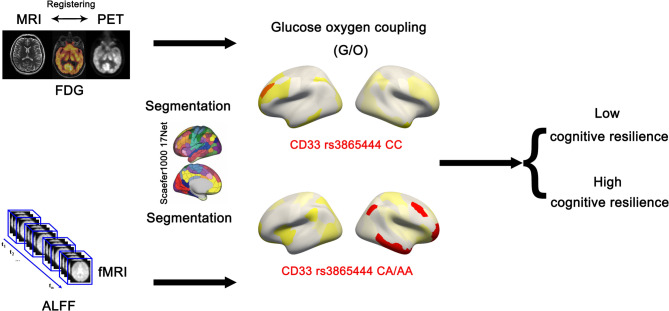
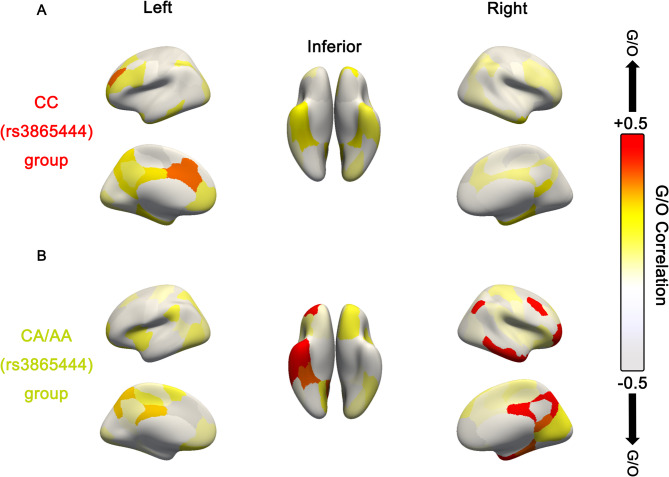
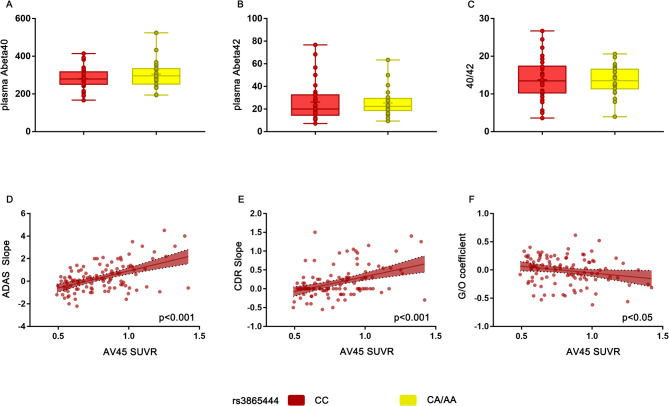
CD33 rs3865444 polymorphism is closely associated with the risk of Alzheimer's disease (AD), and CD33 is part of the sialic acid-binding Ig-superfamily of lectins (SIGLECs). Immunostaining experiments in previous studies have confirmed the expression of CD33 in human brain microglial cells, and an increase in CD33 mRNA expression in the brain microglial cells of patients with cognitive impairment has been observed. The minor allele CD33 rs3865444 (A) has a protective effect against Alzheimer's disease pathology and is associated with reduced CD33 expression and clearance of amyloid-beta plaques. The risk allele CD33 rs3865444 (C) can cause abnormal activation of microglial cells, thereby inducing neuroinflammation, accompanied by an increase in metabolic levels. We hypothesize that the CD33 rs3865444 polymorphism may affect the coupling between glucose metabolism and neuronal activity, thereby influencing individual cognitive trajectories and the progression of cognitive impairment. In this study, we included 107 patients with mild cognitive impairment, among whom the limbic-orbital frontal cortex glucose-oxygen coupling (G/O) coefficient of the CD33 rs3865444 CC group was significantly reduced. Additionally, the results of the mediation analysis showed that the glucose-oxygen coupling coefficient completely mediated the effect of the CD33 rs3865444 polymorphism on the rate of clinical dementia rating increase.

Keywords: CD33 rs3865444; Cognitive trajectory; Functional MRI (fMRI); Glycometabolism; Mild cognitive impairment; Oxygen metabolism.


Conflict of interest statement

Declarations. Competing interests: The authors declare no competing interests. Ethical statement: This study was approved by the institutional review board (IRB) at Hangzhou Dianzi University (IRB-2020001) and the ethics committee at Beijing Hospital (2022BJYYEC-375-01). The Alzheimer’s Disease Neuroimaging Initiative has obtained informed consent from participants as research subjects, with support from the ADNI Executive Committee and representatives of the National Institute on Aging. The study investigators maintain and be responsible for determining how to use the participants’ data for future research. All links related to the participants’ identities have been removed from the data before sharing. Methods were carried out in accordance with relevant guidelines and regulations.

Figures

Fig. 1
Fig. 1
The experimental workflow of this study is illustrated in the figure. First, preprocessing was conducted on images of various modalities. Subsequently, the G/O coefficient for each network was computed based on the Schaefer 2018_1000Parcels_17Networks brain atlas, and differences in cognitive trajectories among groups were compared. Finally, mediation analysis was performed to determine the relationship between CD33 rs3865444, the G/O coefficient, and cognitive trajectories.
Fig. 2
Fig. 2
The impact of CD33 rs3865444 polymorphism on FDG SUVR and ALFF distributions. (A) Distribution of FDG SUVR and ALFF per voxel across the whole brain in the CD33 rs3865444 CC group. (B) Distribution of FDG SUVR and ALFF per voxel across the whole brain in the CD33 rs3865444 CA/AA group. Left: left hemisphere; Right: right hemisphere.
Fig. 3
Fig. 3
The impact of CD33 rs3865444 polymorphism on G/O distributions. (A) The distribution of G/O coefficients for each network across the whole brain in the CD33 rs3865444 CC group. (B) The distribution of G/O coefficients for each network across the whole brain in the CD33 rs3865444 CA/AA group. Left: left hemisphere; Right: right hemisphere.
Fig. 4
Fig. 4
The impact of the CD33 rs3865444 SNP on G/O coefficients, glucose metabolism levels, amyloid pathology, and intergroup differences in G/O coefficients within the spectrum of the aforementioned variables was assessed. (A) The anatomical location of the limbic-orbital frontal cortex in the brain. (B) Box plots illustrate the differences in limbic-orbital frontal cortex G/O between carriers of CD33 rs3865444 CC (n = 59) and carriers of CD33 rs3865444 CA/AA (n = 48). (C) Box plots depict the differences in limbic-orbital frontal cortex FDG SUVR between carriers of CD33 rs3865444 CC (n = 59) and carriers of CD33 rs3865444 CA/AA (n = 48). (D) Box plots illustrate the differences in limbic-orbital frontal cortex ALFF between carriers of CD33 rs3865444 CC (n = 59) and carriers of CD33 rs3865444 CA/AA (n = 48). (E) Box plots display the differences in limbic-orbital frontal cortex AV45 SUVR between carriers of CD33 rs3865444 CC (n = 59) and carriers of CD33 rs3865444 CA/AA (n = 48). (F) Box plots illustrate the differences in limbic-orbital frontal cortex G/O between carriers of CD33 rs3865444 CC (n = 47) and carriers of CD33 rs3865444 CA/AA (n = 40) (amyloid-negative cohort). (G) Box plots depict the differences in limbic-orbital frontal cortex FDG SUVR between carriers of CD33 rs3865444 CC (n = 47) and carriers of CD33 rs3865444 CA/AA (n = 40) (amyloid-negative cohort). (H) Box plots illustrate the differences in limbic-orbital frontal cortex ALFF between carriers of CD33 rs3865444 CC (n = 47) and carriers of CD33 rs3865444 CA/AA (n = 40) (amyloid-negative cohort). (I) Box plots display the differences in limbic-orbital frontal cortex AV45 SUVR between carriers of CD33 rs3865444 CC (n = 47) and carriers of CD33 rs3865444 CA/AA (n = 40) (amyloid-negative cohort). Comparison analysis was conducted using t-tests, with significance levels denoted as: *p < 0.05, **p < 0.01, ***p < 0.001.
Fig. 5
Fig. 5
(A) Box plots depict the differences in plasma Abeta40 between carriers of CD33 rs3865444 CC and carriers of CD33 rs3865444 CA/AA. (B) Box plots depict the differences in plasma Abeta42 between carriers of CD33 rs3865444 CC and carriers of CD33 rs3865444 CA/AA. (C) Box plots depict the differences in Abeta40/Abeta42 between carriers of CD33 rs3865444 CC and carriers of CD33 rs3865444 CA/AA. (D) The association between the AV45 SUVR of the limbic-orbital frontal cortex and the ADAS score growth rate. (E) The association between the AV45 SUVR of the limbic-orbital frontal cortex and the CDR score growth rate. (F) The association between the G/O coefficient of the limbic-orbital frontal cortex and the AV45 SUVR. Correlations in the scatter plot are represented by least squares regression lines, with shaded areas indicating confidence intervals.
Fig. 6
Fig. 6
Differential cognitive decline based on the CD33 rs3865444 SNP. (A) ADAS (higher score is worse) longitudinal analysis. (B) CDR (higher score is worse) longitudinal analysis. (C) ADAS baseline score. (D) CDR baseline score. (E) ADAS (higher score is worse) longitudinal analysis (amyloid-negative cohort). (F) CDR (higher score is worse) longitudinal analysis (amyloid-negative cohort). (G) ADAS baseline score (amyloid-negative cohort). (H) CDR baseline score (amyloid-negative cohort).
Fig. 7
Fig. 7
The G/O coefficient mediates the effect of the CD33 rs3865444 SNP on cognitive trajectories. (A) The box plot shows the difference in ADAS score growth rate between CD33 rs3865444 CC carriers (n = 59) and CD33 rs3865444 CA/AA carriers (n = 48). (B) The association between the G/O coefficient of the limbic-orbital frontal cortex and the ADAS score growth rate. (C) The G/O coefficient of the limbic-orbital frontal cortex mediates the effect of CD33 rs3865444 SNP on the ADAS score growth rate. (D) The box plot shows the difference in ADAS score growth rate between CD33 rs3865444 CC carriers (n = 47) and CD33 rs3865444 CA/AA carriers (n = 40) (amyloid-negative cohort). (E) The association between the G/O coefficient of the limbic-orbital frontal cortex and the ADAS score growth rate (amyloid-negative cohort). (F) The G/O coefficient of the limbic-orbital frontal cortex mediates the effect of CD33 rs3865444 SNP on the ADAS score growth rate (amyloid-negative cohort). Correlations in the scatter plot are represented by least squares regression lines, with shaded areas indicating confidence intervals. Path weights are shown as correlation coefficients, where *p < 0.05, **p < 0.01, and ***p < 0.001. The significance of the mediating effect was determined through bootstrapping with 10,000 iterations. c represents the direct association between CD33 rs3865444 SNP and ADAS score growth rate, while c’ represents the correlation after introducing the mediating variable.

Similar articles

References

    1. Walsh, D. M. et al. Naturally secreted oligomers of amyloid Β protein potently inhibit hippocampal long-term potentiation in vivo. Nature. 416, 535–539 (2002). - PubMed
    1. Cirrito, J. R. et al. Synaptic activity regulates interstitial fluid amyloid-β levels in vivo. Neuron. 48, 913–922 (2005). - PubMed
    1. Wang, J-Z. & Liu, F. Microtubule-associated protein Tau in development, degeneration and protection of neurons. Prog. Neurobiol.85, 148–175 (2008). - PubMed
    1. Edison, P. et al. Microglia, amyloid, and cognition in Alzheimer’s disease: an [11 C](R) PK11195-PET and [11 C] PIB-PET study. Neurobiol. Dis.32, 412–419 (2008). - PubMed
    1. Solito, E. & Sastre, M. Microglia function in Alzheimer’s disease. Front. Pharmacol.3, 14 (2012). - PMC - PubMed

MeSH terms

LinkOut - more resources