. 2025 May 15;15(1):16930.
doi: 10.1038/s41598-025-98924-x.

Effects of different anesthetic drugs on electroretinography in mice

Affiliations

Effects of different anesthetic drugs on electroretinography in mice

Chaofeng Yu et al. Sci Rep. .

Abstract

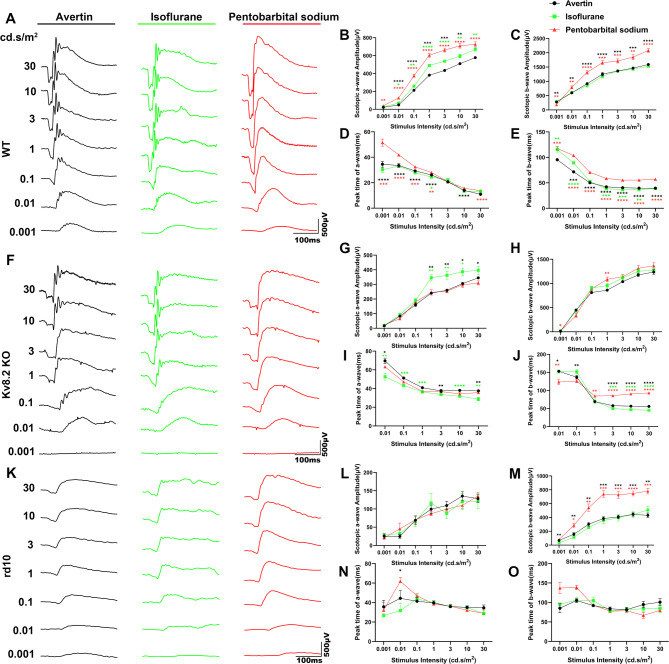
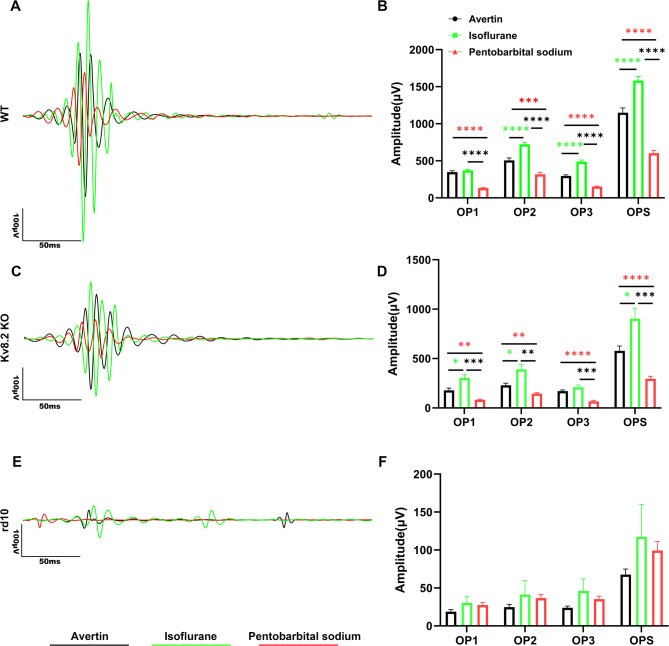
Electrophysiology (ERG) is widely used for retinal function assessment, but the effects of different anesthetics on ERG recordings, particularly in degenerated retinas, remain unclear. This study investigated the effects of different anesthetic drugs on ERG in wild-type (WT), Kv8.2 knockout (KO), and rd10 mice. Anesthetic drugs, avertin (300 mg/kg) and pentobarbital sodium (50 mg/kg) were administered intraperitoneally, isoflurane was given at 5% for induction and 1.5% for maintenance. Full-field flash electroretinography (ff-ERG) was recorded, including scotopic and photopic responses. Specifically, the amplitudes of a-wave, b-wave, oscillatory potentials (OPs), photopic negative response (PhNR), and c-wave were analyzed, respectively. Additionally, fundus imaging and optical coherence tomography (OCT) were performed to analyze retinal morphology. The three anesthetics had no obvious effect on retinal morphology. Pentobarbital sodium decreased scotopic OPs, increased scotopic and photopic b-wave amplitudes and decreased photopic a-wave amplitude in all groups of mice. Isoflurane resulted in larger scotopic OPs and photopic a-wave amplitudes in all groups, with a larger scotopic a-wave amplitude in KO mice. The PhNR amplitude was greater in WT mice anesthetized with avertin. The ERG amplitudes in mice showed significant differences among the three anesthetic conditions. Pentobarbital sodium markedly suppressed retinal OPs, suggesting it may not be suitable for assessing inner retinal function, particularly amacrine cells. Isoflurane enabled excellent recordings of various types of ERG, making it suitable for nearly all ERG recordings. Avertin might serve as a suitable alternative in the absence of isoflurane.

Keywords: Avertin; ERG; Isoflurane; Kv8.2 KO; Pentobarbital sodium; rd10.


Conflict of interest statement

Declarations. Competing interests: The authors declare no competing interests.

Figures

Fig. 1
Fig. 1
Fundus images and OCT. (A) The left and right columns displayed fundus images and OCT of WT mice, respectively. The center column showed the optic nerve position in the process of OCT acquisition. (B) ONL and retina thickness measurement in WT mice. (C) Fundus images and OCT of Kv8.2 KO mice. (D) ONL and retina thickness measurement in Kv8.2 KO mice. E, Fundus images and OCT of rd10 mice. F, ONL and retina thickness measurement in rd10 mice. OCT images, the left side corresponding to the lower visual field. OCT optical coherence tomography; WT wild-type; KO knockout; ILM inner limiting membrane; NFL nerve fiber layer; GCL ganglion cell layer; IPL inner plexiform layer; INL inner nuclear layer; OPL outer plexiform layer; ONL outer nuclear layer; OLM outer limiting membrane; IS inner segments; OS outer segments; IS/OS, inner segment/outer segment complex; ROST rod outer segment tips; RPE, retinal pigmented epithelium.
Fig. 2
Fig. 2
Scotopic ERG in mice. (A, F, K) Representative waveforms of scotopic responses at different stimulus intensities in WT, Kv8.2 KO, and rd10 mice, respectively. (B, G, L) Quantification of the amplitude of scotopic a-waves in different mice. (C, H, M) Quantification of the amplitude of scotopic b-waves in different mice. (D, E, I, J, N, O) Quantification of the peak time of scotopic a-waves and b-waves in different mice, respectively. Black: Avertin group, Green: Isoflurane group, Red: Pentobarbital sodium group. Results are presented as mean ± SE; WT, n = 9–11 animals (17–22 eyes per group); KO, n = 6–9 animals (11–18 eyes per group); rd10, n = 4–5 animals (8–10 eyes per group); *p < 0.05, **p < 0.01, ***p < 0.001, ****p < 0.0001; *p (Red) represents comparisons between avertin and pentobarbital sodium groups; *p (Green), isoflurane and avertin groups; *p (Black), pentobarbital sodium and isoflurane groups.
Fig. 3
Fig. 3
Scotopic OPs in mice. (A, C, E) Representative waveforms of scotopic OPs at a stimulus intensity of 3 cd s/m2 in WT, Kv8.2 KO, and rd10 mice, respectively. (B, D, F) Quantification of the amplitude of scotopic OPs in different mice. Black: Avertin group, Green: Isoflurane group, Red: Pentobarbital sodium group. Results are presented as mean ± SE; WT, n = 9–11 animals (17–22 eyes per group); KO, n = 6–9 animals (11–18 eyes per group); rd10, n = 3–6 animals (4–12 eyes per group). *p < 0.05, **p < 0.01, ***p < 0.001, ****p < 0.0001.
Fig. 4
Fig. 4
Scotopic c-waves in mice. (A, C, E) Representative waveforms of c-waves were recorded at a stimulus intensity of 150 cd/m2 in WT, KO, and rd10 mice, respectively. (B, D, F) Quantification of the amplitude of c-waves in different mice. Black: Avertin group, Green: Isoflurane group, Red: Pentobarbital sodium group. Results are presented as mean ± SE; WT, n = 9–11 animals (17–22 eyes per group); KO, n = 6–9 animals (11–18 eyes per group); rd10, n = 3–6 animals (4–12 eyes per group). *p < 0.05, **p < 0.01, ***p < 0.001, ****p < 0.0001.
Fig. 5
Fig. 5
Photopic ERG in mice. (A, F, K) Representative waveforms of photopic responses in WT, Kv8.2 KO, and rd10 mice, respectively. (B, G, L) Quantification of the amplitude of photopic a-waves in different mice. (C, H, M) Quantification of the amplitude of photopic b-waves in different mice. (D, E, I, J, N, O) Quantification of the peak time of photopic a-waves and b-waves in different mice, respectively. Black: Avertin group, Green: Isoflurane group, Red: Pentobarbital sodium group. Results are presented as mean ± SE; WT, n = 9–11 animals (17–22 eyes per group); KO, n = 6–9 animals (11–17 eyes per group); rd10, n = 4–6 animals (8–11 eyes per group); *p < 0.05, **p < 0.01, ***p < 0.001, ****p < 0.0001; *p (Red) represents comparisons between avertin and pentobarbital sodium groups; *p (Green), isoflurane and avertin groups; *p (Black), pentobarbital sodium and isoflurane groups.
Fig. 6
Fig. 6
PhNR in Mice. (A, C, E) Representative waveforms of PhNR at a stimulus intensity of 20 cd s/m2 on a green background of 40 cd/m2 in WT, Kv8.2 KO, and rd10 mice, respectively. (B, D, F) Quantification of the amplitude of C-waves in different mice. Black: Avertin group, Green: Isoflurane group, Red: Pentobarbital sodium group. Results are presented as mean ± SE; WT, n = 9–11 animals (17–22 eyes per group); KO, n = 6–9 animals (11–17 eyes per group); rd10, n = 4–5 animals (4–9 eyes per group). *p < 0.05, **p < 0.01, ***p < 0.001, ****p < 0.0001.

Similar articles

References

    1. Robson, A. G. et al. ISCEV Standard for full-field clinical electroretinography (2022 update). Doc. Ophthalmol.144, 165–177 (2022). - PMC - PubMed
    1. Tonade, D. & Kern, T. S. Photoreceptor cells and RPE contribute to the development of diabetic retinopathy. Prog. Retin. Eye Res.83, 100919 (2021). - PMC - PubMed
    1. Wang, Y., Punzo, C., Ash, J. D. & Lobanova, E. S. Tsc2 knockout counteracts ubiquitin-proteasome system insufficiency and delays photoreceptor loss in retinitis pigmentosa. Proc. Natl. Acad. Sci. U. S. A.119, e2118479119 (2022). - PMC - PubMed
    1. Wang, S. et al. CXCL1-CXCR2 signalling mediates hypertensive retinopathy by inducing macrophage infiltration. Redox Biol.56, 102438 (2022). - PMC - PubMed
    1. Okimura, K., Nakane, Y., Nishiwaki-Ohkawa, T. & Yoshimura, T. Photoperiodic regulation of dopamine signaling regulates seasonal changes in retinal photosensitivity in mice. Sci. Rep.11, 1843 (2021). - PMC - PubMed

LinkOut - more resources