. 2025 May 15;16(1):774.
doi: 10.1007/s12672-025-02617-w.

Deciphering the role of acetylation-related gene NAT10 in colon cancer progression and immune evasion: implications for overcoming drug resistance

Affiliations

Deciphering the role of acetylation-related gene NAT10 in colon cancer progression and immune evasion: implications for overcoming drug resistance

Xuancheng Zhou et al. Discov Oncol. .

Abstract

Background: Colon cancer (CC) is one of the most common and lethal cancers worldwide, with rising incidence rates in both developed and developing countries. Although advances in treatments such as surgery, chemotherapy, and targeted therapies have been made, prognosis for advanced colon cancer, particularly with metastasis, remains poor. Recent studies highlight the significant role of post-transcriptional modifications like acetylation in cancer biology, affecting processes like gene transcription, metabolism, and tumor progression.

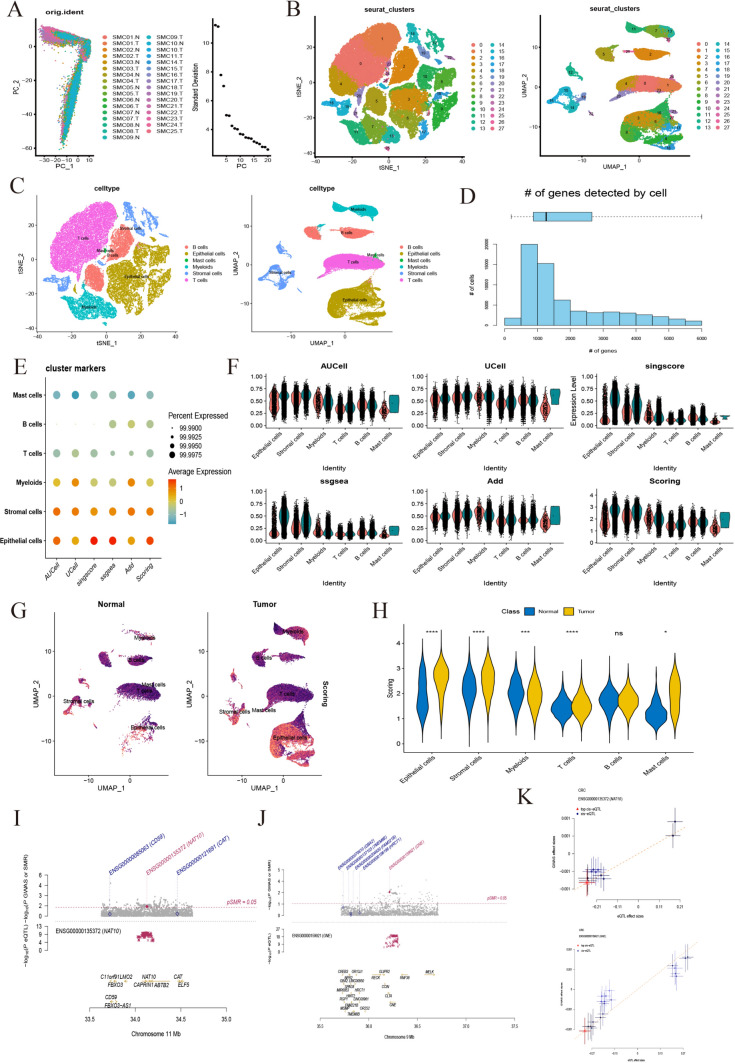
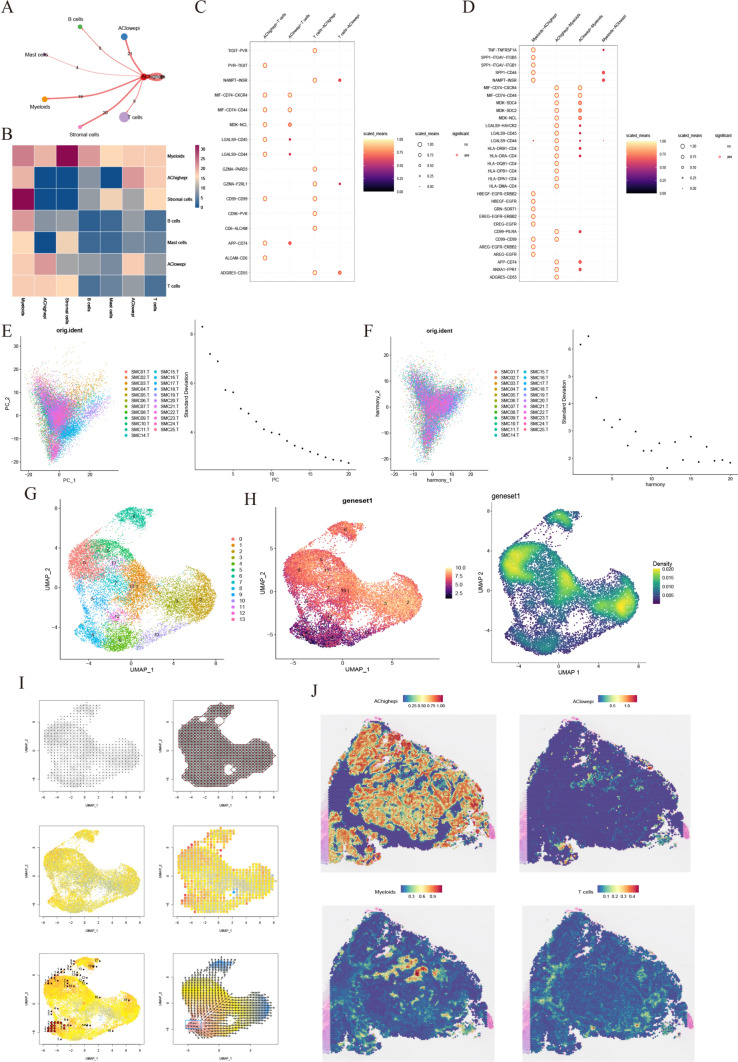
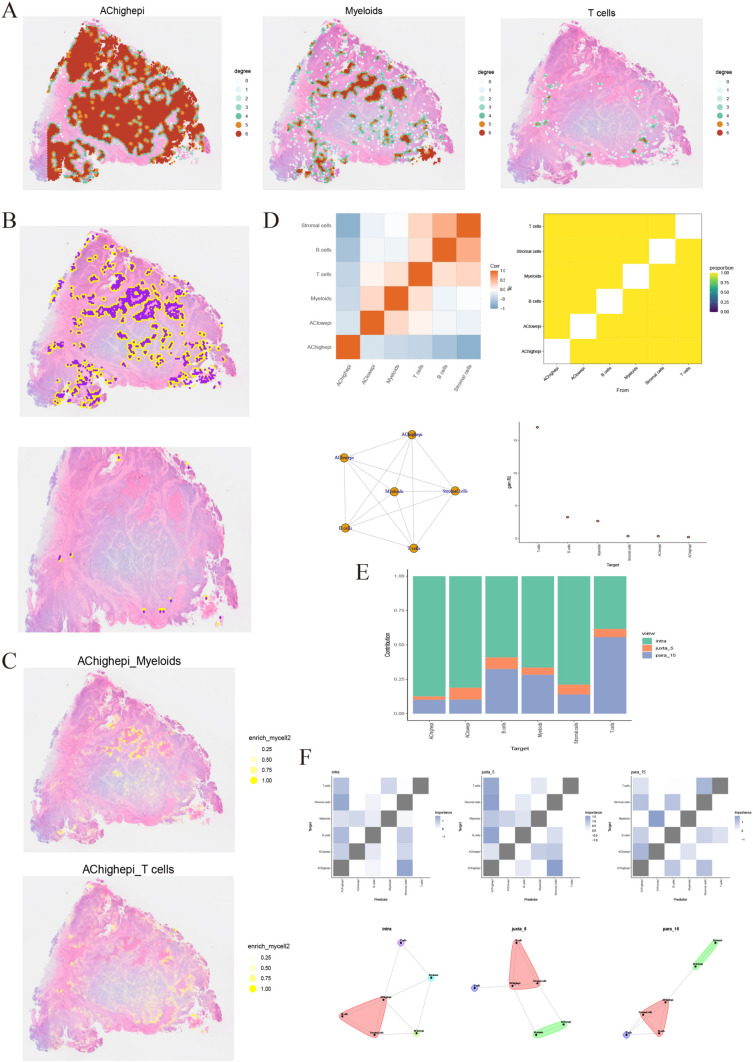
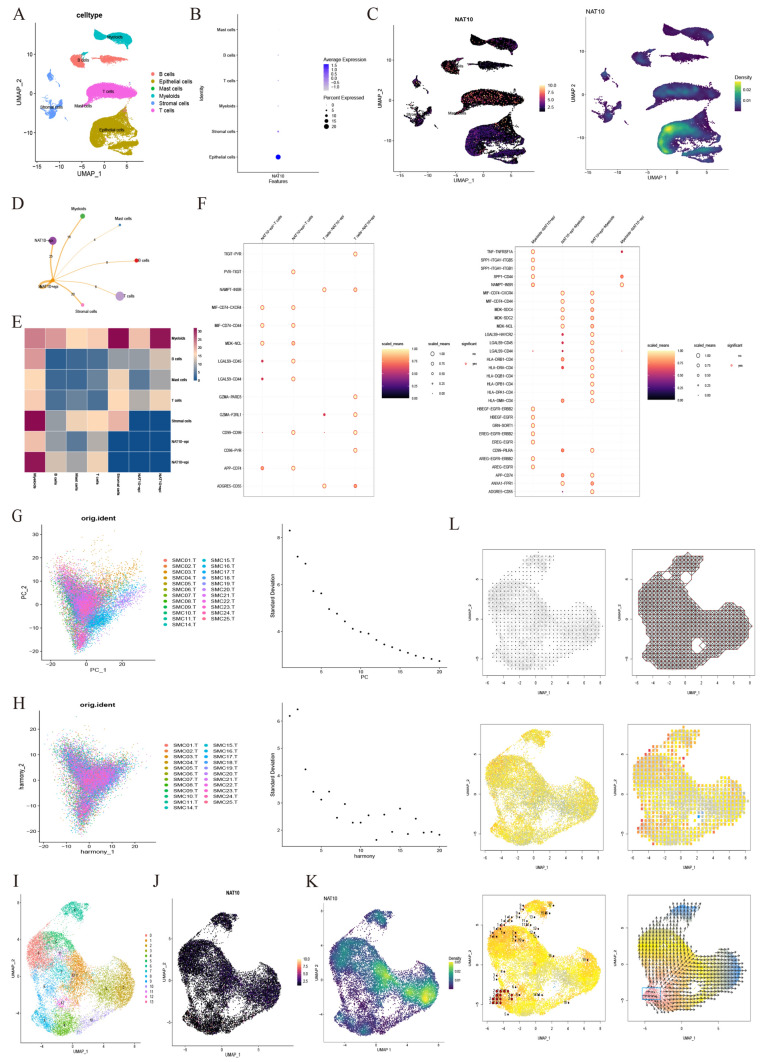
Methods: This study applied multi-omics analyses, including single-cell RNA sequencing (scRNA-seq), spatial transcriptomics, and Mendelian randomization. Data were obtained from public datasets like GSE132465, UCSC Xena, and GeneCards. We focused on acetylation-related genes, specifically NAT10 and GNE, using scoring methods, cell-cell interaction models, and survival analyses to investigate their role in colon cancer development, metastasis, and immune evasion.

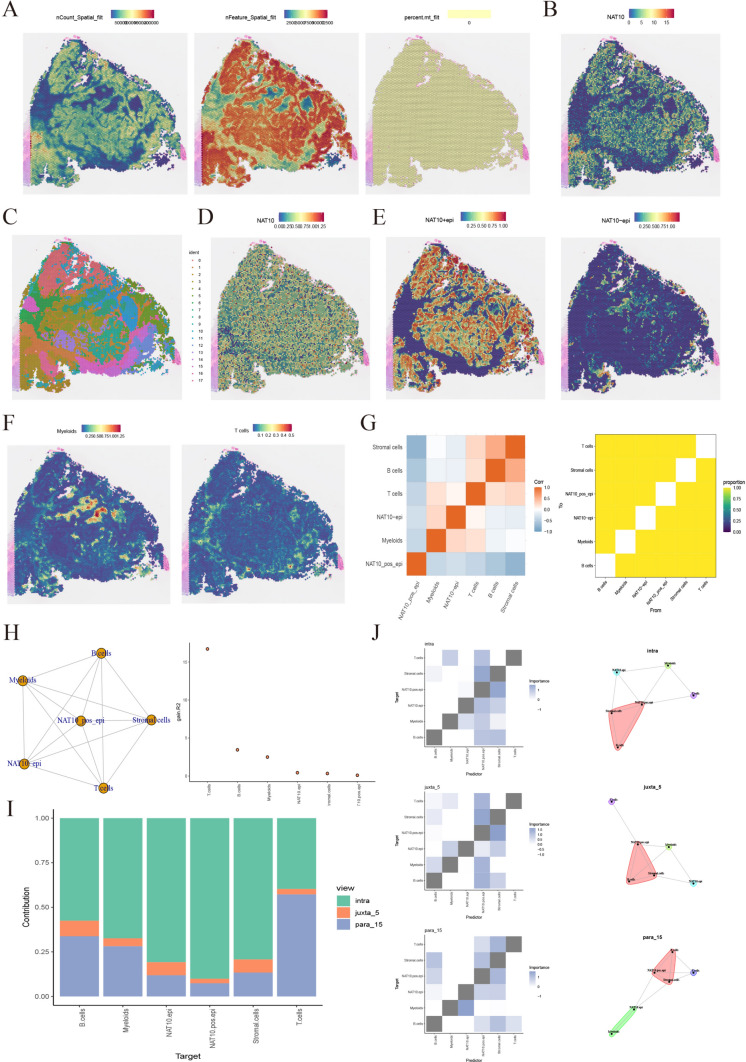
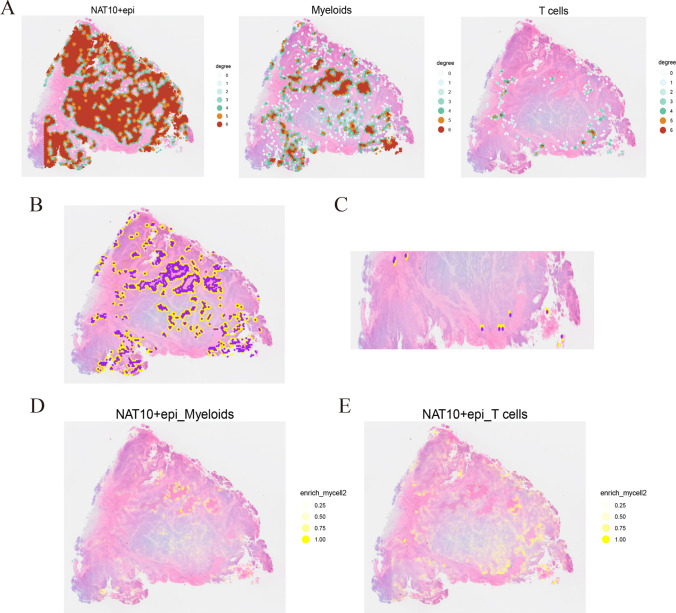
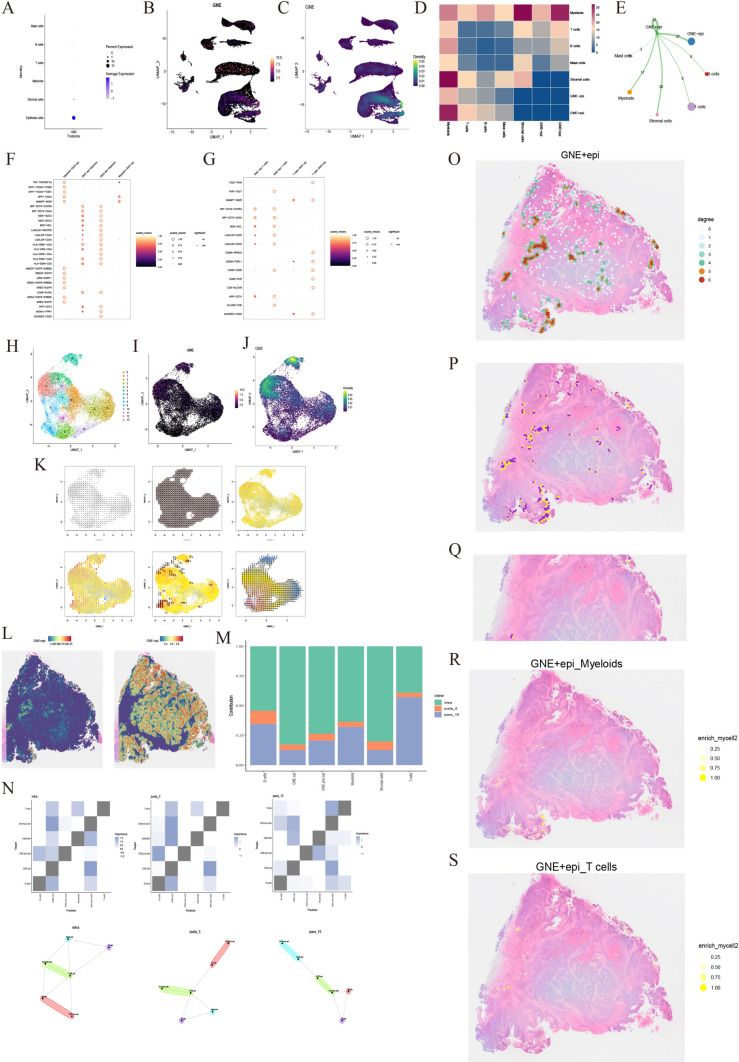
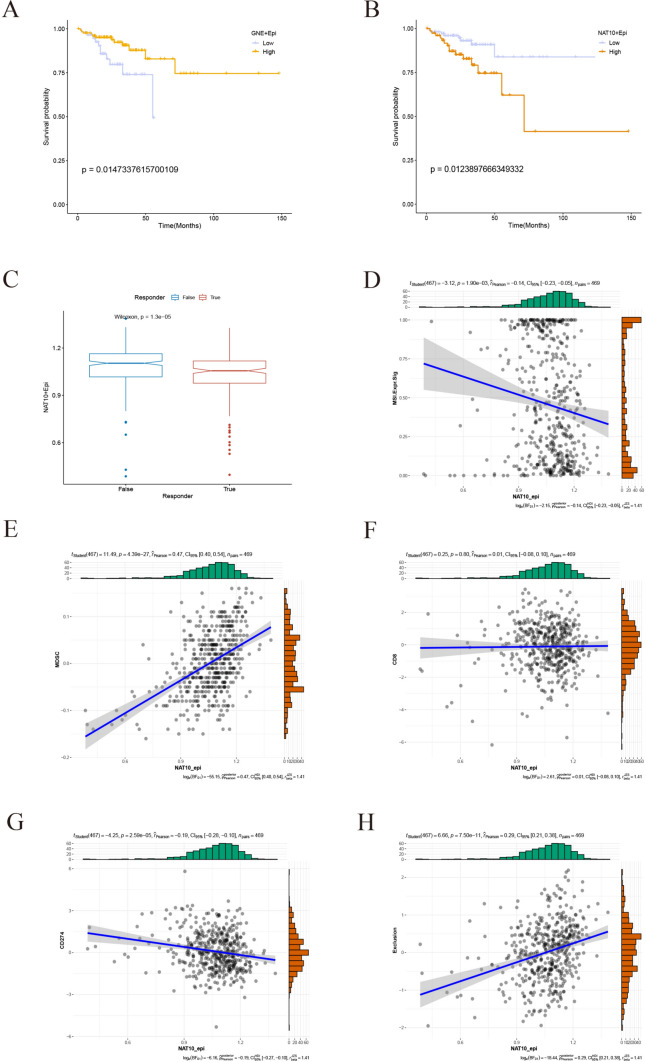
Results: This study identifies that NAT10 is highly expressed in epithelial cells of colorectal cancer (CC) and is closely associated with tumor progression and metastasis. Single-cell RNA sequencing analysis revealed that NAT10-positive epithelial cells exhibited strong interactions with myeloid cells and T cells, with significant differences in cell-cell communication (p < 0.05). Based-on-summary-data Mendelian randomization (SMR) analysis further supports a causal relationship between NAT10 and colorectal cancer. In the MR analysis, a significant positive correlation was observed between NAT10 and colorectal cancer risk using summary data from genome-wide association studies (GWAS) and expression quantitative trait loci (eQTL) studies (β_SMR = 0.004, p_SMR = 0.041, p_HEIDI = 0.737). These findings suggest that NAT10 may serve as a pathogenic factor in colorectal cancer development, providing additional genetic evidence that links this acetylation-related gene to colorectal cancer. Survival analysis further demonstrated that NAT10-positive epithelial cells are associated with poorer prognosis. In the TCGA dataset, patients with NAT10-positive epithelial cells exhibited a significantly shorter disease-free survival (DFS) (p = 0.012). Unlike GNE-positive cells, NAT10-positive epithelial cells exhibited immune escape characteristics, and TIDE analysis indicated that NAT10-positive epithelial cells were associated with a lower response to immune checkpoint blockade therapy (p = 1.3e-5), suggesting that they may impair the efficacy of immunotherapy by promoting immune evasion. In contrast, GNE was also significantly expressed in epithelial cells of colorectal cancer, but its role differs from that of NAT10. GNE-positive epithelial cells demonstrated strong communication with immune cells, particularly in interactions between myeloid cells and T cells through receptor-ligand pairs. Despite the important role of GNE-positive epithelial cells in the tumor microenvironment, their association with immune escape is weaker compared to NAT10. Survival analysis revealed that GNE-positive epithelial cells were associated with a better prognosis (p = 0.015). In the TCGA dataset, patients with GNE-positive epithelial cells displayed longer disease-free survival (DFS), contrary to the results from the SMR analysis.

Conclusions: Leveraging SMR and multi-omics analysis, this study highlights the significant role of acetylation-related genes, particularly NAT10, in colon cancer. The findings suggest that acetylation modifications in epithelial cells contribute to immune evasion and cancer progression. NAT10 could serve as a promising biomarker and therapeutic target for early diagnosis and targeted therapy, offering new avenues for improving colon cancer treatment and patient outcomes.

Keywords: Acetylation; Colon cancer; GNE; Immune evasion; Multi-omics analysis; NAT10; Prognosis; Single-cell RNA sequencing; Spatial transcriptomics; Tumor microenvironment.


Conflict of interest statement

Declarations. Conflict of interests: The authors declare no competing interests.

Figures

Fig. 1
Fig. 1
Dimensionality reduction, clustering, colon cancer gene set scoring based on SMR analysis and Mendelian randomization (MR) analysis of the association between acetylation-related genes and colon cancer risk. A Principal component analysis (PCA) plot of single-cell data. B UMAP and t-SNE visualization of dimensionality-reduced clustered single-cell data, with colors representing different cell clusters (27 clusters in total). C UMAP and t-SNE plots for determining cell types. D Bar plot of gene expression in cells. E Bubble plot showing colon cancer-associated gene scores based on SMR analysis across different cell types in various tissues, using five distinct gene set scoring methods. F Violin plot of score differences between cell types under various scoring methods. G UMAP plot of colon cancer-associated gene expression in normal and colon cancer tissues based on SMR analysis. H Violin plot showing the mean difference in colon cancer-associated gene scores based on SMR analysis across different cell types in various tissues. I All available SNPs in the GWAS and eQTL data of NAT10. J All available SNPs in the GWAS and eQTL data of GNE. K The orange dashed line indicates the effect size estimate of MR associations at top cis-eQTLs, with error bars representing the standard error of the SNP effect
Fig. 2
Fig. 2
High and low acetylation level cell communication analysis, pseudotemporal analysis, and spatial probability from the RCTD perspective. A Cell communication map of acetylation-related gene set positive epithelial cells, with line thickness representing communication strength. B Heatmap of communication strength between different cell types. C Receptor-ligand intensity map of signaling pathways between acetylation-positive epithelial cells, acetylation-negative epithelial cells, and T cells. D Receptor-ligand intensity map of signaling pathways between acetylation-positive epithelial cells, acetylation-negative epithelial cells, and myeloid cells. E Principal component analysis (PCA) plot of epithelial cells. F PCA plot of epithelial cells after Harmony integration. G UMAP visualization of dimensionality-reduced clustered single-cell epithelial data, with colors representing different cell clusters (13 clusters in total). H Intensity map and density plot of acetylation-related gene expression. I Pseudotemporal analysis plot of epithelial cells. J Spatial distribution probability of various cell types in CC tumor tissue slices analyzed using the RCTD deconvolution method
Fig. 3
Fig. 3
Cell communication of high acetylation level cells in spatial transcriptomics data. A Communication strength of various cell types in the homotypic cell network. B Communication strength of high acetylation level cells with myeloid cells (top) and T cells (bottom) in the heterotypic cell network. C Enrichment analysis of neighboring cells. D Cell interaction relationships from the MistyR perspective. E Bar plot showing the contribution of different views to the cell interaction evaluation by the MistyR package, highlighting the relative importance of each. F Communication strength and interaction networks of cells under three different perspectives
Fig. 4
Fig. 4
Single-cell data analysis of the NAT10 gene. A UMAP visualization of tumor tissue in single-cell data, with cells divided into six types. B Expression of NAT10 in various cell types. C Scatter plot and density plot of gene expression intensity of NAT10 under UMAP visualization. D Cell communication map of NAT10-positive epithelial cells, with line thickness representing communication strength. E Heatmap of cell communication in NAT10-positive epithelial cells. F Receptor-ligand intensity map of signaling pathways between NAT10 high and low expressing epithelial cells, myeloid cells, and T cells. G Principal component analysis (PCA) plot of epithelial cells. H PCA plot of epithelial cells after Harmony integration. I UMAP visualization of dimensionality-reduced clustered epithelial single-cell data, with colors representing different cell clusters (13 clusters in total). J Expression of NAT10 gene in epithelial cells. K Density plot of NAT10 gene expression in epithelial cells. L Pseudotemporal analysis plot of epithelial cells
Fig. 5
Fig. 5
Spatial transcriptomics data of NAT10 expression. A H&E staining atlas of CC tumor tissue slices and quality control of spatial transcriptomics data. B Expression intensity of NAT10 in spatial transcriptomics. C UMAP visualization of dimensionality-reduced clustered spatial transcriptomics data, resulting in 17 cell clusters. D Expression of NAT10 after normalization. E Spatial distribution probability of NAT10-positive and negative epithelial cells after RCTD. F Spatial distribution probability of myeloid cells and T cells. G Correlation strength and population plot of each cell under MistyR package analysis. H Cell communication network plot and relative importance under MistyR package analysis. I Bar plot showing the contribution of three perspectives under MistyR package analysis. J Heatmap and network plot of cell communication under three different perspectives
Fig. 6
Fig. 6
Cell communication differences between NAT10-positive epithelial cells and myeloid cells and T cells based on CellDegree analysis. A Homotypic cell network plot. B Heterotypic cell network plot of NAT10-positive epithelial cells and myeloid cells. C Heterotypic cell network plot of NAT10-positive epithelial cells and T cells. D Neighboring cell enrichment analysis plot of NAT10-positive epithelial cells and myeloid cells. E Neighboring cell enrichment analysis plot of NAT10-positive epithelial cells and T cells
Fig. 7
Fig. 7
Multi-omics data analysis of GNE gene expression. A Bubble plot of GNE expression intensity across various cell types. B Distribution of GNE gene expression under UMAP visualization. C Density plot of GNE gene expression. D Heatmap of communication differences between GNE and various cell types. E Cell communication map of GNE-positive epithelial cells, with line thickness representing communication strength. F Receptor-ligand intensity map of signaling pathways between GNE-positive epithelial cells, acetylation-negative epithelial cells, and myeloid cells. G Receptor-ligand intensity map of signaling pathways between GNE-positive epithelial cells, acetylation-negative epithelial cells, and T cells. H UMAP visualization of dimensionality-reduced clustered single-cell epithelial data, with colors representing different cell clusters (13 clusters in total). I Expression of GNE gene in epithelial cells. J Density plot of GNE gene expression in epithelial cells. K Pseudotemporal analysis plot of epithelial cells. L Spatial distribution probability of GNE-positive and GNE-negative epithelial cells. M Bar plot showing the contribution of different views to the cell interaction evaluation by the MistyR package, highlighting the relative importance of each. N Communication strength and interaction networks of cells under three different perspectives. O Communication strength of GNE-positive epithelial cells in the homotypic cell network. P Heterotypic cell network plot of GNE-positive epithelial cells and myeloid cells. Q Heterotypic cell network plot of GNE-positive epithelial cells and T cells. R Neighboring cell enrichment analysis plot of GNE-positive epithelial cells and myeloid cells. S Neighboring cell enrichment analysis plot of GNE-positive epithelial cells and T cells
Fig. 8
Fig. 8
Clinical prognostic value of acetylation genes NAT10 and GNE. A Kaplan–Meier (K–M) curve for overall survival of colon cancer patients, with patients divided into high-expression and low-expression groups based on GNE-positive epithelial cell marker genes. B Kaplan–Meier (K–M) curve for overall survival of colon cancer patients, with patients divided into high-expression and low-expression groups based on NAT10-positive epithelial cell marker genes. C Box plot of TIDE immune therapy response. DH Correlation between NAT10-positive epithelial cells and immune-related marker genes

Similar articles

Cited by

References

    1. Riihimäki M, Hemminki A, Sundquist J, Hemminki K. Patterns of metastasis in colon and rectal cancer. Sci Rep. 2016;6:29765. - PMC - PubMed
    1. Yang Z, Chen Y, Wu D, Min Z, Quan Y. Analysis of risk factors for colon cancer progression. Onco Targets Ther. 2019;12:3991–4000. - PMC - PubMed
    1. Jacobs D, Zhu R, Luo J, Grisotti G, Heller DR, Kurbatov V, Johnson CH, Zhang Y, Khan SA. Defining early-onset colon and rectal cancers. Front Oncol. 2018;8:504. - PMC - PubMed
    1. Paschke S, Jafarov S, Staib L, Kreuser ED, Maulbecker-Armstrong C, Roitman M, Holm T, Harris CC, Link KH, Kornmann M. Are colon and rectal cancer two different tumor entities? A proposal to abandon the term colorectal cancer. Int J Mol Sci. 2018;19:2577. - PMC - PubMed
    1. Asghari-Jafarabadi M, Wilkins S, Plazzer JP, Yap R, McMurrick PJ. Prognostic factors and survival disparities in right-sided versus left-sided colon cancer. Sci Rep. 2024;14:12306. - PMC - PubMed

LinkOut - more resources