. 2025 Jul;68(7):1492-1508.
doi: 10.1007/s00125-025-06425-3. Epub 2025 May 15.

Proinflammatory cytokine-induced alpha cell impairment in human islet microtissues is partially restored by dual incretin receptor agonism

Affiliations

Proinflammatory cytokine-induced alpha cell impairment in human islet microtissues is partially restored by dual incretin receptor agonism

Kristine Henriksen et al. Diabetologia. 2025 Jul.

Abstract

Aims/hypothesis: In type 1 diabetes, the counterregulatory glucagon response to low plasma glucose is impaired. The resulting increased risk of hypoglycaemia necessitates novel strategies to ameliorate alpha cell impairment. Here, we aimed to establish an in vitro type 1 diabetes-like model of alpha cell impairment using standardised reaggregated human islet microtissues (MTs) exposed to proinflammatory cytokines. Additionally, we investigated the therapeutic potential of incretin receptor agonists in improving alpha cell responses to low glucose.

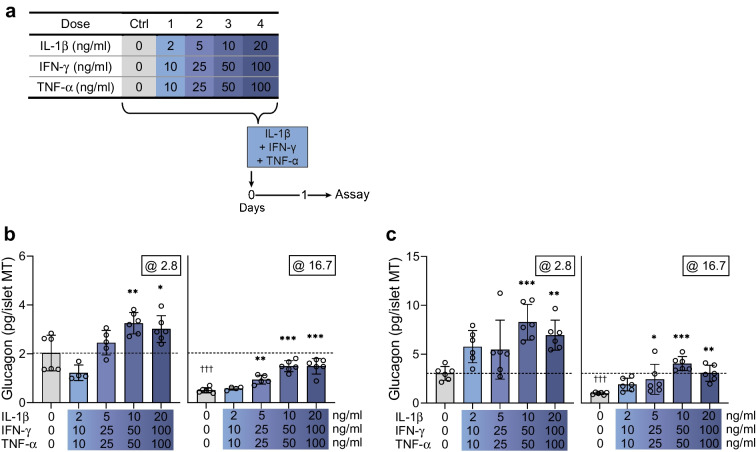
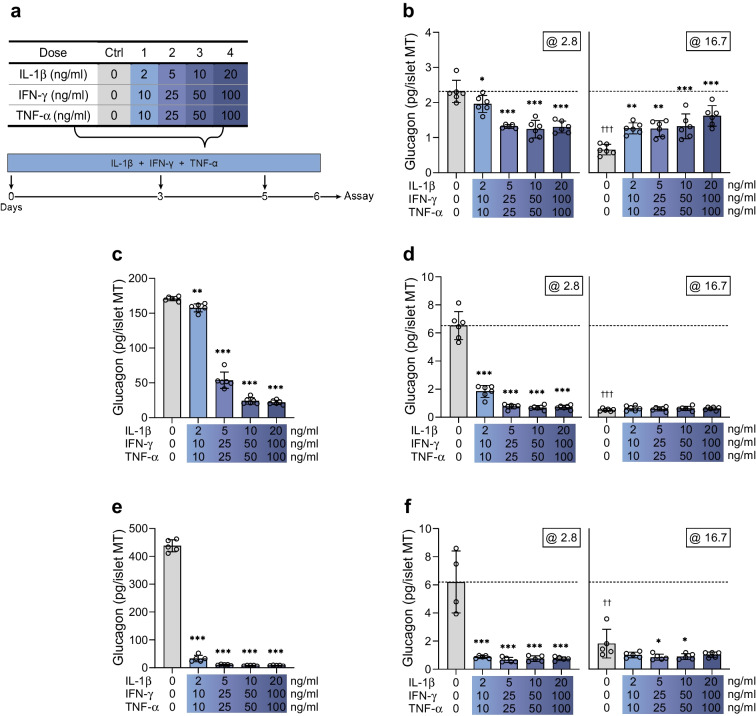
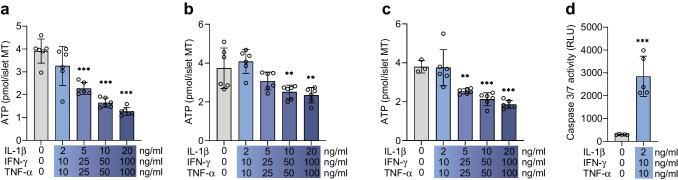
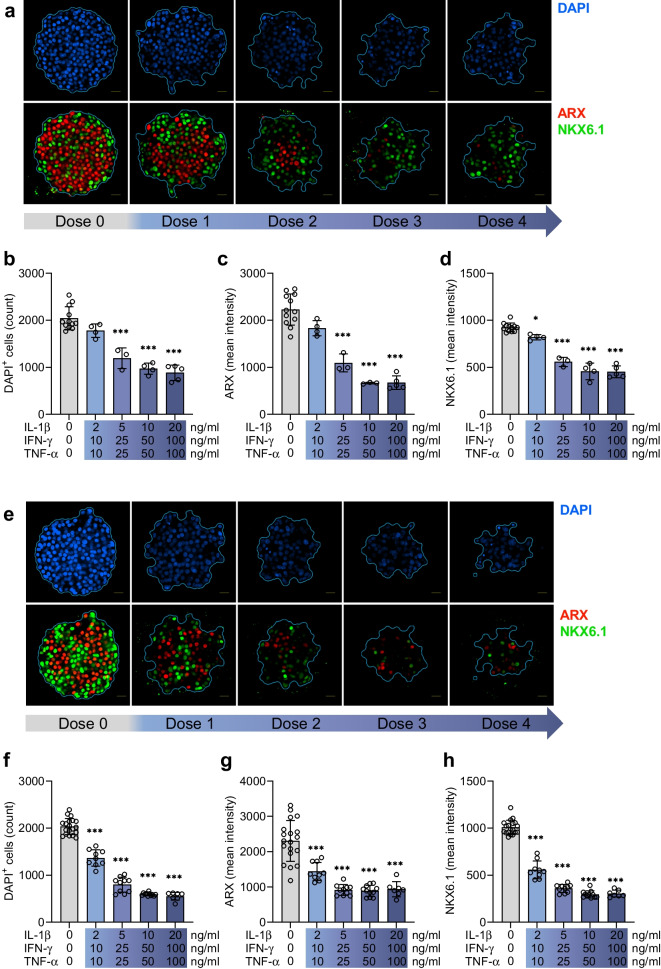
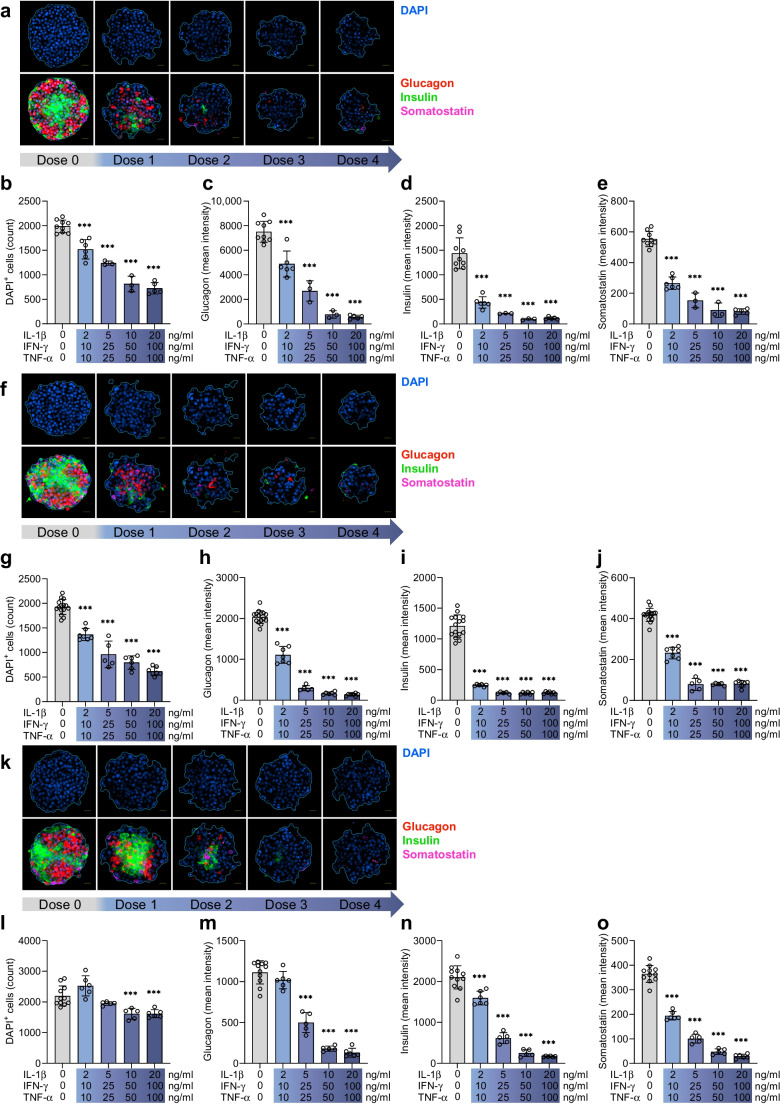
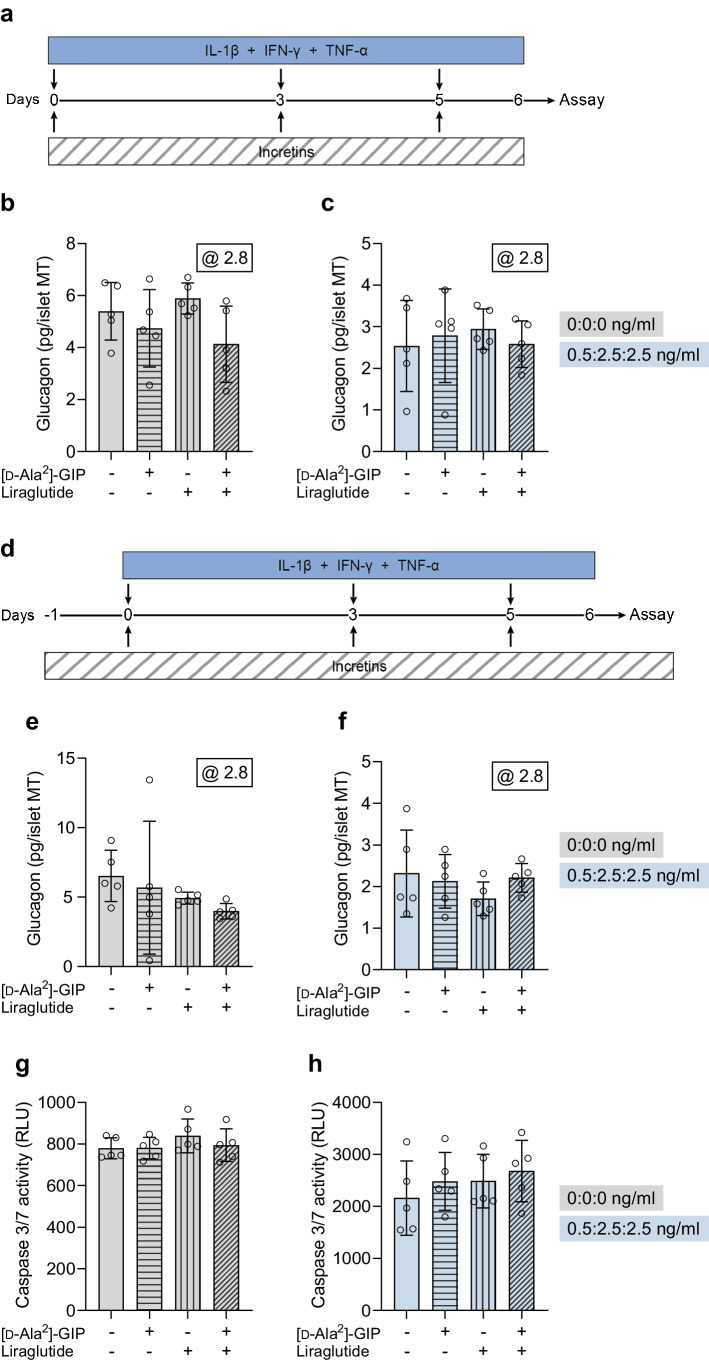
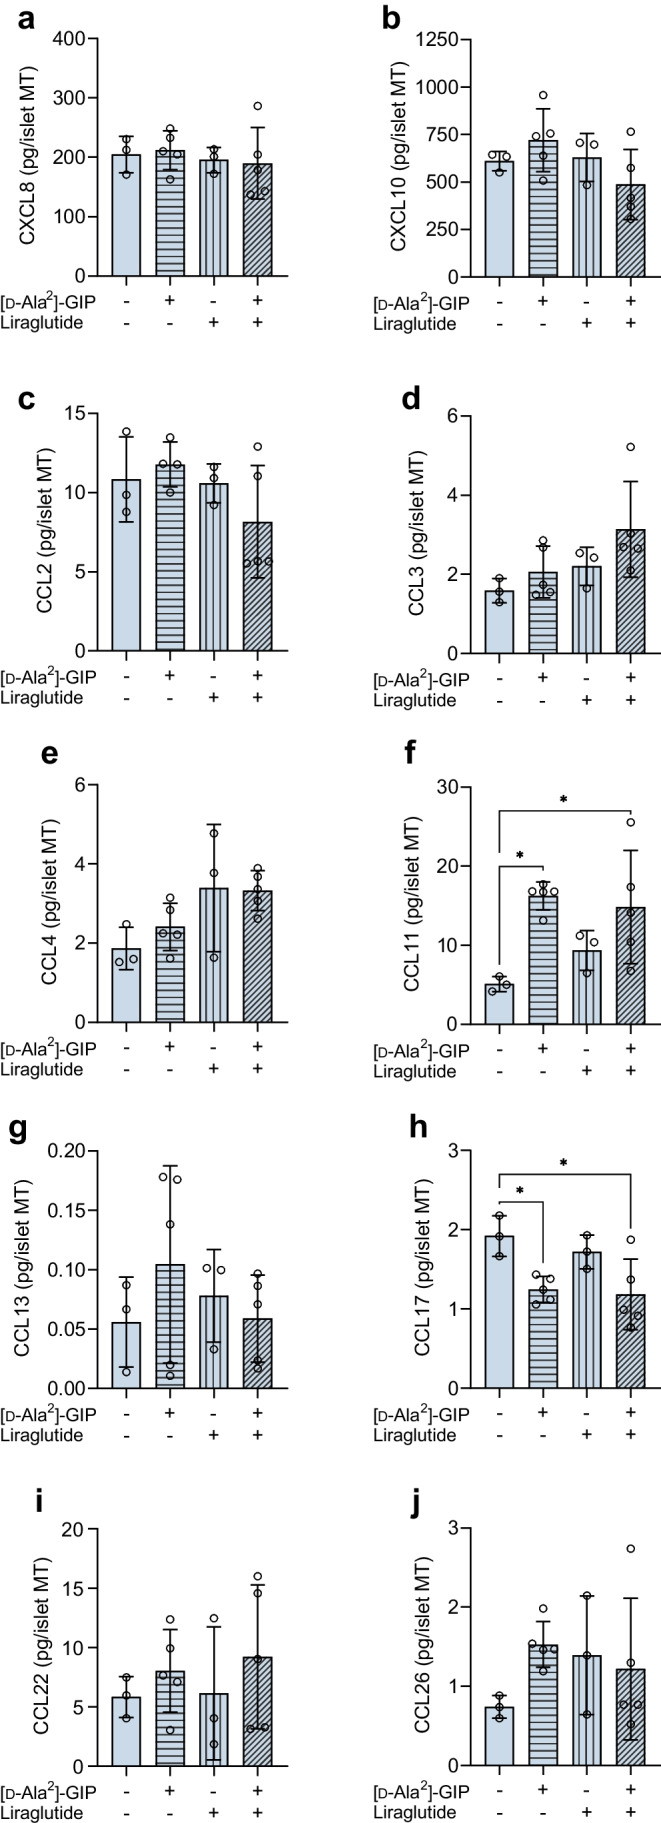
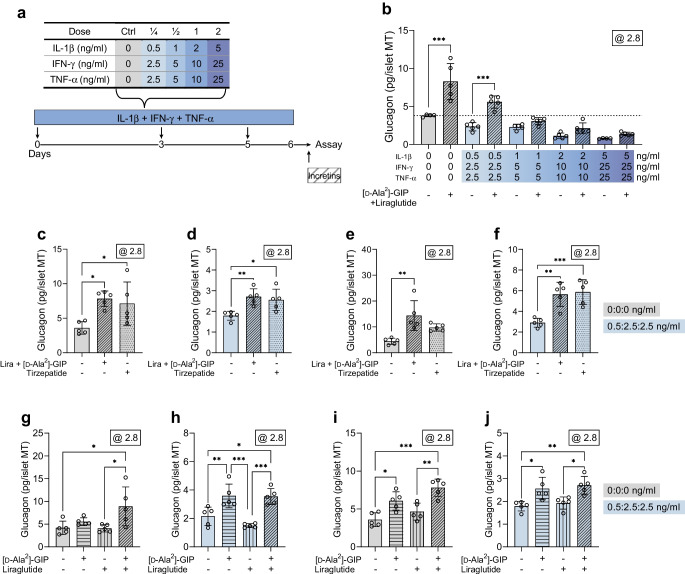
Methods: Human islet MTs were exposed to proinflammatory cytokines (IL-1β, IFN-γ and TNF-α) for 1 day (short-term) and 6 days (long-term). Alpha cell function was assessed by sequential glucose-dependent secretion assays at 2.8 and 16.7 mmol/l glucose, followed by glucagon measurements. Additional evaluations included ATP content, caspase-3/7 activity, chemokine secretion and content of islet transcription factors (aristaless-related homeobox [ARX] and NK6 homeobox 1 [NKX6.1]) and hormones. The effects of incretin receptor agonist treatment (glucose-dependent insulinotropic polypeptide [GIP] analogue [D-Ala2]-GIP with or without the glucagon-like peptide 1 [GLP-1] receptor agonist liraglutide) alongside or after cytokine exposure were also investigated, focusing on low-glucose-dependent glucagon secretion.

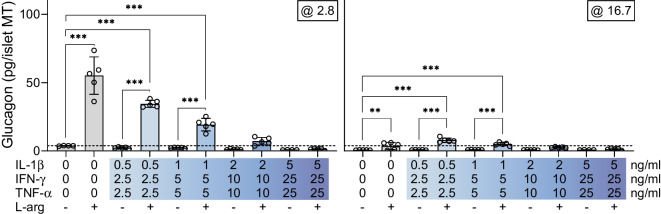
Results: Short-term cytokine exposure increased glucagon secretion at both 2.8 and 16.7 mmol/l glucose in islet MTs. In contrast, long-term cytokine exposure caused dose-dependent suppression of glucagon secretion at 2.8 mmol/l glucose, resembling a type 1 diabetes phenotype. Long-term cytokine exposure also diminished insulin and somatostatin secretion, reduced ATP content, increased caspase 3/7 activity and decreased islet content of ARX, NKX6.1, glucagon and insulin. Despite cytokine-induced impairment, alpha cells partially retained secretory capacity to L-arginine stimulation. Treatment with incretin receptor agonists during long-term cytokine exposure did not prevent alpha cell impairment. However, acute treatment with [D-Ala2]-GIP with or without liraglutide, or with the single-molecule dual agonist tirzepatide, after cytokine exposure partially restored glucagon secretion at low glucose.

Conclusions/interpretation: Long-term cytokine exposure of human islet MTs created a type 1 diabetes-like phenotype with impaired low-glucose-induced glucagon secretion. This cytokine-induced alpha cell impairment was partially restored by [D-Ala2]-GIP with or without liraglutide, or by tirzepatide.

Keywords: GIP; GLP-1; Glucagon secretion; Human model; Incretins; Liraglutide; Pancreatic alpha cells; Proinflammatory cytokines; Type 1 diabetes.


Conflict of interest statement

Acknowledgements: The authors gratefully acknowledge organ donors and the next of kin of organ donors, without whom this research would not be possible. The authors thank R. Gerwig from Steno Diabetes Center Copenhagen and L. B. Albæk from the University of Copenhagen for the technical support with the chemokine and somatostatin measurements, respectively. Data availability: The datasets generated and analysed during the study are available from the corresponding author upon reasonable request. Funding: Open access funding provided by Copenhagen University. This paper represents independent research supported by funding from The Leona M. and Harry B. Helmsley Charitable Trust (grant no. 1912-03551) and the Poul and Erna Sehested-Hansen Foundation. No funders were involved in the study design, data collection, analysis, interpretation, writing or decision to submit the article for publication. Authors’ relationships and activities: CR, ACT, SJ and BY are employees of InSphero. BH is a co-founder of Bainan Biotech. JJH has served on scientific advisory panels for and/or has received speaker honoraria from Novo Nordisk and MSD/Merck, is co-founder and board member of Antag Therapeutics, and is co-founder of Bainan Biotech. FKK has served on scientific advisory panels and/or been part of speaker’s bureaus for, served as a consultant to, and/or received research support from Amgen, AstraZeneca, Bayer, Boehringer Ingelheim, Carmot Therapeutics, Eli Lilly, Gubra, MedImmune, MSD/Merck, Mundipharma, Norgine, Novo Nordisk, Sanofi, ShouTi, Zealand Pharma and Zucara. FKK is a co-founder of and minority shareholder in Antag Therapeutics, owns stocks in Eli Lilly, Novo Nordisk and Zealand Pharma, and has been employed by Novo Nordisk since 1 December 2023. JS owns stocks in Novo Nordisk A/S. The authors declare that there are no other relationships or activities that might bias, or be perceived to bias, their work. Contribution statement: KH, FKK and JS conceptualised the study. KH, BY and JS designed the experiments. KH, CR, SJ, ACT, BH, JJH and BY contributed to the data acquisition and analysis. KH wrote the initial manuscript draft and JS provided comments. All authors provided critical scientific input to the manuscript and approved the final version. JS is the guarantor of this work.

Figures

Fig. 1
Fig. 1
Short-term cytokine exposure increases glucagon secretion. (a) Experimental schematic of the short-term (1 day) setup. (b, c) Glucagon secretion at 2.8 and 16.7 mmol/l glucose in control islet MTs (grey bars) and with increasing load of short-term cytokine exposure (blue bars) in donor 1 (b) and donor 2 (c). The dashed line denotes the baseline physiological response to low glucose of untreated control islet MTs. Data are presented as mean ± SD of a single donor in six technical replicates. *p<0.05, **p<0.01 and ***p<0.001 vs untreated control, by one-way ANOVA with Dunnett’s multiple comparisons test; †††p<0.001, for the two untreated controls at 2.8 vs 16.7 mmol/l glucose, by Student’s t test
Fig. 2
Fig. 2
Long-term cytokine exposure impairs glucose-dependent glucagon secretion. (a) Experimental schematic of the long-term (6 day) setup. (b, d, f) Glucagon secretion at 2.8 and 16.7 mmol/l glucose in control islet MTs (grey bars) and with increasing load of long-term cytokine exposure (blue bars) in donor 3 (b), donor 4 (d) and donor 5 (f). The dashed line denotes the baseline physiological response to low glucose of untreated control islet MTs. (c, e) Accumulated glucagon secretion over the last 24 h of long-term cytokine exposure for donor 4 (c) and donor 5 (e). Data are presented as mean ± SD of a single donor in six technical replicates (five technical replicates for donor 5). *p<0.05, **p<0.01 and ***p<0.001 vs untreated control, by one-way ANOVA with Dunnett’s multiple comparisons test; ††p<0.01 and †††p<0.001, for the two untreated controls at 2.8 vs 16.7 mmol/l glucose, by Student’s t test
Fig. 3
Fig. 3
Long-term cytokine exposure induces cell death. (ac) ATP content in control (grey bars) and with increasing load of long-term cytokine exposure (blue bars) in donor 3 (a), donor 4 (b) and donor 5 (c). Data are presented as mean ± SD of a single donor in six technical replicates. **p<0.01 and ***p<0.001 vs untreated control, by one-way ANOVA with Dunnett’s multiple comparisons test. (d) Caspase 3/7 activity after long-term cytokine exposure (dose 1, donor 8). Data are presented as mean ± SD of a single donor in five technical replicates. ***p<0.001, for untreated control vs cytokine exposure, by Student’s t test. RLU, relative light units
Fig. 4
Fig. 4
Long-term cytokine exposure reduces transcription factor ARX and NKX6.1 expression. (ad) Representative images for transcription factor staining in islet MTs from donor 9 with increasing load of long-term cytokine exposure (a) and associated quantification of DAPI-positive cell count (b), mean ARX intensity (c) and mean NKX6.1 intensity (d) expression. (eh) Representative images for transcription factor staining in islet MTs from donor 10 (e) and associated quantification of DAPI-positive cell count (f), mean ARX intensity (g) and mean NKX6.1 intensity (h). Scale bar, 20 μm. Data are presented as mean ± SD of a single donor in 3–11 technical replicates (12–19 for control). *p<0.05 and ***p<0.001 vs untreated control, using one-way ANOVA with Dunnett’s multiple comparisons test
Fig. 5
Fig. 5
Long-term cytokine exposure reduces islet hormone expression. (ae) Representative images for islet hormone staining in islet MTs from donor 9 with increasing load of long-term cytokine exposure (a) and associated quantifications of DAPI-positive cell count (b), mean glucagon intensity (c), mean insulin intensity (d) and mean somatostatin intensity (e). (fj) Representative images for islet hormone staining in islet MTs from donor 10 (f) and associated quantifications of DAPI-positive cell count (g), mean glucagon intensity (h), mean insulin intensity (i) and mean somatostatin intensity (j). (k–o) Representative images for islet hormone staining in islet MTs from donor 11 (k) and associated quantifications of DAPI-positive cell count (l), mean glucagon intensity (m), mean insulin intensity (n), and mean somatostatin intensity (o). Scale bar, 20 μm. Data are presented as mean ± SD of a single donor in 3–7 technical replicates (9–15 for control). ***p<0.001 vs untreated control, by one-way ANOVA with Dunnett’s multiple comparisons test
Fig. 6
Fig. 6
Alpha cells partially retain secretory capacity in response to l-arginine after long-term cytokine exposure. Glucagon secretion at 2.8 and 16.7 mmol/l glucose in control (grey bars) and with increasing load of long-term cytokine exposure (blue bars) in islet MTs from donor 8 with and without 10 mmol/l l-arginine. The dashed line denotes the baseline physiological response to low glucose of untreated control islet MTs. Data are presented as mean ± SD of five technical replicates. **p<0.01 and ***p<0.001, for l-arginine stimulated MTs vs the respective unstimulated control and for l-arginine stimulated MTs vs the untreated control/baseline response, by two-way ANOVA with Šídák’s multiple comparisons test, L-arg, l-arginine
Fig. 7
Fig. 7
Treatment with [d-Ala2]-GIP with or without liraglutide alongside cytokine exposure does not prevent alpha cell impairment or cell death. (a) Experimental schematic for donor 8. (b, c) Glucagon secretion in islet MTs from donor 8 at 2.8 mmol/l glucose in control MTs (b), and long-term cytokine-exposed MTs (at dose ¼: 0.5, 2.5 and 2.5 ng/ml for IL-1β, IFN-γ and TNF-α, respectively) (c), without or with 1 µmol/l [d-Ala2]-GIP, liraglutide, or both. (d) Experimental schematic for donor 12 denoting addition of 24 h pre-treatment with [d-Ala2]-GIP and/or liraglutide before cytokine exposure and the addition during glucose-dependent hormone secretion assay. (e, f) Glucagon secretion in islet MTs from donor 12 at 2.8 mmol/l glucose in control MTs (no cytokines) (e), and long-term cytokine-exposed MTs (at dose ¼: 0.5, 2.5 and 2.5 ng/ml for IL-1β, IFN-γ and TNF-α, respectively) (f), without or with 1 µmol/l [d-Ala2]-GIP, liraglutide, or both. (g, h) Caspase 3/7 activity in islet MTs from donor 12 in control islet MTs (no cytokines) (g), and after long-term cytokine exposure (dose ¼: 0.5, 2.5 and 2.5 ng/ml for IL-1β, IFN-γ and TNF-α, respectively) (h) without or with 1 µmol/l [d-Ala2]-GIP, liraglutide, or both. Data are presented as mean ± SD of a single donor in five technical replicates. Results are not significant using one-way ANOVA with Tukey’s multiple comparisons test. RLU, relative light units
Fig. 8
Fig. 8
Treatment with [d-Ala2]-GIP with or without liraglutide alters cytokine-induced secretion of CCL11 and CCL17. Accumulated CXCL8 (a), CXCL10 (b), CCL2 (c), CCL3 (d), CCL4 (e), CCL11 (f), CCL13 (g), CCL17 (h), CCL22 (i) and CCL26 secretion (j) in islet MTs from donor 12 during the last 24 h of the long-term cytokine exposure (dose ¼) without or with 1 µmol/l [d-Ala2]-GIP, liraglutide, or both. Data are presented as mean ± SD in 5 technical replicates (only three technical replicates were measured for untreated control and liraglutide bars due to pipetting error). *p<0.05, for all pairwise comparisons between treatment groups, by one-way ANOVA with Tukey’s multiple comparisons test
Fig. 9
Fig. 9
Acute treatment with incretins following cytokine exposure boosts glucagon secretion of the type 1 diabetes phenotype. (a) Experimental schematic denoting acute incretin treatment during the hormone secretion assay. (b) Glucagon secretion in islet MTs from donor 8 at 2.8 mmol/l glucose in control islet MTs or in the islet MTs with increasing load of long-term cytokine exposure, with/without acute treatment with [d-Ala2]-GIP+liraglutide (1 µmol/l each) during the hormone secretion assay. (c, d) Glucagon secretion in islet MTs from donor 7 at 2.8 mmol/l glucose in control (c) and cytokine-exposed islet MTs (dose ¼: ¼: 0.5, 2.5 and 2.5 ng/ml for IL-1β, IFN-γ and TNF-α, respectively) (d) without or with acute [d-Ala2]-GIP+liraglutide (1 µmol/l each) or 1 µmol/l tirzepatide treatment. (e, f) As for (c, d) but in islet MTs from donor 13. (g, h) Glucagon secretion in islet MTs from donor 12 at 2.8 mmol/l glucose in control (g) and cytokine-exposed islet MTs (dose ¼: ¼: 0.5, 2.5 and 2.5 ng/ml for IL-1β, IFN-γ and TNF-α, respectively) (h) with/without acute treatment with 1 µmol/l [d-Ala2]-GIP, liraglutide, or both. (i, j) As for (g, h) but in islet MTs from donor 7. Data are presented as mean ± SD of a single donor in five technical replicates. *p<0.05, **p<0.01 and ***p<0.001, for [d-Ala2]-GIP+liraglutide treatment vs the respective untreated control, by two-way ANOVA with Šídák’s multiple comparisons test (b); *p<0.05, **p<0.01 and ***p<0.001, for [d-Ala2]-GIP+liraglutide or tirzepatide treatment vs the untreated control, by one-way ANOVA with Dunnett’s multiple comparisons test (cf); *p<0.05, **p<0.01 and ***p<0.001, for all pairwise comparisons between treatment groups, by one-way ANOVA with Tukey’s multiple comparisons test (gj). Ctrl, control

Similar articles

References

    1. Capozzi ME, D’Alessio DA, Campbell JE (2022) The past, present, and future physiology and pharmacology of glucagon. Cell Metab 34(11):1654–1674. 10.1016/J.CMET.2022.10.001 - PMC - PubMed
    1. Gerich JE, Langlois M, Noacco C, Karam JH, Forsham PH (1973) Lack of glucagon response to hypoglycemia in diabetes: evidence for an intrinsic pancreatic alpha cell defect. Science 182(4108):171–173. 10.1126/SCIENCE.182.4108.171 - PubMed
    1. Cryer PE (2014) Glycemic goals in diabetes: trade-off between glycemic control and iatrogenic hypoglycemia. Diabetes 63:2188–2195. 10.2337/db14-0059 - PubMed
    1. Wendt A, Eliasson L (2020) Pancreatic α-cells – the unsung heroes in islet function. Semin Cell Dev Biol 103:41–50. 10.1016/J.SEMCDB.2020.01.006 - PubMed
    1. Kulkarni RN, Stewart AF (2014) Summary of the keystone islet workshop (April 2014): the increasing demand for human islet availability in diabetes research. Diabetes 63(12):3979–3981. 10.2337/DB14-1303 - PMC - PubMed

MeSH terms

LinkOut - more resources