. 2025 Jun;30(5-6):1589-1613.
doi: 10.1007/s10495-025-02119-8. Epub 2025 May 15.

GJB2 as a novel prognostic biomarker associated with immune infiltration and cuproptosis in ovarian cancer

Affiliations

GJB2 as a novel prognostic biomarker associated with immune infiltration and cuproptosis in ovarian cancer

Han Lei et al. Apoptosis. 2025 Jun.

Abstract

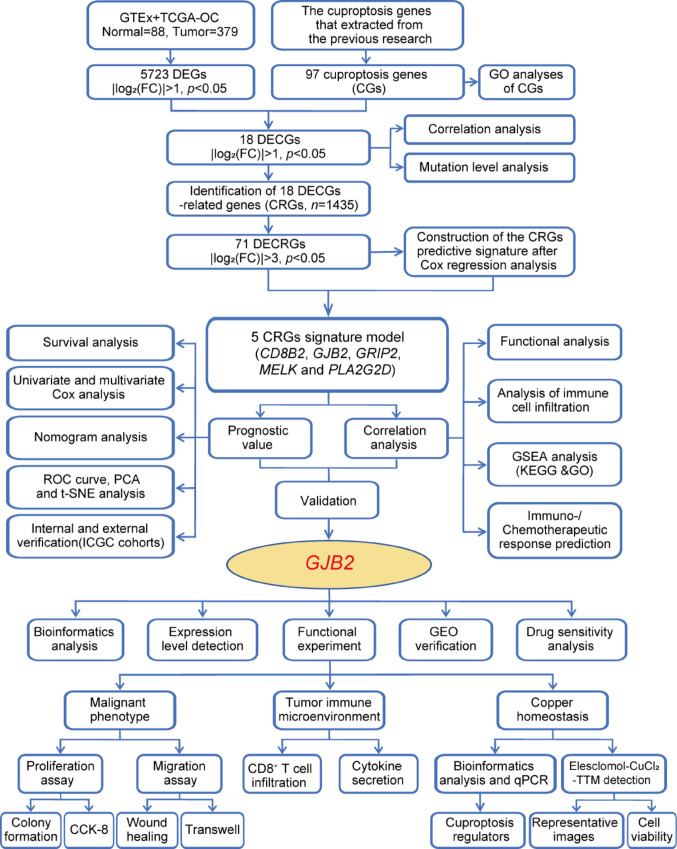
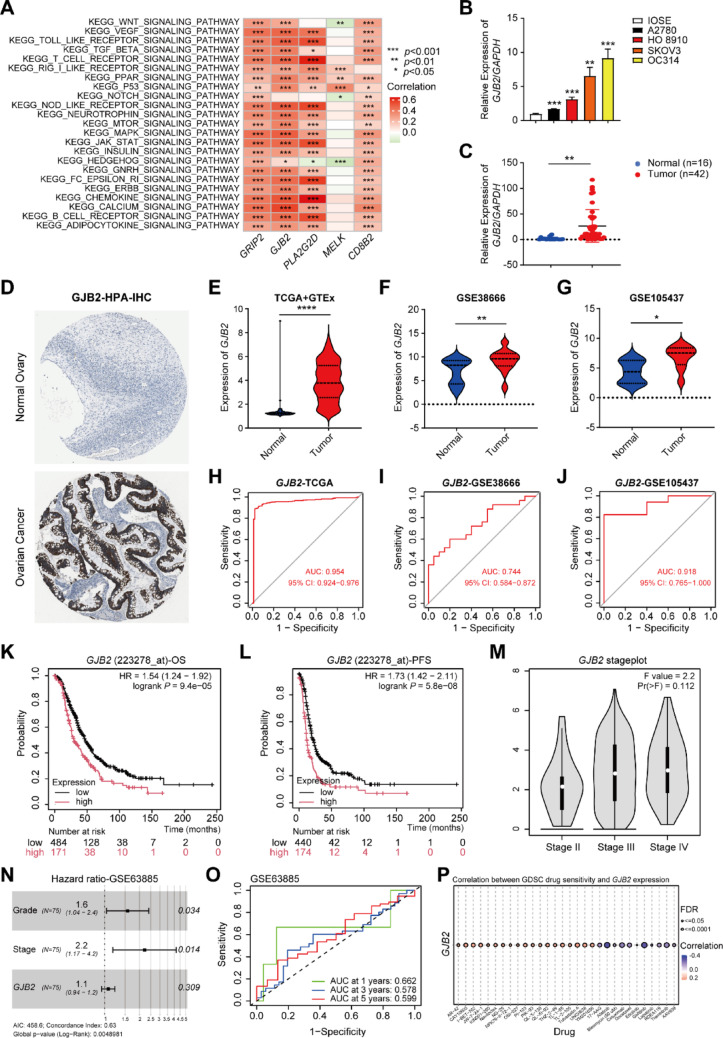
Cuproptosis, a recently identified copper-dependent cell death mechanism, remains poorly unexplored in ovarian cancer (OC). This study systematically evaluates clinically significant cuproptosis-related genes (CRGs) as potential prognostic biomarkers in OC. Cox regression analysis and LASSO algorithms were used to develop a prognostic risk model incorporating 5 CRGs (CD8B2, GJB2, GRIP2, MELK, and PLA2G2D) within the TCGA cohort. This model stratified OC patients into high-risk and low-risk groups, with the high-risk group exhibiting significantly shorter overall survival compared to the low-risk group. The model's predictive accuracy for prognosis in OC patients was validated in the TCGA training cohort, TCGA testing cohort, and ICGC external validation cohorts. Among these 5 signature genes, the number of cuproptosis genes associated with GJB2 is the largest, so we selected GJB2 for further validation. qPCR revealed that GJB2 was highly expressed in OC cells and tumor tissues. The high expression of GJB2 was closely associated with poor prognosis in OC patients. Functionally, GJB2 silencing suppressed OC cell proliferation and migration while its overexpression promoted malignant progression and EMT. Furthermore, GJB2 regulated copper homeostasis and reduced cuproptosis sensitivity, while also facilitating immune escape by inhibiting CD8+ T cell infiltration and cytokine secretion, revealing its multiple roles in OC progression. In conclusion, we established a novel prognostic model incorporating 5 CRGs that effectively predicts clinical outcomes and characterizes the immune microenvironment in OC. Our findings particularly highlight GJB2 as a key regulator of cuproptosis with significant potential as both a prognostic biomarker and therapeutic target for OC management.

Keywords: GJB2; Cuproptosis; Immune infiltration; Ovarian cancer; Prognostic signature; Proliferation and migration.


Conflict of interest statement

Declarations. Competing interests: The authors declare no competing interests. Ethics approval: The study was reviewed and approved by the Ethics Committee of Xiangya Hospital Central South University, approval number 202204081. All clinical samples were collected with informed consent from patients. We declare that all methods are reported in accordance with the declaration of Helsinki.

Figures

Fig. 1
Fig. 1
Flowchart of the Study
Fig. 2
Fig. 2
DECGs and Molecular Characterization in OC Patients. A GO pathway enrichment analysis of CGs involved signaling pathway. B Venn diagram showing the DECGs shared by TCGA-DEGs and CGs, 18 DECGs were found in the TCGA cohort. C Differential expression of 18 DECGs between normal tissue and OC tissues. D The correlations between the expression of 18 DECGs. E Mutation frequencies of 18 DECGs in 462 patients with OC from the TCGA cohort. F Frequency of CNV alterations in 18 DECGs. Red dots represented CNV amplification, while green dots represented CNV deletion. G Location of CNV alterations of 18 DECGs on chromosomes in the TCGA-OC cohort. H Sankey diagram of coexpression between 18 DECGs and 1453 CRGs. I The volcano plot depicted the expression patterns of CRGs in TCGA-OC. *p < 0.05, **p < 0.01, ***p < 0.001, ****p < 0.0001
Fig. 3
Fig. 3
Construction and Validation of CRGs Signature. A The forest plot demonstrated the hazard ratio of 5 CRGs with prognostic values filtered by the univariate Cox regression analysis. B The heatmap of the correlation between 18 DECGs and 5 CRGs. C KM curves for OS of the two risk groups (chi-square test, p = 0.003). D Univariate Cox analysis of the signature with clinical phenotypes. E Multivariate Cox regression analysis of the signature with clinical phenotypes. F The expression heatmap of 5 CRGs in the 3 groups (all, training, and testing). The ranked dot plot indicates the risk score distribution and the scatter plot presents the patients' survival status. G ROC curves to predict the sensitivity and specificity of 1-, 2-, and 3-year survival according to the risk score in the 3 groups (all, training, and testing). (H-J) PCA between the high-risk and low-risk groups based on the 18 DECGs H, All CRGs I, and 5 CRGs risk model J. *p < 0.05, **p < 0.01, ***p < 0.001, ****p < 0.0001
Fig. 4
Fig. 4
Prognostic Analysis of the 5 CRGs Risk Model in TCGA and ICGC Cohorts. AC ROC curve of 1-, 3-, and 5-year OS for multiple prognostic indicators of OC samples. D The nomogram, a quantitative model for predicting clinical prognosis, to predict 1-year, 3-year, and 5-year OS in the OC patients of the TCGA-OC cohort using 3 factors, including Age, Grade, and risk score. E The calibration curves indicated that the nomogram accurately predicted the 1-, 3-, and 5-year OS of OC patients in the TCGA cohort. F A concordance index (C-index) was generated to assess the identification and forecasting capabilities of the nomogram. G The PCA analysis based on the prognostic signature demonstrated that the patients in the different risk score groups were distributed in two directions. Red and blue dots represent the high-risk group and the low-risk group. H t-SNE analysis of risk groups in all TCGA cohorts. I Comparison of the prognostic risk model with TIS models and TIDE models. TIS: Tumor Inflammation Signature; TIDE: Tumor Immune Dysfunction and Exclusion. J KM survival analysis of high and low-risk groups in ICGC cohorts. K 1-, 2-, and 3-year ROC curve analysis in ICGC cohorts. L The distribution of the risk score in the ICGC cohorts. M The correlation of survival time and risk scores in ICGC cohorts. N PCA between low-risk and high-risk groups in ICGC cohorts. O t-SNE analysis of risk groups in the ICGC cohorts. *p < 0.05, **p < 0.01, ***p < 0.001, ****p < 0.0001
Fig. 5
Fig. 5
Risk Score of CRGs Predicts the Signaling Pathways, Tumor Microenvironment, and Immune Cell Infiltration. (A-B) GSEA enrichment analysis (KEGG) between the high-risk A and low-risk B groups. C The abundance of infiltrating immune cell types in the high-risk and low-risk groups. D Comparison of immune-related scores between the high-risk and low-risk groups. E Violin plot illuminating the difference in the exclusion score between the high-risk and low-risk groups. F Survival analysis curves of the high-TMB and low-TMB groups. G Effect of TMB with different risks on the probability of survival. *p < 0.05, **p < 0.01, ***p < 0.001, ****p < 0.0001
Fig. 6
Fig. 6
Immunotherapy Analysis and Drug Sensitivity Prediction in High-risk and Low-risk Groups. AD Differences in sensitivity to anti-PD-1, anti-CTLA-4, and the combination of these two antibodies in different risk score groups. E, F Boxplot showing the mean differences in estimated IC50 values of 6 representative drugs (Ruxolitinib, Temozolomide, Tubastatin A, Trametinib, Midostaurin, and 17-AAG) between the two risk groups
Fig. 7
Fig. 7
Analysis of GJB2 Expression and Survival Prognosis in OC. A GSVA analyzed the signaling pathways involved in 5 characteristic genes (CD8B2, GJB2, GRIP2, MELK, and PLA2G2D). B The expression of GJB2 in normal ovarian surface epithelial cells (IOSE) and OC cell lines (HO 8910, A2780, OC314, and SKOV3) were detected by qPCR. CGJB2 expression levels in OC and normal ovarian tissues were quantified by qPCR. D Representative IHC staining for GJB2 protein in normal ovarian tissue and OC tissue, taken from the HPA with permission on its website. EG The violin plot depicts the upregulation of GJB2 in OC tumor samples in TCGA + GTEx, GSE38666, and GSE105437. HJ ROC Curves Displaying the Sensitivity and Specificity of GJB2 for the Diagnosis of OC Patients from the TCGA, GSE38666, and GSE105437 Dataset. K KM survival curves for OS in OC patients according to the tumor expression of GJB2. L KM survival curves for PFS in OC patients according to the tumor expression of GJB2. M GEPIA2 online website analysis showed a correlation between GJB2 and the OC stage. N Meta-analysis depicting forest plots of GJB2 expression in GSE63885 datasets as a univariate predictor of OS. O ROC curves display the sensitivity and specificity of GJB2 for the diagnosis of OC patients from the GSE63885 datasets. X-axis indicates false-positive rates, and Y-axis indicates true-positive rates. P Correlation between GJB2 expression and the sensitivity of GDSC drugs (top 30). Positive correlation indicates a higher gene expression may lead to drug resistance. Negative correlation indicates a higher gene expression may make drug-sensitive. In all statistical plots, data are expressed as the mean ± SD. *p < 0.05, **p < 0.01, ***p < 0.001, ****p < 0.0001
Fig. 8
Fig. 8
GJB2 Modulates Malignant Phenotypes and EMT in OC Cells. A The transfection efficiency of GJB2 siRNA in SKOV3 was detected by qPCR. B The CCK-8 assay showed that GJB2 interference significantly inhibited SKOV3 cell proliferation at 12, 24, 48, and 72 h. C Knockdown of GJB2 inhibited the proliferation ability of SKOV3 cells and was evaluated by a colony formation assay. DE Transwell (D) and wound healing (E) assays were performed to determine the effect of GJB2 knockdown on the migration ability of SKOV3 cells. F Validation of GJB2 expression after transfection of GJB2-OE and negative control (NC) plasmids in A2780 cells using qPCR and Western blotting assays. G CCK-8 assay displaying the influence of GJB2-OE on the cell viability. H The colony formation assay displays the effect of GJB2 upregulation on cell proliferation ability. IJ The effects of GJB2-OE on OC cell migration were evaluated through Transwell (I) and wound healing (J) assays. K Bioinformatic analysis of GJB2-associated signaling pathways in OC using GSCA. LM The mRNA and protein levels of GJB2, E-cadherin, N-cadherin, and Vimentin in A2780 cells after GJB2 overexpression were detected by qPCR (L) and Western blotting (M). In all statistical plots, data are expressed as the mean ± SD. *p < 0.05, **p < 0.01, ***p < 0.001, ****p < 0.0001
Fig. 9
Fig. 9
GJB2 is Related to Copper Ionophore-induced Cell Death. A GO enrichment analysis of signaling pathways associated with GJB2-correlated genes (|R|> 0.45, p < 0.001). B Analysis of GJB2, FDX1, DLAT, LIAS, and PDHB expression in GJB2-overexpressing OC cells by qPCR. CD HO 8910 and A2780 cells were exposed to different doses of Elesclomol-CuCl2 for 24 h and detected by CCK-8 reagent. E Representative images of OC cells treated with Elesclomol-CuCl2 with or without TTM for 24 h. Scale bars represent 200 μm. F The rescue effect of TTM in HO 8910 and A2780 treated with Elesclomol-CuCl2 was explored through CCK-8 assay. GJ HO 8910 and A2780 cells transfected with GJB2-OE were treated with various concentrations of elesclomol for 24 h. Cell viability was evaluated by CCK-8 assay. In all statistical plots, data are expressed as the mean ± SD. *p < 0.05, **p < 0.01, ***p < 0.001, ****p < 0.0001
Fig. 10
Fig. 10
GJB2 Inhibits the Infiltration of CD8+ T Cells and Promotes Immune Escape. (A-C) Violin plot illuminating the difference of the TIDE score A, Dysfunction score B, and Exclusion score C between the GJB2 high- and low-expression groups. D Box plot displaying differential expression of immune checkpoints between GJB2 high- and low-expression groups. E CD8+ T cell migration to lower chambers was quantified following GJB2 overexpression in OC cells. F Flow cytometry analysis of Granzyme B (GZMB) and IFN-γ secretion by CD8+ T cells co-cultured with GJB2-overexpressing OC cells (E: T ratio = 5:1). In all statistical plots, data are expressed as the mean ± SD. *p < 0.05, **p < 0.01, ***p < 0.001, ****p < 0.0001

Similar articles

References

    1. Siegel RL, Giaquinto AN, Jemal A (2024) Cancer statistics, 2024. CA Cancer J Clin 74:12–49. 10.3322/caac.21820 - PubMed
    1. Kuroki L, Guntupalli SR (2020) Treatment of epithelial ovarian cancer. BMJ 371:m3773. 10.1136/bmj.m3773 - PubMed
    1. Wilson MK, Pujade-Lauraine E, Aoki D et al (2017) Fifth ovarian cancer consensus conference of the gynecologic cancer InterGroup: recurrent disease. Ann Oncol 28:727–732. 10.1093/annonc/mdw663 - PMC - PubMed
    1. Zhang L, Zhao W, Huang J et al (2022) Development of a dendritic cell/tumor cell fusion cell membrane nano-vaccine for the treatment of ovarian cancer. Front Immunol 13:828263. 10.3389/fimmu.2022.828263 - PMC - PubMed
    1. Marrelli D, Ansaloni L, Federici O et al (2022) Cytoreductive surgery (CRS) and HIPEC for advanced ovarian cancer with peritoneal metastases: Italian PSM oncoteam evidence and study purposes. Cancers (Basel). 10.3390/cancers14236010 - PMC - PubMed

Publication types