. 2025 May 15;26(1):493.
doi: 10.1186/s12864-025-11668-w.

Genome-wide enhancer-gene regulatory maps of liver reveal novel regulatory mechanisms underlying NAFLD pathogenesis

Affiliations

Genome-wide enhancer-gene regulatory maps of liver reveal novel regulatory mechanisms underlying NAFLD pathogenesis

Ruofan Li et al. BMC Genomics. .

Abstract

Introduction: Non-alcoholic fatty liver disease (NAFLD) represents the most widespread liver disease globally, ranging from non-alcoholic fatty liver (NAFL) and steatohepatitis (NASH) to fibrosis/cirrhosis, with potential progression to hepatocellular carcinoma (HCC). Genome-wide association studies (GWASs) have identified several single nucleotide polymorphisms (SNPs) associated with NAFLD. However, numerous GWAS signals associated with NAFLD locate in non-coding regions, posing a challenge for interpreting their functional annotation.

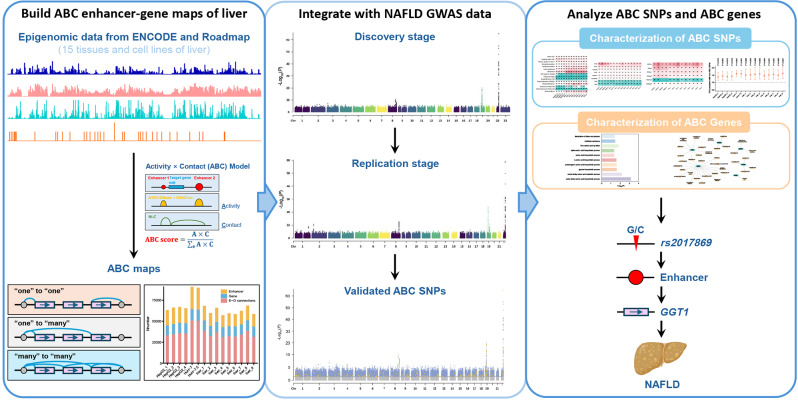
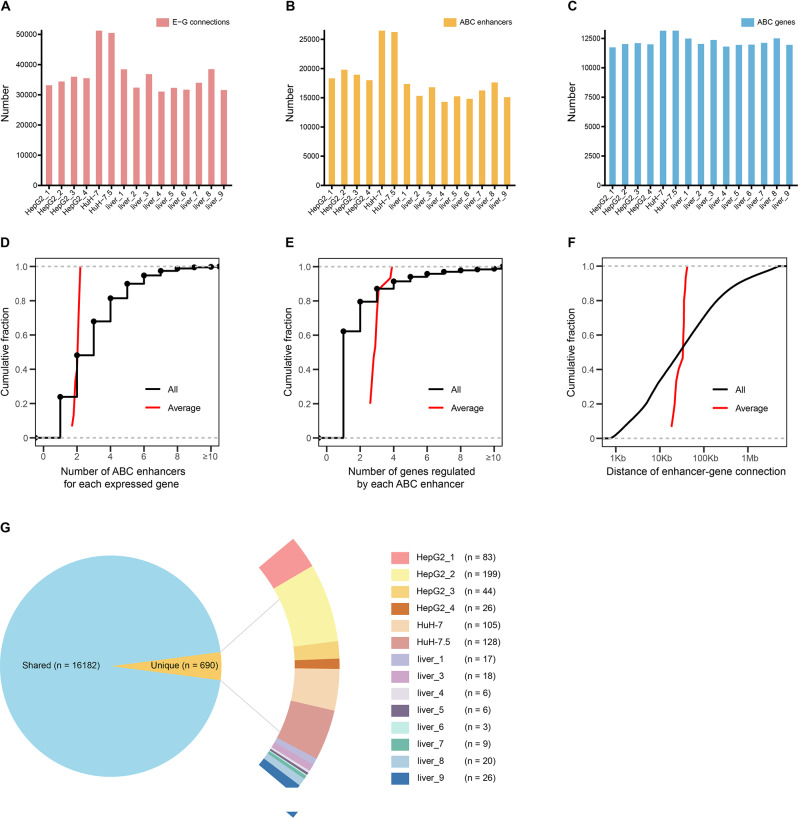
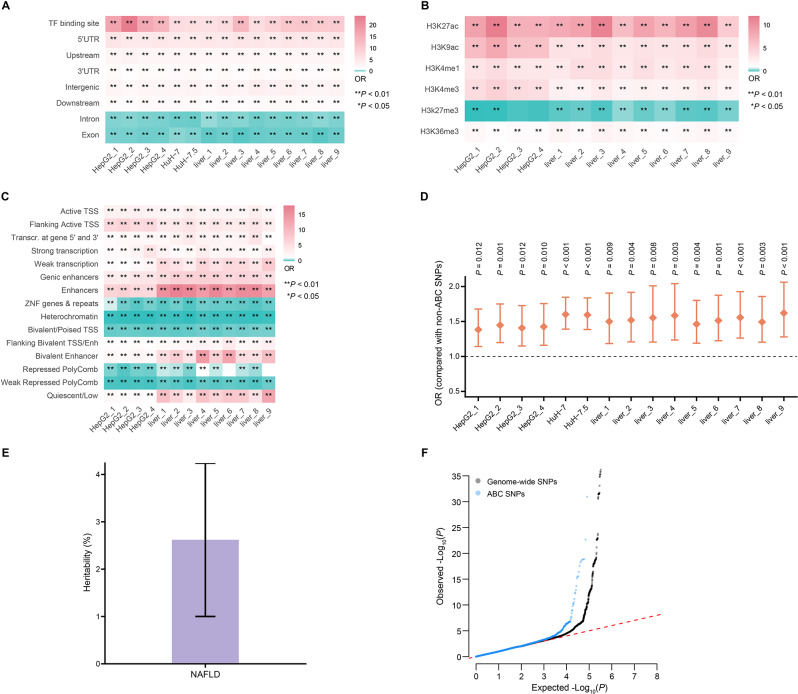
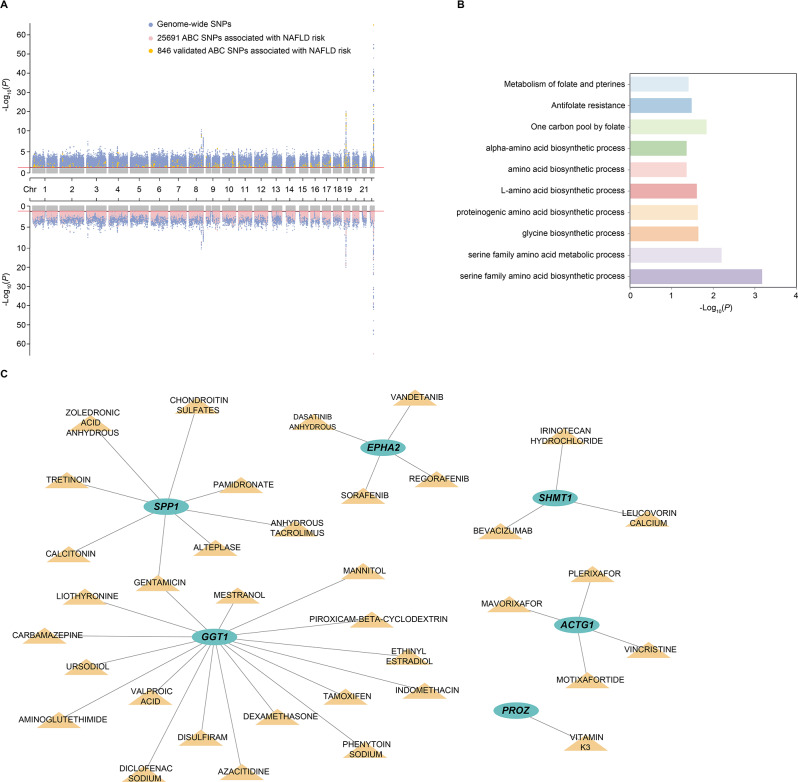
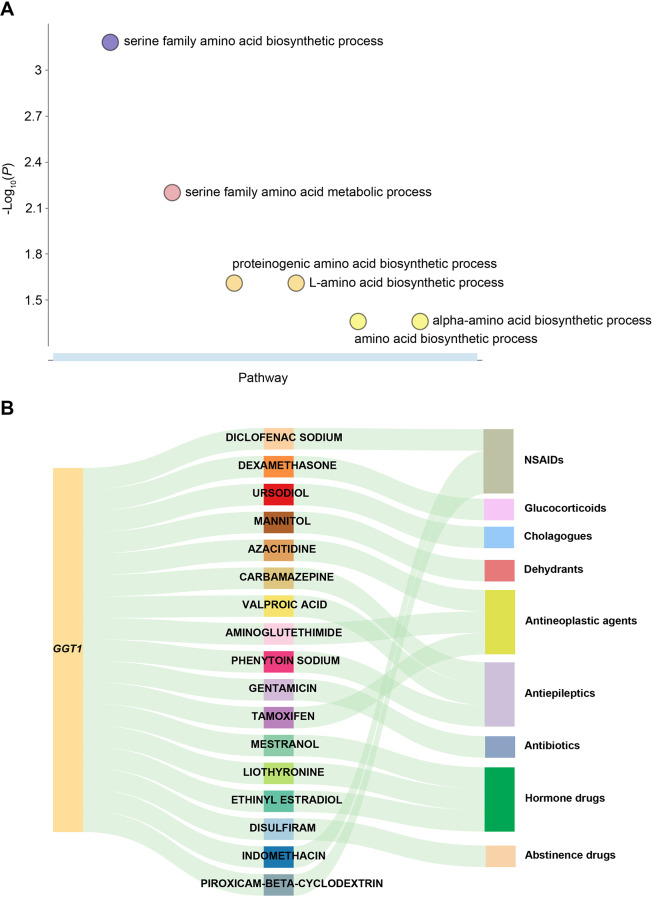
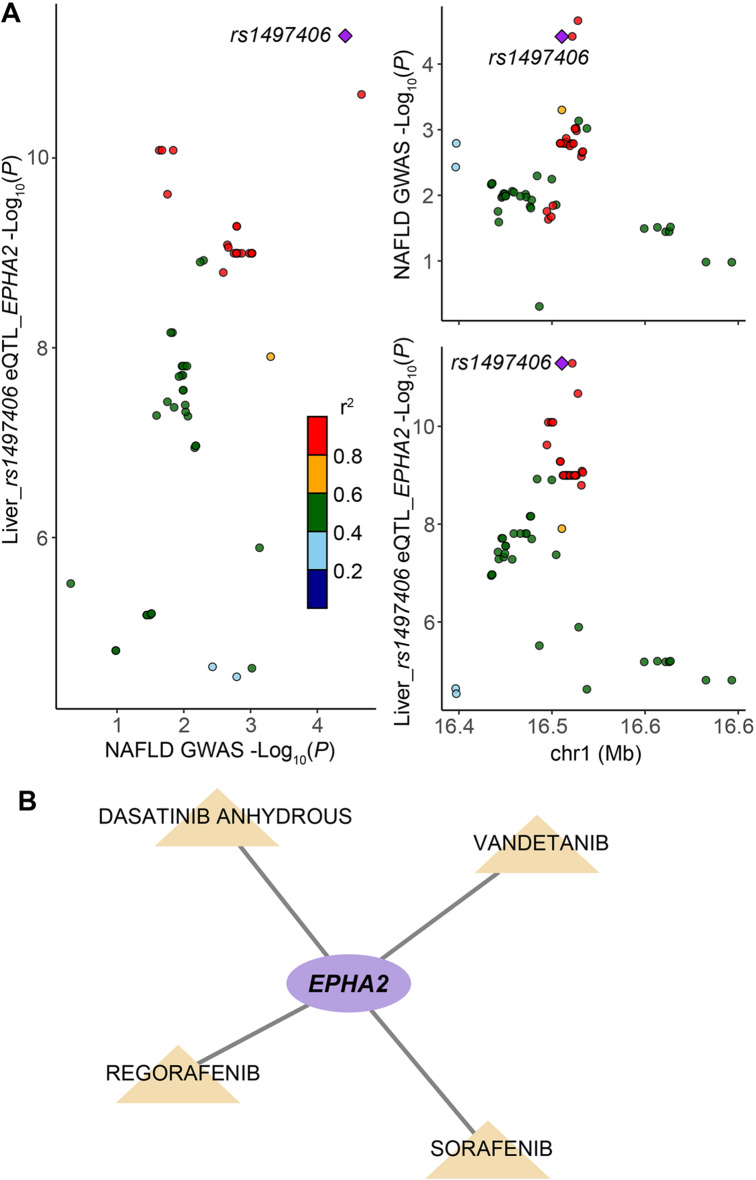
Results: In this study, we utilized the Activity-by-Contact (ABC) model to construct the enhancer-gene maps of liver by integrating epigenomic data from 15 liver tissues and cell lines. We constructed the most comprehensive genome-wide regulatory maps of the liver, identifying 543,486 enhancer-gene connections, including 267,857 enhancers and 16,872 target genes. Enrichment analyses revealed that the ABC SNPs are significantly enriched in active chromatin regions and active chromatin state. By combining the ABC regulatory maps and NAFLD GWAS data, we systematically identified ABC SNPs associated with NAFLD risk. Through the functional annotations, such as pathway enrichment and drug-gene interaction analyses, we identified 6 genes (GGT1, ACTG1, SPP1, EPHA2, PROZ and SHMT1) as candidate NAFLD genes, with SHMT1 previously reported. Among the SNPs connected to the candidate genes, the ABC SNP rs2017869 (odds ratio [OR] for the C allele = 1.10, 95% CI = 1.04-1.16, P = 5.97 × 10- 4) had the highest ABC score. According to the ABC maps, rs2017869 links to GGT1, and several drugs targeting this gene, such as liothyronine, showed potential benefits to patients with NAFLD. Furthermore, we identified that another novel gene, EPHA2, may play a crucial role in NAFLD by regulating the GGT levels.

Conclusions: Our study provides the most comprehensive ABC regulatory maps of the liver to date. This resource offers a valuable reference for identifying regulatory variants and prioritizing susceptibility genes of liver diseases, such as NAFLD.

Keywords: GGT1; Genome-wide association study; Non-alcoholic fatty liver disease; Single nucleotide polymorphism.


Conflict of interest statement

Declarations. Ethics approval and consent to participate: Ethical approval was obtained from the original studies. Consent for publication: Not applicable. Competing interests: The authors declare no competing interests.

Figures

Fig. 1
Fig. 1
Study overview. Left: Construction of the ABC enhancer-gene maps of liver. The epigenomic data, including ATAC-seq, DNase-seq, H3K27ac ChIP-seq and HiC-seq data were from 15 liver biosamples. The bar chart represents the characteristics of ABC maps. Middle: We integrated the constructed ABC regulatory maps of liver and the NAFLD GWASs. Manhattan plots show the genome-wide association statistics of the discovery and replication cohorts, and the validated ABC SNPs. Right: The characterization of ABC SNPs and target genes, with the graphic summary of connecting rs2017869 within the non-coding region to NAFLD pathogenesis. Heatmaps show the characterization of ABC SNPs. Bar chart of pathway enrichment analyses and drug-gene interaction network represent the characterization of ABC genes. ABC, Activity-by-Contact; ATAC-seq, assay for transposase-accessible chromatin using sequencing; DNase-seq, DNase I hypersensitive sites sequencing; H3K27ac ChIP-seq, H3K27ac chromatin immunoprecipitation sequencing; Hi-C, high-throughput chromosome conformation capture; NAFLD, non-alcoholic fatty liver disease; GWAS, genome-wide association study; SNP, single nucleotide polymorphism; GGT1, gamma-glutamyltransferase 1
Fig. 2
Fig. 2
Liver-specific genome-wide enhancer-gene maps landscape. (A-C) Bar charts represent the number of enhancer-gene connections (E-G connections) (A), ABC enhancers (B) and ABC genes (C) in each liver biosample. (D) Cumulative fractions of the number of enhancers predicted to regulate each gene in each liver biosample (black line; mean = 2.0) and the mean number of enhancers predicted to regulate each gene in each liver biosample (red line; median = 2.1). (E) Cumulative fractions of the number of genes regulated by each ABC enhancer in each liver biosample (black line; mean = 3.0) and the mean number of genes regulated by each ABC enhancer in each liver biosample (red line; median = 2.9). (F) Cumulative fractions of the genomic distances between the enhancer and the gene for each predicted enhancer-gene connection in each liver biosample (black line; median = 28,036 bp) and the median genomic distance between each enhancer-gene connection in each liver biosample (red line; median = 33,629 bp). (G) Among all identified ABC genes, 690 (4.1%) were uniquely detected in their respective biosamples. Compared to ABC maps constructed from a single liver biosample (e.g., HepG2_1), this analysis identified an additional 607 ABC genes. ABC, Activity-by-Contact
Fig. 3
Fig. 3
Characterization of ABC SNPs. (A) Heatmap shows the genomic distribution of ABC SNPs compared with non-ABC SNPs. P-values were calculated by two-tailed Fisher’s exact test. (B) Heatmap shows the histone modification enrichment of ABC SNPs in regulatory elements including H3K27ac, H3K9ac, H3K4me1, H3K4me3, H3K27me3, and H3K36me3, compared with non-ABC SNPs. P-values were calculated by two-tailed Fisher’s exact test. (C) Heatmap shows the chromatin state enrichment of ABC SNPs compared with non-ABC SNPs. P-values were calculated by two-tailed Fisher’s exact test. (D) Enrichment analyses of ABC SNPs in FinnGen NAFLD-related GWAS SNPs compared with non-ABC SNPs. P-values were calculated by two-tailed Fisher’s exact test and bars indicate 95% CIs. (E) Proportion of GWAS heritability of NAFLD explained by ABC SNPs. The error bars represent standard error. (F) Quantile-quantile (QQ) plots of P values from GWAS of NAFLD. ABC SNPs were shown in comparison with genome-wide SNPs. ABC, Activity-by-Contact; SNP, single nucleotide polymorphism; H3K27ac, H3K27 acetylation marks; H3K9ac, H3K9 acetylation marks; H3K4me1, H3K4 monomethylation marks; H3K4me3, H3K4 trimethylation marks; H3K27me3, H3K27 trimethylation marks; H3K36me3, H3K36 trimethylation marks; NAFLD, non-alcoholic fatty liver disease; TSS, transcription start site; Transcr., transcription; Ehn, enhancers; GWAS, genome-wide association study; OR, odds ratio; CI, confidence interval
Fig. 4
Fig. 4
Characterization of ABC genes associated with NAFLD. (A) Manhattan plots for the associations between ABC SNPs and NAFLD risk in NAFLD GWAS data. The grey dots represent the SNPs that are not associated with NAFLD risk (P > 0.05). The blue dots represent the genome-wide SNPs associated with NAFLD risk (P < 0.05). The pink dots represent the ABC SNPs associated with NAFLD risk (P < 0.05) in the discovery stage. The yellow dots represent the validated ABC SNPs in the replication stage (P < 0.05). The red line indicates the significance threshold of P = 0.05. The x-axis represents the genomic position (human genome assembly hg38), and the y-axis shows the -log10(P). (B) Bar chart shows the results of pathways enrichment analyses. (C) Drug-gene interaction network. ABC, Activity-by-Contact; SNP, single nucleotide polymorphism; NAFLD, non-alcoholic fatty liver disease; GWAS, genome-wide association study
Fig. 5
Fig. 5
Associated pathways and drugs of GGT1 at 22q11.23. (A) Bubble plot shows the pathways associated with GGT1. The x-axis represents the enriched pathways, while the y-axis represents the -log10(P). (B) Sankey diagram indicates the identified drugs of drug-gene interaction analyses from DGIdb targeting GGT1. The right blocks indicate the corresponding categories of these drugs. GGT1, gamma-glutamyltransferase 1; DGIdb, Drug-Gene Interaction Database
Fig. 6
Fig. 6
EPHA2 at 1p36.13. (A) The NAFLD GWAS summary statistics were obtained from the FinnGen study. The liver eQTL summary statistics for EPHA2 were downloaded from GTEx v8. The LD values (r2) between the SNP rs1497406 and the other SNPs are based on European populations (from the 1,000 Genomes Project, Phase 3). The colocalization analyses were performed using the R package “coloc” (v5.2.3) and achieved a posterior probability of hypothesis 4 (PP.H4) score of 0.98, suggesting that the eQTLs and GWAS associations were highly likely to colocalize. (B) Drug-gene interaction network indicates the identified drugs of drug-gene interaction analyses from DGIdb targeting EPHA2. EPHA2, EPH receptor A2; NAFLD, non-alcoholic fatty liver disease; GWAS, genome-wide association study; eQTL, expression quantitative trait locus; GTEx, Genotype-Tissue Expression; SNP, single nucleotide polymorphism; LD, linkage disequilibrium; DGIdb, Drug-Gene Interaction Database

Similar articles

References

    1. Rinella ME, Lazarus JV, Ratziu V, Francque SM, Sanyal AJ, Kanwal F, Romero D, Abdelmalek MF, Anstee QM, Arab JP, et al. A multisociety Delphi consensus statement on new fatty liver disease nomenclature. Hepatology. 2023;78(6):1966–86. - PMC - PubMed
    1. Younossi Z, Anstee QM, Marietti M, Hardy T, Henry L, Eslam M, George J, Bugianesi E. Global burden of NAFLD and NASH: trends, predictions, risk factors and prevention. Nat Rev Gastroenterol Hepatol. 2018;15(1):11–20. - PubMed
    1. Riazi K, Azhari H, Charette JH, Underwood FE, King JA, Afshar EE, Swain MG, Congly SE, Kaplan GG, Shaheen AA. The prevalence and incidence of NAFLD worldwide: a systematic review and meta-analysis. Lancet Gastroenterol Hepatol. 2022;7(9):851–61. - PubMed
    1. Pais R, Barritt ASt, Calmus Y, Scatton O, Runge T, Lebray P, Poynard T, Ratziu V, Conti F. NAFLD and liver transplantation: current burden and expected challenges. J Hepatol. 2016;65(6):1245–57. - PMC - PubMed
    1. Brouwers M, Simons N, Stehouwer CDA, Isaacs A. Non-alcoholic fatty liver disease and cardiovascular disease: assessing the evidence for causality. Diabetologia. 2020;63(2):253–60. - PMC - PubMed

MeSH terms