

Influence of the metabolic and inflammatory profile in patients with frozen shoulder - systematic review and meta-analysis
- PMID: 40375116
- PMCID: PMC12079921
- DOI: 10.1186/s12891-025-08706-9
Influence of the metabolic and inflammatory profile in patients with frozen shoulder - systematic review and meta-analysis
Erratum in
-
Correction: Influence of the metabolic and inflammatory profile in patients with frozen shoulder - systematic review and meta‑analysis.BMC Musculoskelet Disord. 2025 Jul 7;26(1):664. doi: 10.1186/s12891-025-08905-4. BMC Musculoskelet Disord. 2025. PMID: 40624649 Free PMC article. No abstract available.
Abstract
Background: Frozen Shoulder (FS), also known as adhesive shoulder capsulitis, is characterized by a fibrotic inflammatory process of unknown origin, with the most prominent symptoms being pain, stiffness, and reduced joint mobility.
Methods: The systematic review and meta-analysis presented herein provide insights into the pathogenesis of this condition, as well as common metabolic biomarkers potentially implicated in FS, such as glycated hemoglobin (HbA1c), and inflammatory biomarkers, including interleukins (IL-1, IL-6) and tumor necrosis factor alpha (TNF-α). Dyslipidemia and hormonal factors, such as thyroid dysfunctions, are also examined.
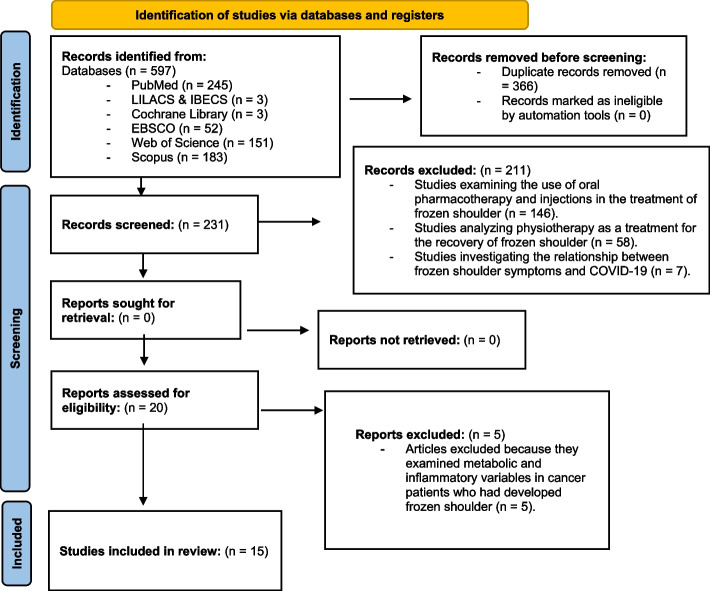
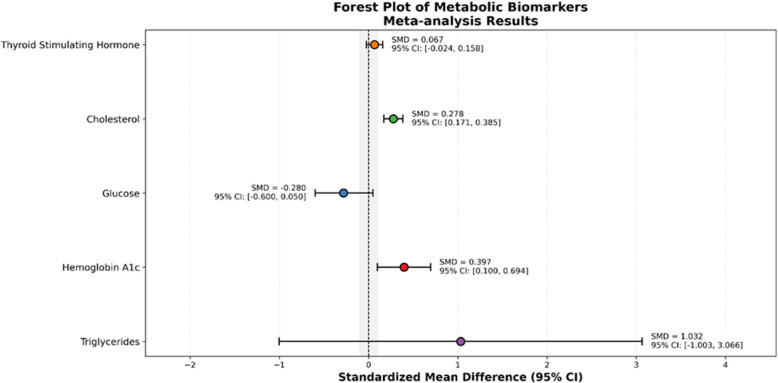
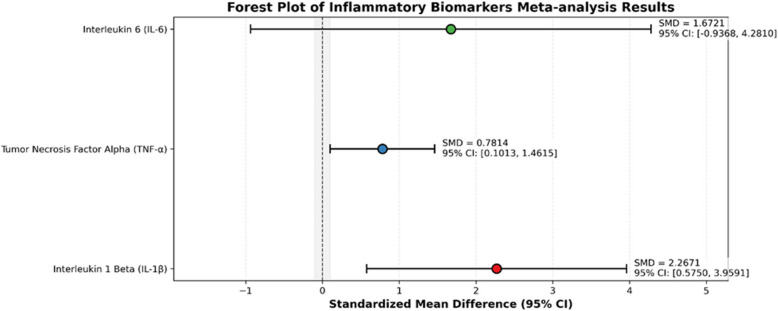
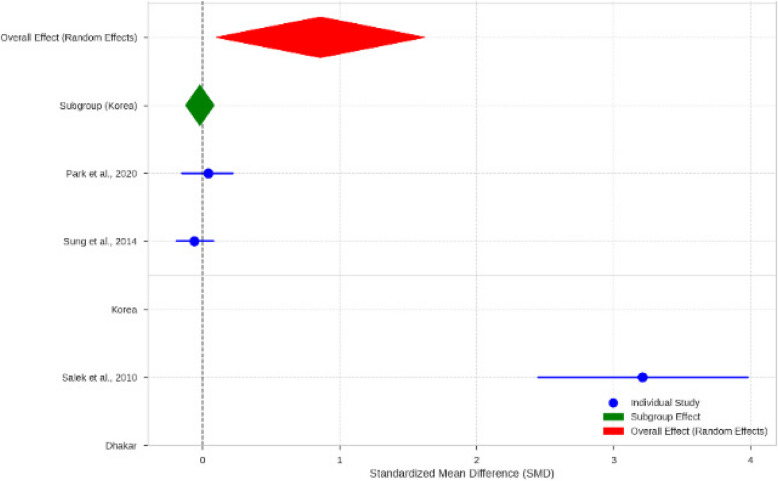
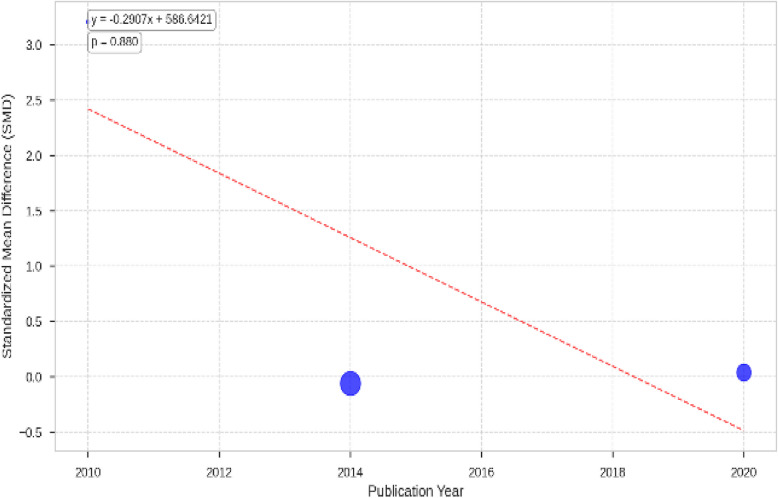
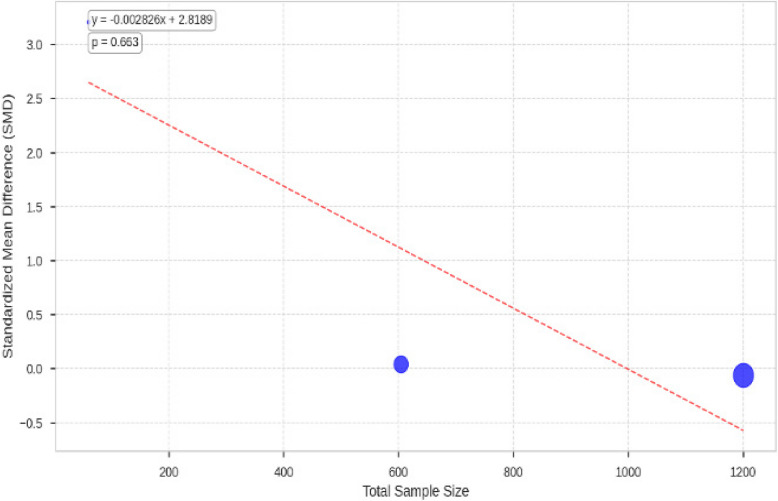
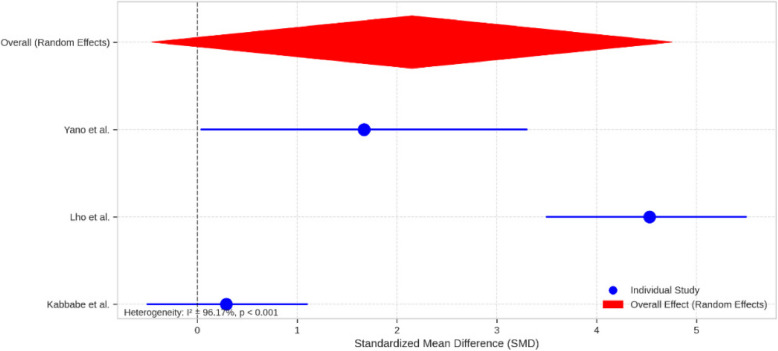
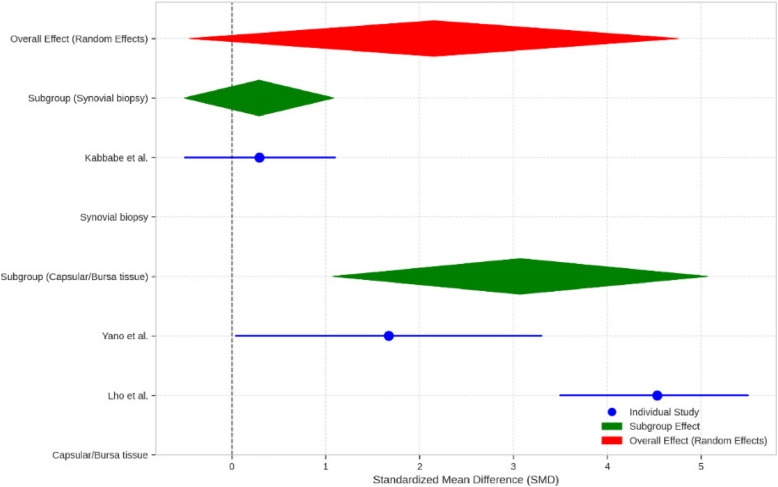
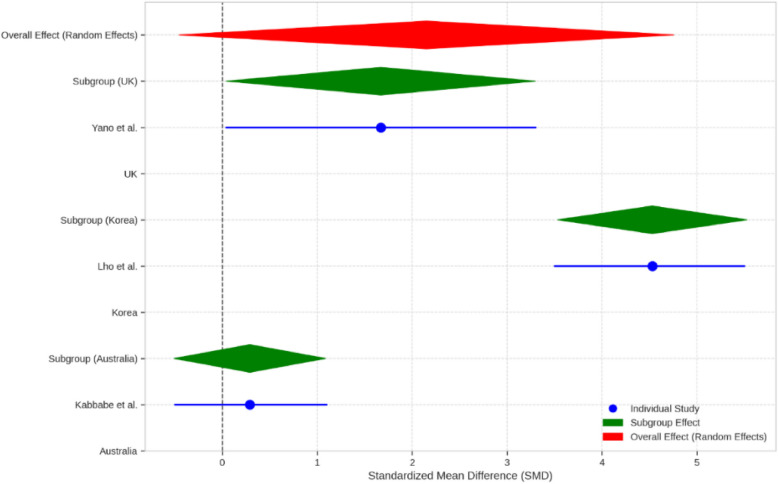
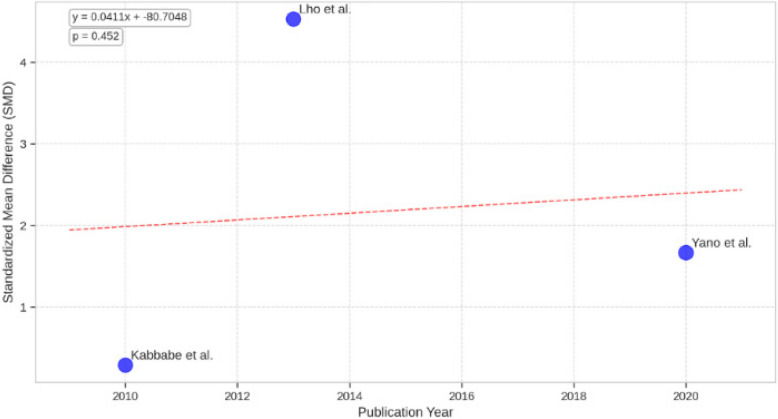
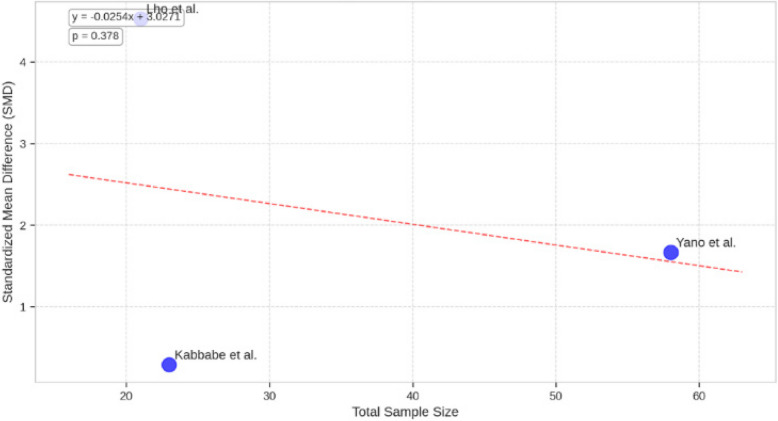
Results: A total of 7,499 individuals were included in the meta-analysis, and one additional study collected 28,416 blood samples from individuals with FS from biobanks. The meta-analysis of metabolic variables showed that HbA1c was the most significantly elevated marker in FS, with a standardized mean difference (SMD) of μ^ = 0.3970 (95% CI: 0.0998 to 0.6943), indicating a moderate effect. Glucose showed a mean difference of -0.28 (95% CI: -0.60 to 0.05), which was not statistically significant, suggesting that short-term fluctuations in glucose levels may not be as relevant as long-term metabolic control. Cholesterol had a standardized difference of 0.278 (95% CI: 0.171 to 0.385), being significantly higher in FS. For triglycerides, the SMD was μ^ = 1.0318 (95% CI: -1.0027 to 3.0664), indicating high heterogeneity and preventing a clear conclusion. Hypothyroidism was also evaluated, with a total SMD of 0.067, a total variance of 0.0021, and a 95% confidence interval of -0.024 to 0.158, confirming no association between FS and thyroid function. Regarding inflammatory biomarkers, IL-1β was the most predominant, showing significantly higher levels in FS, with an SMD of μ^ = 2.2671 (95% CI: 0.5750 to 3.9591). TNF-α had a mean difference of μ^ = 0.7814 (95% CI: 0.1013 to 1.4615), reflecting a significant difference from zero (z = 2.2520, p = 0.0243). Finally, IL-6 did not show a significant association, with an SMD of μ^ = 1.6721 (95% CI: -0.9368 to 4.2810).
Conclusion: This meta-analysis highlights the role of metabolic dysfunction and chronic inflammation in the pathogenesis of FS. HbA1c and cholesterol were the most associated metabolic biomarkers, while IL-1β and TNF-α showed a strong link to inflammation and fibrosis. The heterogeneity in triglycerides and IL-6 underscores the need for studies with standardized methodologies and subgroup analyses. Future research should focus on biomarker progression, patient stratification, and new therapeutic strategies targeting metabolic and immune modulation, considering FS within a broader metabolic-inflammatory framework to improve its classification and treatment.
Keywords: Biomarkers; Cytokines; Frozen shoulder; Inflammation; Interleukins; Metabolism.
© 2025. The Author(s).
Conflict of interest statement
Declarations. Ethics approval and consent to participate: Not applicable. Consent for publication: Not applicable. Competing interests: The authors declare no competing interests.
Figures
Similar articles
-
Systemic pharmacological treatments for chronic plaque psoriasis: a network meta-analysis.Cochrane Database Syst Rev. 2017 Dec 22;12(12):CD011535. doi: 10.1002/14651858.CD011535.pub2. Cochrane Database Syst Rev. 2017. Update in: Cochrane Database Syst Rev. 2020 Jan 9;1:CD011535. doi: 10.1002/14651858.CD011535.pub3. PMID: 29271481 Free PMC article. Updated.
-
Systemic pharmacological treatments for chronic plaque psoriasis: a network meta-analysis.Cochrane Database Syst Rev. 2021 Apr 19;4(4):CD011535. doi: 10.1002/14651858.CD011535.pub4. Cochrane Database Syst Rev. 2021. Update in: Cochrane Database Syst Rev. 2022 May 23;5:CD011535. doi: 10.1002/14651858.CD011535.pub5. PMID: 33871055 Free PMC article. Updated.
-
Does Integration of Graded Motor Imagery Training Augment the Efficacy of a Multimodal Physiotherapy Program for Patients With Frozen Shoulder? A Randomized Controlled Trial.Clin Orthop Relat Res. 2025 Apr 1;483(4):707-716. doi: 10.1097/CORR.0000000000003252. Epub 2024 Sep 17. Clin Orthop Relat Res. 2025. PMID: 39436270 Clinical Trial.
-
Home treatment for mental health problems: a systematic review.Health Technol Assess. 2001;5(15):1-139. doi: 10.3310/hta5150. Health Technol Assess. 2001. PMID: 11532236
-
The Black Book of Psychotropic Dosing and Monitoring.Psychopharmacol Bull. 2024 Jul 8;54(3):8-59. Psychopharmacol Bull. 2024. PMID: 38993656 Free PMC article. Review.
Cited by
-
Correction: Influence of the metabolic and inflammatory profile in patients with frozen shoulder - systematic review and meta‑analysis.BMC Musculoskelet Disord. 2025 Jul 7;26(1):664. doi: 10.1186/s12891-025-08905-4. BMC Musculoskelet Disord. 2025. PMID: 40624649 Free PMC article. No abstract available.
-
Impact of a Multimodal Intervention Combining Manual Therapy, Exercise, Reduced Methylxanthine Intake, and Nocturnal Light Avoidance on Inflammatory and Metabolic Profiles, Pain, Functionality, and Sleep Quality in Patients with Frozen Shoulder: A Single-Blind Randomized Controlled Trial.J Clin Med. 2025 Jun 26;14(13):4539. doi: 10.3390/jcm14134539. J Clin Med. 2025. PMID: 40648913 Free PMC article.
-
Frozen Shoulder as a Metabolic Signal: Advocating Routine HbA1c Screening in Atraumatic Cases.Cureus. 2025 Jun 29;17(6):e86999. doi: 10.7759/cureus.86999. eCollection 2025 Jun. Cureus. 2025. PMID: 40746797 Free PMC article.
References
-
- Carette S, Moffet H, Tardif J, Bessette L, Morin F, Frémont P, et al. Intraarticular corticosteroids, supervised physiotherapy, or a combination of the two in the treatment of adhesive capsulitis of the shoulder: a placebo-controlled trial. Arthritis Rheum. 2003;48:829–38. - PubMed
-
- Zuckerman JD, Rokito A. Frozen shoulder: a consensus definition. J Shoulder Elbow Surg. 2011;20:322–5. - PubMed
-
- Millar NL, Meakins A, Struyf F, Willmore E, Campbell AL, Kirwan PD, et al. Frozen shoulder Nat Rev Dis Primer. 2022;8:59. - PubMed
-
- Leafblad N, Mizels J, Tashjian R, Chalmers P. Adhesive Capsulitis. Phys Med Rehabil Clin N Am. 2023;34:453–68. - PubMed
Publication types
MeSH terms
Substances
LinkOut - more resources
Full Text Sources
Medical
Research Materials
