

Development and internal validation of a depressive symptoms prediction model among the patients with cardiovascular disease who have recovered from SARS-CoV-2 infection in Wuhan, China: a cross-sectional study
- PMID: 40375188
- PMCID: PMC12082991
- DOI: 10.1186/s12888-025-06886-1
Development and internal validation of a depressive symptoms prediction model among the patients with cardiovascular disease who have recovered from SARS-CoV-2 infection in Wuhan, China: a cross-sectional study
Abstract
Background: Middle-aged and elderly patients with cardiovascular disease (CVD) who have recovered from SARS-CoV-2 infection may experience depressive symptoms due to the physical and psychological impact of the pandemic.
Objective: To investigate the prevalence and predictors of depressive symptoms among the middle-aged and elderly with CVD who have recovered from SARS-CoV-2 infection in Wuhan, China, and to develop a prediction model for depressive symptoms.
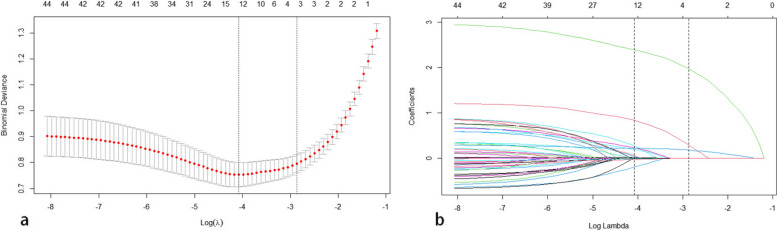
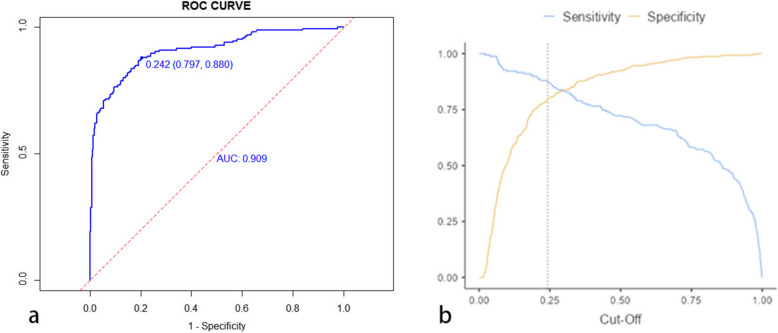
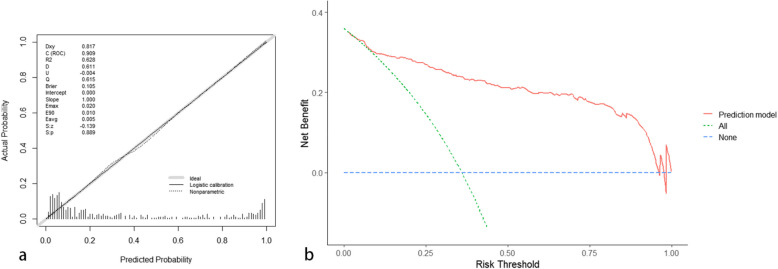
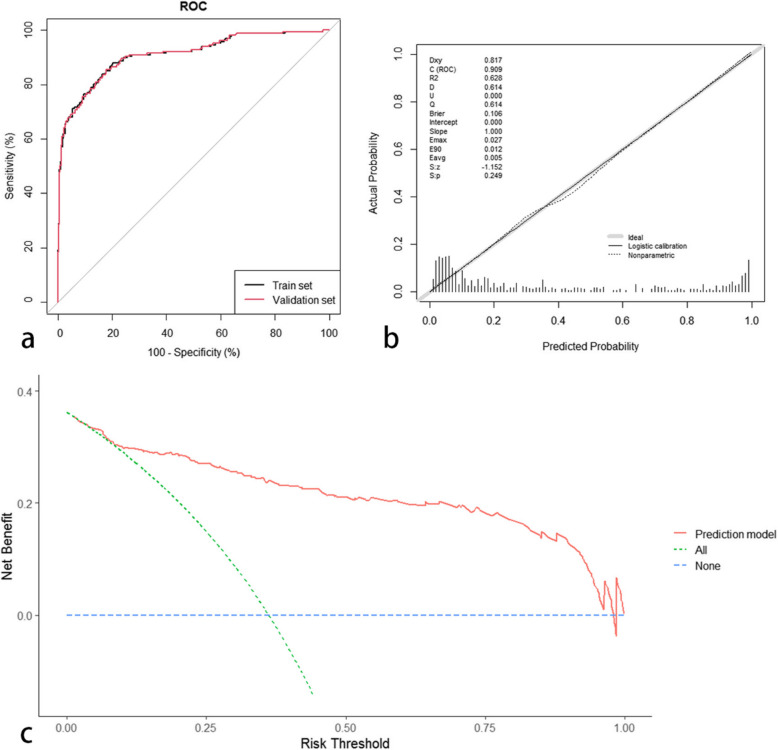
Methods: A cross-sectional study was conducted among 462 former SARS-CoV-2 middle-aged and elderly patients with CVD in Jianghan District, Wuhan, China from June 10 to July 25, 2021. Depressive symptoms were assessed by the Patient Health Questionnaire-9 (PHQ-9). Potential predictors of depressive symptoms were selected by the least absolute shrinkage and selection operator (LASSO) regression. A prediction model was developed by random forest (RF) and logistic regression models and compared by the area under the receiver operating characteristic curve (AUROC). The discrimination, calibration, and practical utility of the prediction model were evaluated by the receiver operating characteristic (ROC) curve, calibration curve, and decision curve analysis (DCA). Bootstrap sampling was used for internal validation.
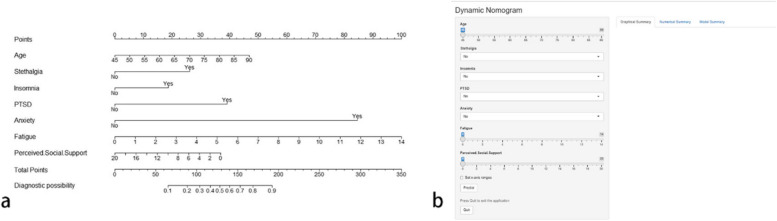
Results: The prevalence of depressive symptoms among the participants was 35.93%. The prediction model included age, stethalgia after recovery, insomnia after recovery, post-traumatic stress disorder (PTSD), anxiety, fatigue, and perceived social support as predictors. The AUROC of the logistic regression model was 0.909 (95%CI: 0.879 ~ 0.939), indicating good discrimination. The calibration curve showed good calibration. The DCA showed that the prediction model had a net benefit for a wide range of risk thresholds. The internal validation confirmed the stability of the prediction model.
Conclusion: Depressive symptoms are common among middle-aged and elderly CVD patients who have recovered from SARS-CoV-2 infection in Wuhan, China. A prediction model with satisfactory performance was developed to estimate the risk of depressive symptoms among this population. Interventions targeting long COVID symptoms and social support should be considered to prevent depressive symptoms in CVD patients.
Keywords: Cardiovascular disease; Depressive symptoms; Prediction model; SARS-CoV-2; The middle-aged and elderly.
© 2025. The Author(s).
Conflict of interest statement
Declarations. Ethics approval and consent to participate: Ethics approval for the questionnaire survey was obtained from the Ethics Review Committee of the Institute of Pathogen Biology, Chinese Academy of Medical Sciences, Beijing, China (IPB- 2020–22). Digital informed consent was obtained from all participants to ensure their voluntary participation. All work involved in this study was performed in accordance with the Declaration of Helsinki. Competing interest: The authors declare no competing interests. Consent for publication: Not applicable.
Figures

Similar articles
-
The association of mindfulness and psychological well-being among individuals who have recovered from COVID-19 in Jianghan District, Wuhan, China: A cross-sectional study.J Affect Disord. 2022 Dec 15;319:437-445. doi: 10.1016/j.jad.2022.09.062. Epub 2022 Sep 23. J Affect Disord. 2022. PMID: 36162667 Free PMC article.
-
Analysis of risk factors and construction of a prediction model for posttraumatic stress disorder among Chinese college students during the COVID-19 pandemic.J Affect Disord. 2024 Oct 1;362:230-236. doi: 10.1016/j.jad.2024.06.111. Epub 2024 Jul 3. J Affect Disord. 2024. PMID: 38969024
-
Geographic Distribution of Mental Health Problems Among Chinese College Students During the COVID-19 Pandemic: Nationwide, Web-Based Survey Study.J Med Internet Res. 2021 Jan 29;23(1):e23126. doi: 10.2196/23126. J Med Internet Res. 2021. PMID: 33439853 Free PMC article.
-
Prevalence of depressive symptoms and correlates among individuals who self-reported SARS-CoV-2 infection after optimizing the COVID-19 response in China.Front Public Health. 2024 Jan 8;11:1268799. doi: 10.3389/fpubh.2023.1268799. eCollection 2023. Front Public Health. 2024. PMID: 38259743 Free PMC article.
-
The correlation between lifestyle health behaviors, coping style, and mental health during the COVID-19 pandemic among college students: Two rounds of a web-based study.Front Public Health. 2023 Jan 12;10:1031560. doi: 10.3389/fpubh.2022.1031560. eCollection 2022. Front Public Health. 2023. PMID: 36711327 Free PMC article.
References
-
- Zhou M, et al. Cause-specific mortality for 240 causes in China during 1990–2013: a systematic subnational analysis for the Global Burden of Disease Study 2013. Lancet. 2016;387(10015):251–72. - PubMed
-
- Zhao D, et al. Epidemiology of cardiovascular disease in China: current features and implications. Nat Rev Cardiol. 2019;16(4):203–12. - PubMed
-
- Xu WQ, et al. Prevalence and correlates of depressive and anxiety symptoms among adults in Guangdong Province of China: A population-based study. J Affect Disord. 2022;308:535–44. - PubMed
-
- Jurgens CY, et al. State of the Science: The Relevance of Symptoms in Cardiovascular Disease and Research: A Scientific Statement From the American Heart Association. Circulation. 2022;146(12):e173–84. - PubMed
-
- Michal M, Beutel M. Mental disorders and cardiovascular disease: what should we be looking out for? Heart. 2021;107(21):1756–61. - PubMed
Publication types
MeSH terms
Grants and funding
LinkOut - more resources
Full Text Sources
Medical
Miscellaneous
