. 2025 May 15;24(1):142.
doi: 10.1186/s12943-025-02335-5.

Dissecting small cell carcinoma of the esophagus ecosystem by single-cell transcriptomic analysis

Affiliations

Dissecting small cell carcinoma of the esophagus ecosystem by single-cell transcriptomic analysis

Hao-Xiang Wu et al. Mol Cancer. .

Abstract

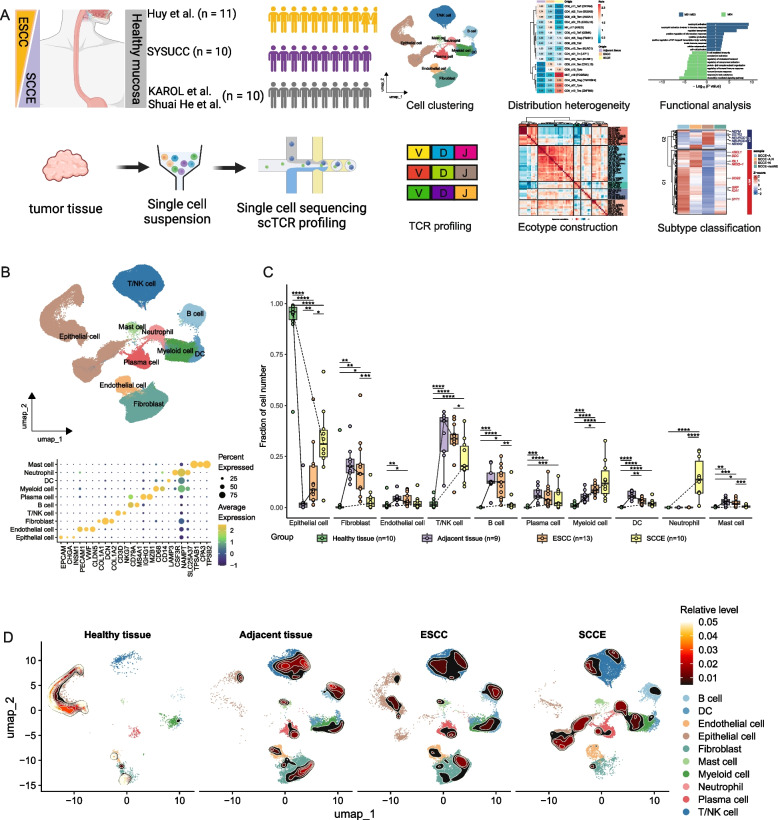
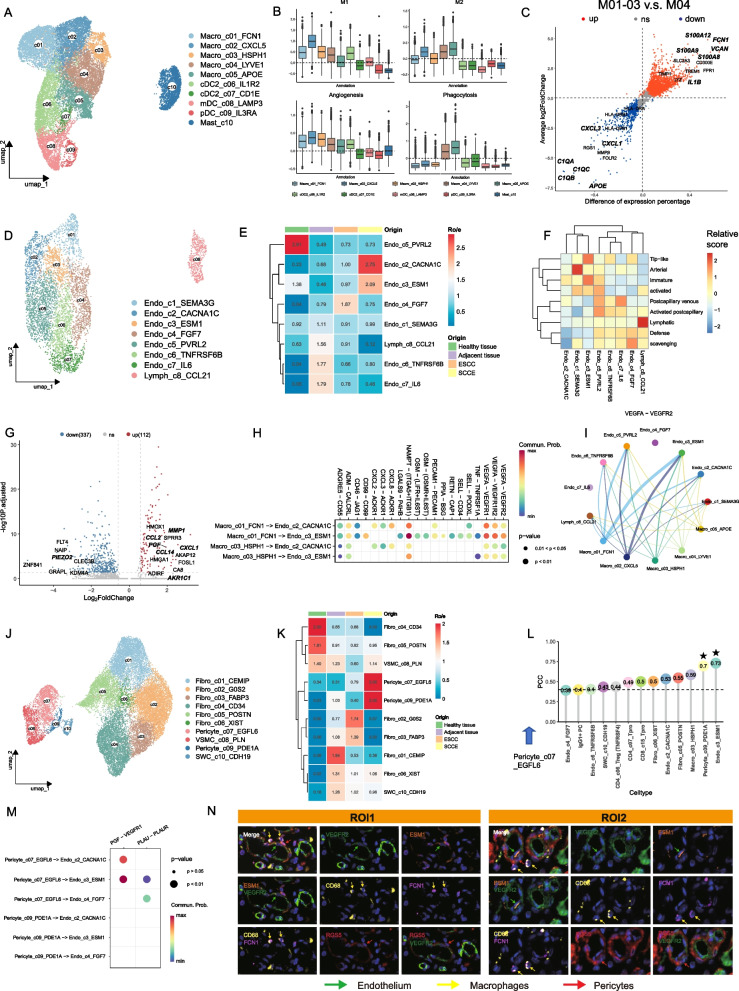
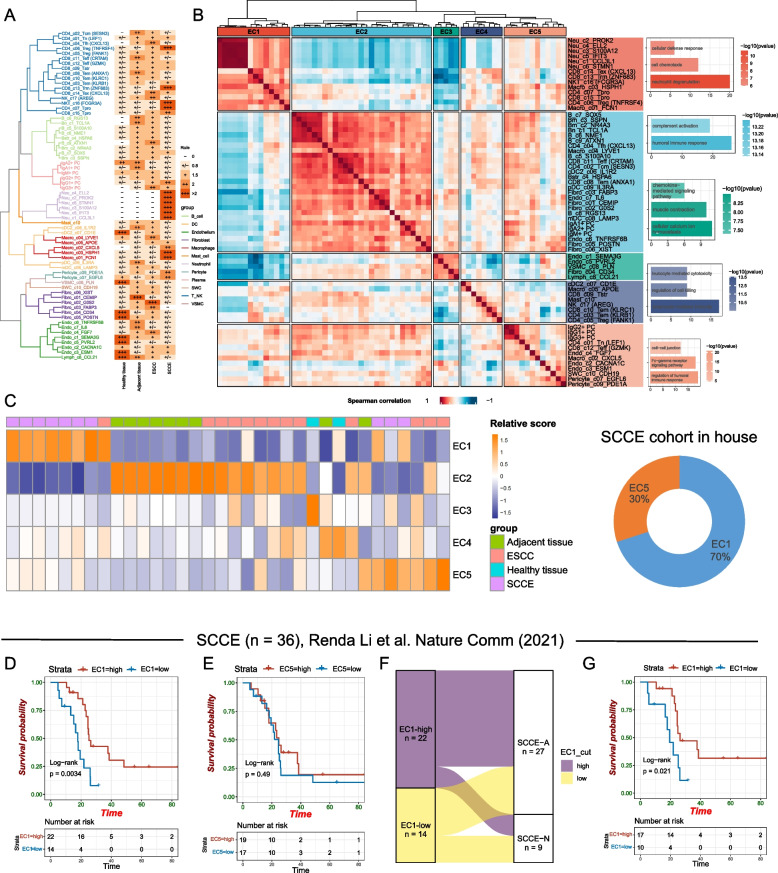
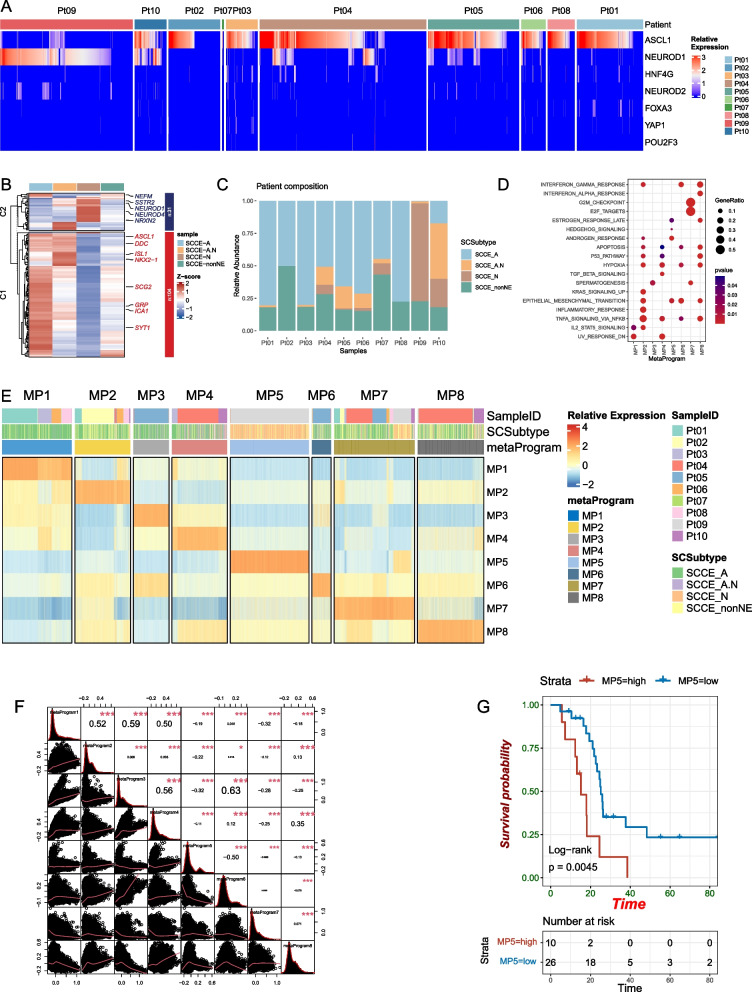
Small cell carcinoma of the esophagus (SCCE) is an aggressive and rare neuroendocrine malignancy with poor prognosis. Here, we firstly performed single-cell transcriptional profiling derived from 10 SCCE patients, with normal esophageal mucosa, adjacent non-malignant tissue and tumors from esophageal squamous cell carcinoma (ESCC) as reference. We observed enrichment of activated regulatory T cells and an angiogenesis-induced niche existed in SCCE compared with ESCC, revealing an immune suppressive and vessel-induced tumor microenvironment (TME) in SCCE. Totally, we identified five TME ecotypes (EC1 ~ 5). Notably, EC1 was highly enriched in SCCE, associating with molecular subtyping and survival outcomes. To dissecting heterogeneity of epithelium in SCCE, we constructed eight transcriptional metaprograms (MPs) that underscored significant heterogeneity of SCCE. High expression of MP5 was linked to neuroendocrine phenotype and poor clinical survival. Collectively, these results, for the first time, systematically deciphered the TME and epithelial heterogeneity of SCCE and provided evidences that SCCE patients might benefit from anti-angiogenesis therapy.


Conflict of interest statement

Declarations. Ethics approval and consent to participate: This study was approved by the Ethics Committees of Sun Yat-sen University Cancer Center (No. B2020 - 311–01). Written informed consent was obtained from all patients in this study. Consent for publication: Not applicable. Competing interests: The authors declare no competing interests.

Figures

Fig. 1
Fig. 1
Single cell landscape of immune, stroma and epithelial cells of esophageal comparative cohorts. A Scheme of the overall study design. B UMAP visualization of the major cell clusters including 197,858 high-quality single cells from 42 samples collected from 31 candidates (10 HCs, 11 pts with ESCC, 10 pts with SCCE). C Box and whisker plots showing the fraction of cell types originating from four groups in each major cell cluster with plot center, box and whiskers corresponding to median, interquartile range (IQR) and 1.5 × IQR, respectively (*P < 0.05, **P < 0.01, ***P < 0.001, ****P < 0.0001). D UMAP plots, as shown in (B), showing TME cell clusters and cell distribution density (shown as thermodynamic chart) across different tissue groups
Fig. 2
Fig. 2
T cell characterization across different tissue groups in esophageal comparative cohorts. A UMAP visualization of T cells separated into 17 subsets. B Heatmap displaying the tissue distribution preference of T and NK cells through ratio of observed to expected cell numbers (Ro/e). C Bubble heatmap displaying expression levels of selected markers in T and NK cells. D Evolutionary lineage of CD8 T cells inferred by slingshot. E The same as D) but displayed in different tissue origin facets. F Expression of cytotoxic and dysfunction signatures among CD8 T cell subsets. G Relative expression of immune check points in CD8, CD4, NK subsets among different tissue origins, shown in heatmap. H UMAP visualization of Treg cells separated into 5 subsets. I Evolutionary lineage of Treg cells inferred by slingshot. J Expression levels of selected markers in Treg cells. K Boxplot comparison of Treg cell clusters among different tissue origins. L The composition of Treg cells among different tissues, shown in stack plot
Fig. 3
Fig. 3
B and plasma cells characterization across different tissue groups in esophageal comparative cohorts. A UMAP visualization of B cells separated into 9 subsets. B Heatmap displaying the tissue distribution preference of B cells through ratio of observed to expected cell numbers (Ro/e). C Expression levels of selected markers in B cells, shown in violin plot. D Expression of antigen presentation and positive immune regulation signatures among B cell subsets. E UMAP visualization of Plasma cells separated into 6 subsets. F The composition of different plasma cell clusters among different tissues, shown in stack plot. G Cell differentiation inferred by Cytotrace software. High cytotrace predicted score suggested that the cellular clusters have high stemness. H The comparison of lgG/lgA between different tissue origins
Fig. 4
Fig. 4
Myeloid and stromal characterization across different tissue groups in esophageal comparative cohorts. A UMAP visualization of myeloid cells separated into 10 subsets. B Expression of M1, M2, angiogenesis, phagocytosis signatures among different myeloid subsets. C Differentiated expressed genes between M01-M03 enriched in SCCE and M04 enriched in ESCC. The x-axis represents the difference of cellular proportion between two originated macrophages, while y-axis refers to average log2 FoldChange of each gene. D UMAP visualization of endothelial cells separated into 8 subsets. E Heatmap displaying the tissue distribution preference of endothelial cells through ratio of observed to expected cell numbers (Ro/e). F Relative expression of endothelium-related functional signatures among different endothelium subsets, shown in heatmap. Differentiated expressed genes between E02-E03 enriched in SCCE and E04 enriched in ESCC. The x-axis represents log2foldchange of each gene between two originated endothelial subsets, while y-axis refers to -log10P.adjusted. H Cell–cell communication probability between M01, 03 and E02, 03 was calculated by cellchat. I The VEGFA-VEGFR2 signaling pathway between macrophage and endothelial cell clusters, scaled by weight. J UMAP visualization of stromal cells separated into 10 subsets. K Heatmap displaying the tissue distribution preference of stromal cells through ratio of observed to expected cell numbers (Ro/e). L Correlation coefficient between cell proportions of Pericyte_c07_EGFL6 and other TME cell subsets. M Cell–cell communication probability between pericyte_c07, c09 and E02, 03, 04 was calculated by cellchat. N Two representative regions of interest in multicolor IHC staining of SCCE patient. Magnification 40X
Fig. 5
Fig. 5
Ecotypes of TME components among different tissue origins and their clinical relevance. A Unsupervised hierarchical clustering of 66 TME cell subsets (left) and tissue preferable distribution estimated by Ro/e, shown in heatmap (right). B Five ecotypes identified based on 66 TME cell subsets (left) and GO enrichment analysis based on gene signatures of five ecotypes. C Relative signature expression of five ecotypes among 31 samples (left) and ecotype assignment in SCCE cohort (right). D, E Clinical relevance of EC1 and EC5 in SCCE RNA-seq external validation cohort. F Relationship of EC1 signature expression and molecular subtype of SCCE. G Clinical relevance of EC1 in SCCE-A subtype
Fig. 6
Fig. 6
Heterogeneity of SCCE defined by classical TFs expression and metaprograms. A Expression of neuroendocrine markers on single cell level from ten patients, including ASCL1, NEUROD1, HNF4G, NEUROD2, FOXA3, YAP1, POU2P3. B Expression of signatures of SCCE-A/N among four SCCE molecule subtypes, shown in heatmap. C Composition of different subtypes of epithelial cells in each SCCE patient. D Gene set enrichment with signature genes of each MP and the significantly enriched gens sets from MSigDB HALLMARK collection are shown. E Scaled signature scores of each MP (rows) across all individual malignant cells (columns). Cells are ordered based on the strength of the GM signature score. F Relationship of each pair of metaprogram. G Clinical relevance of MP5 in SCCE RNA-seq external validation cohort

Similar articles

Cited by

References

    1. Shah MA, Altorki N, Patel P, Harrison S, Bass A, Abrams JA. Improving outcomes in patients with oesophageal cancer. Nat Rev Clin Oncol. 2023;20(6):390–407. - PubMed
    1. Zhang C, Zhang G, Xue L, Zhang Z, Zeng Q, Wu P, et al. Patterns and prognostic values of programmed cell death-ligand 1 expression and CD8 + T-cell infiltration in small cell carcinoma of the esophagus: a retrospective analysis of 34 years of National Cancer Center data in China. Int J Surg. 2024;110(7):4297–309. - PMC - PubMed
    1. Zhu J, Wang Y, Sun H, Zhang Y, Zhang W, Shen W, et al. Surgery versus radiotherapy for limited-stage small cell esophageal carcinoma: a multicenter, retrospective, cohort study in China (ChiSCEC). Int J Surg. 2024;110(2):956–64. - PMC - PubMed
    1. Chen S, Wang XM, Wu F, Huang C, Gao TT, Zhang ZW, et al. Primary small cell carcinoma of the esophagus in a large multicenter cohort: prognostic factors and treatment strategies in the modern era. Int J Radiat Oncol Biol Phys. 2023;117(2):e286–7.
    1. Xu L, Li Y, Liu X, Sun H, Zhang R, Zhang J, et al. Treatment strategies and prognostic factors of limited-stage primary small cell carcinoma of the esophagus. J Thorac Oncol. 2017;12(12):1834–44. - PubMed

MeSH terms

Substances

LinkOut - more resources