. 2025 May 15;23(1):135.
doi: 10.1186/s12915-025-02237-4.

Tyrosinase in melanoma inhibits anti-tumor activity of PD-1 deficient T cells

Affiliations

Tyrosinase in melanoma inhibits anti-tumor activity of PD-1 deficient T cells

Rong Huang et al. BMC Biol. .

Erratum in

Abstract

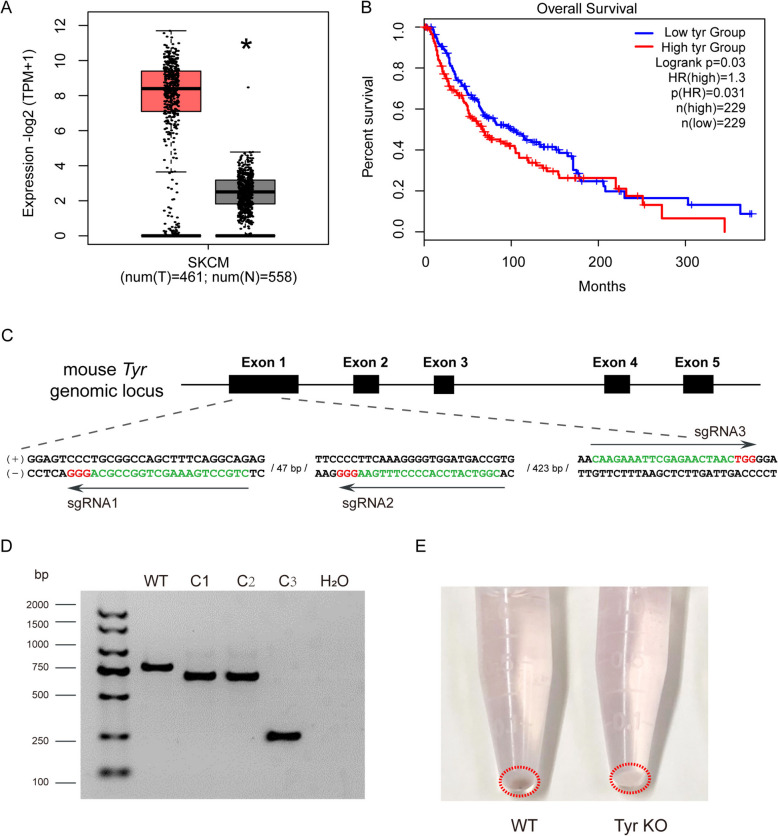
Background: Melanoma is one of the most commonly diagnosed malignancies and serves as a model for studying immunotherapy. The B16 melanoma model, resembling human cold tumors that lack T cell infiltration and show minimal response to PD-1 blockade, is widely used for studying melanoma and its resistance to immunotherapy. Therefore, understanding the molecular basis that prevents T cell-mediated anti-tumor activity in B16 melanoma is of great significance.

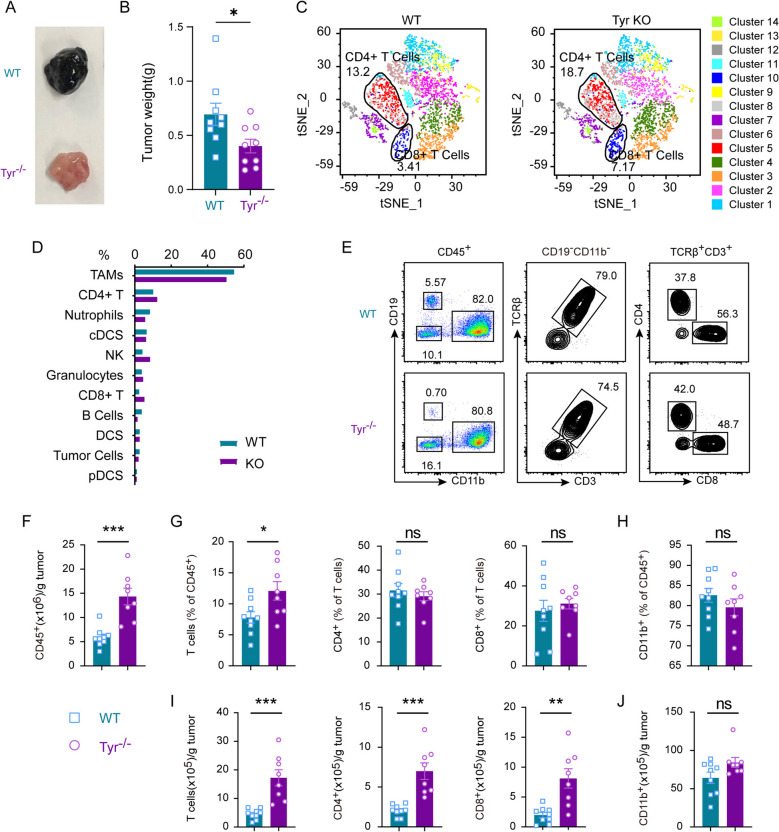
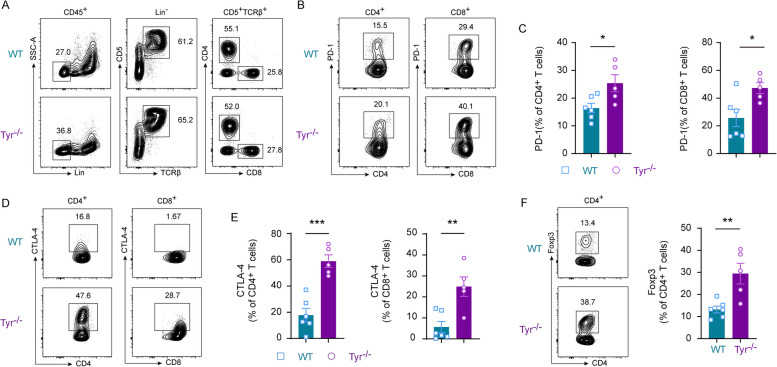
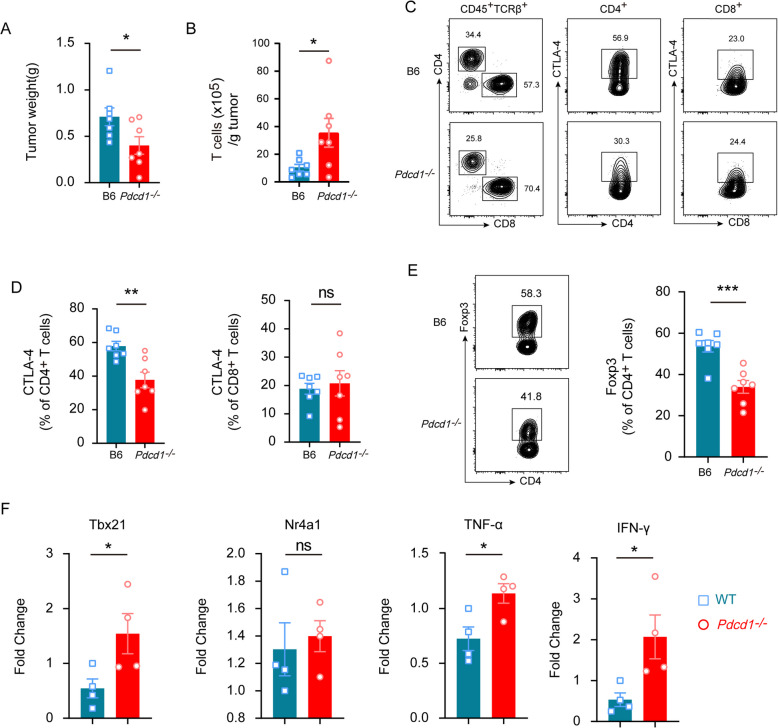
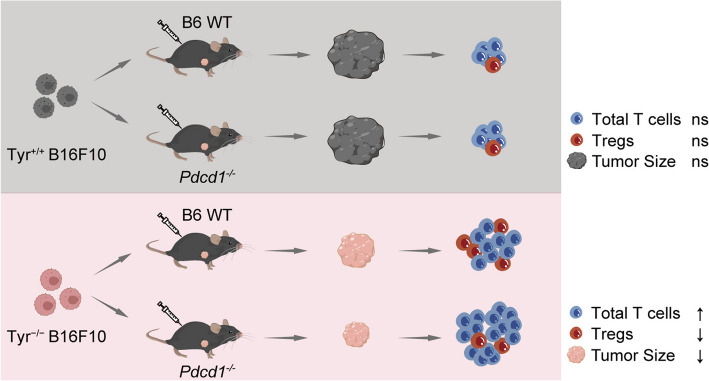
Results: In this study, we generated tyrosinase knockout B16 melanoma cells using CRISPR/Cas9 and discovered that tyrosinase in melanoma significantly inhibits the anti-tumor activity of T cells. Tyrosinase deficiency leads to a 3.80-fold increase in T-cell infiltration and enhances T-cell activation within the tumor. Single-cell RNA sequencing reveals an altered cold tumor immunophenotype in tyrosinase-deficient B16 melanoma. In wild-type mice, T cells in tyrosinase-deficient tumors express elevated levels of PD-1 and Foxp3. However, strikingly, in PD-1 deficient mice, the loss of tyrosinase in B16 melanoma unleashes the anti-tumor activity of PD-1 deficient T cells. This enhanced anti-tumor activity is explained by significantly increased tumor T cell infiltration accompanied by reduced frequencies of regulatory T cells in PD-1 knockout mice.

Conclusions: These findings suggest that targeting tyrosinase could convert cold tumors into an immune-responsive state in vivo using murine models. Inhibiting tyrosinase could enhance the effectiveness of PD-1 blockade, offering a new approach for melanoma patients who fail in current PD-1 inhibitor treatment.

Keywords: Melanoma; PD-1; Tumor infiltrating T cells; Tyrosinase.


Conflict of interest statement

Declarations. Ethics approval and consent to participate: All institutional and national guidelines for the care and use of laboratory animals were followed. The procedures were conducted according to the Standard of Laboratory Animals—General Code of Animal Welfare (GB/T 42011 − 2022) and approved by the animal care committee at Xinxiang Medical University. Consent for publication: Not applicable. Competing interests: The authors declare no competing interests.

Figures

Fig. 1
Fig. 1
Generation of Tyr knockout B16 melanoma cells by CRISPR/Cas9. A Elevated Tyr expression in SKCM tumor tissues compared to normal tissues. The data were obtained from the GEPIA2 database (http://gepia2.cancer-pku.cn). T: SKCMtumor tissues, N: Normal tissues. (*p < 0.05). B Analysis of the correlation between Tyr expression and clinical prognosis in SKCM patients, indicated by overall survival rates from the GEPIA2 database. C Illustration of sgRNA sequences targeting Tyr gene in B16-F10 cells. A visual depiction of the three guide RNA sequences designed to target exon 1 of the Tyr gene in B16-F10 cells is presented in this schematic. The protospacer adjacent motifs (PAMs) are highlighted in red. D Identification of Tyr knockout clones in B16-F10 cells through PCR screening. The three deletion clones are identified as C1, C2, and C3. M referred to the DNA size marker, WT referred to the wild-type B16-F10 control, and H2O was used as a negative control for PCR amplification. E Visual comparison of pigmentation in wild-type (WT) and Tyr knockout (KO) B16-F10 cells
Fig. 2
Fig. 2
Characterization of tumor-infiltrating immune cells in WT and Tyr−/− B16-F10 melanoma model. A Representative images of WT and Tyr−/− B16-F10 tumors from female C57BL/6 mice on day 14. B The weight of WT and Tyr−/− B16-F10 tumors on day 14. C The immune infiltration profiling in WT and Tyr−/− B16-F10 tumors through scRNA-Seq. CD45+ immune cells from WT and Tyr−/− B16-F10 tumors were sorted and analyzed. Pooled samples from three mice per group were used. Dimensionality reduction was done with the t-SNE algorithm and cell clustering using Seurat. Each cluster was denoted a unique color. t-SNE, t-distributed stochastic neighbor embedding. D Proportions of different immune cell types in WT and Tyr−/− B16-F10 tumors. E Gating strategy for tumor-infiltrating immune cells, including CD11b+ cells and T cells, in WT and Tyr−/− B16-F10 tumors. Cells were gated based on CD45+, CD11b+, CD19+, CD3+ TCR-β+, CD4+, and CD8+ markers. F Quantification of tumor-infiltrating CD45+ cells in WT and Tyr−/− B16-F10 tumors. G The proportion of T cells, CD4+ T cells and CD8+ T cells among tumor-infiltrating CD45+ cells in WT and Tyr−/− B16-F10 tumors. H Proportion of CD11b+ cells among tumor-infiltrating CD45+ cells in WT and Tyr−/− B16-F10 tumors. I-J Cell counts of T cells, CD4+ T cells, CD8+ T cells (I), and CD11b+ cells (J) per gram of tissue in WT and Tyr−/− B16-F10 tumors. Data are presented as mean ± SEM (WT tumors, n = 9; Tyr−/− tumors, n = 8 or 9). All data are pooled from two independent experiments. Statistical significances were calculated using Student’s t-test (* p < 0.05; ** p < 0.01; *** p < 0.001; ns, not significant)
Fig. 3
Fig. 3
Enhanced PD-1 and Foxp3 expression in tyrosinase-deficient tumors T Cells. A-B Flow cytometric analysis of PD-1 expression in WT and Tyr−/− tumors. Cells were firstly gated on CD45+ and Lin (CD19, CD11b, NK1.1, Ly6G), then further gated on CD5+ TCR-β+, CD4+, and CD8+ cells. C Percentage of PD-1+ cells within CD4+ and CD8+ T cells in WT and Tyr−/− B16-F10 tumors. D-E Flow cytometric analysis of PD-1 expression in WT and Tyr−/− tumors. Proportion of CTLA-4+ cells within CD4+ and CD8+ T cells in WT and Tyr−/− B16-F10 tumors (E). F Flow cytometric analysis of Foxp3 expression in WT and Tyr−/− tumors. Histograms on the right show the proportion of Foxp3 in CD4+ T cells in WT and Tyr−/− tumors. Data are presented as mean ± SEM (WT tumors, n = 6; Tyr−/− tumors, n = 5). All data are representative of two independent experiments. Statistical significances were calculated using Student’s t-test (* p < 0.05; ** p < 0.01; *** p < 0.001)
Fig. 4
Fig. 4
Altered cold-tumor immunophenotype revealed by single-cell RNA sequencing in tyrosinase-deficient B16 melanoma. A q-PCR analyses of Tbx21, Nr4a1, TNF-α and IFN-γ mRNAs in WT and Tyr−/− B16-F10 tumors (WT tumors, n = 5; Tyr−/− tumors, n = 5). Each point represents the mean value obtained from two replicates for an individual mouse. Statistical significances were calculated using Student’s t-test (* p < 0.05; ** p < 0.01). B The expression levels and distribution of CD3 in WT and Tyr−/− tumors demonstrated by t-SNE. C t-SNE visualization of the expression of IL-2, Tbx21, Nr4a1, TNF-α, and IFN-γ in CD4 cells (cluster 5). D t-SNE visualization of the expression of IL-2, Tbx21, Nr4a1, TNF-α, and IFN-γ in CD8 cells (cluster 10)
Fig. 5
Fig. 5
The effects of PD-1 blockade on tumor growth and T cells in Tyr+/+ B16-F10 tumors. A The tumor weight of Tyr+/+ B16-F10 cell grafted Pdcd1−/− and B6 mice. B Quantification of tumor-infiltrating T cells by flow cytometry in Tyr+/+ B16-F10 tumors from Pdcd1−/− and B6 mice. C Representative flow cytometry analysis of CTLA-4+ cells in Tyr+/+ B16-F10 tumors from Pdcd1−/− and B6 mice. Cells were identified based on CD45+, TCR-β+, CD4+, and CD8+ markers. D Quantification of the frequency of CTLA-4+ cells within CD4+ and CD8+ T cells in Tyr+/+ B16-F10 tumors from Pdcd1−/− and B6 mice. EF Flow cytometric analysis of Foxp3 expression in Tyr+/+ B16-F10 tumors from Pdcd1−/− and B6 mice. Proportion of Foxp3 in CD4+ T cells of Tyr+/+ B16-F10 tumors from Pdcd1−/− and B6 mice (F). Data are presented as mean ± SEM (B6 mice, n = 6; Pdcd1−/− mice, n = 8). Statistical significances were calculated using Student’s t-test (ns, not significant)
Fig. 6
Fig. 6
Loss of tyrosinase in B16 melanoma unleashes T cell-mediated tumor immunity of PD-1 deficient mice. A The tumor weight of Tyr−/− B16-F10 cell grafted Pdcd1−/− and B6 mice. B Quantification of tumor-infiltrating T cells by flow cytometry in Tyr−/− B16-F10 tumors from Pdcd1−/− and B6 mice. C Representative flow cytometry analysis of CTLA-4+ cells in Tyr−/− B16-F10 tumors from Pdcd1−/− and B6 mice. Cells were identified based on CD45+, TCR-β+, CD4+, and CD8+ markers. D Quantification of the frequency of CTLA-4+ cells within CD4+ and CD8+ T cells in Tyr−/− B16-F10 tumors from Pdcd1−/− and B6 mice. E Flow cytometric analysis of Foxp3 expression in Tyr−/− B16-F10 tumors from Pdcd1−/− and B6 mice. Proportion of Foxp3 in CD4+ T cells of Tyr−/− B16-F10 tumors from Pdcd1−/− and B6 mice. F q-PCR analyses of Tbx21, Nr4a1, TNF-α and IFN-γ mRNAs in in Tyr−/− B16-F10 tumors from Pdcd1−/− and B6 mice (WT tumors, n = 4; Tyr−/− tumors, n = 4). Each point represents the mean value obtained from two replicates for an individual mouse. Data in 6 A-E are presented as mean ± SEM (B6 mice, n = 7; Pdcd1−/− mice, n = 7), representative of two independent experiments. Statistical significances were calculated using Student’s t -test (* p < 0.05; ** p < 0.01; *** p < 0.001; ns, not significant)
Fig. 7
Fig. 7
Schematic diagram. In tyrosinase-sufficient Tyr+/+ tumors, Pdcd1−/− mice exhibit a tumor weight comparable to that of B6 WT mice. There are no significant changes in T-cell infiltration or Tregs expression in the tumors of either B6 WT or Pdcd1−/− mice. The absence of tyrosinase in B16 melanoma enhances the anti-tumor activity of PD-1 deficient T cells. In tyrosinase-deficient Tyr−/− tumor, the tumor weight is significantly reduced in Pdcd1−/− mice compared to the B6 WT controls. This reduction is associated with a significant increase in T-cell infiltration and a decrease in Treg frequencies in the Pdcd1−/− mice

References

    1. Brozyna AA, Jozwicki W, Carlson JA, Slominski AT. Melanogenesis affects overall and disease-free survival in patients with stage III and IV melanoma. Hum Pathol. 2013;44(10):2071–4. - PMC - PubMed
    1. Bishop DT, Demenais F, Iles MM, Harland M, Taylor JC, Corda E, et al. Genome-wide association study identifies three loci associated with melanoma risk. Nat Genet. 2009;41(8):920–5. - PMC - PubMed
    1. Pelayo BA, Fu YM, Meadows GG. Decreased tissue plasminogen activator and increased plasminogen activator inhibitors and increased activator protein-1 and specific promoter 1 are associated with inhibition of invasion in human A375 melanoma deprived of tyrosine and phenylalanine. Int J Oncol. 2001;18(4):877–83. - PubMed
    1. Pelayo BA, Fu YM, Meadows GG. Inhibition of B16BL6 melanoma invasion by tyrosine and phenylalanine deprivation is associated with decreased secretion of plasminogen activators and increased plasminogen activator inhibitors. Clin Exp Metastasis. 1999;17(10):841–8. - PubMed
    1. Fu YM, Yu ZX, Pelayo BA, Ferrans VJ, Meadows GG. Focal adhesion kinase-dependent apoptosis of melanoma induced by tyrosine and phenylalanine deficiency. Cancer Res. 1999;59(3):758–65. - PubMed

MeSH terms

Substances

LinkOut - more resources