. 2025 May 15;13(1):101.
doi: 10.1186/s40478-025-02028-6.

Downregulation of STAT3 transcription factor reverses synaptotoxic phenotype of reactive astrocytes associated with prion diseases

Affiliations

Downregulation of STAT3 transcription factor reverses synaptotoxic phenotype of reactive astrocytes associated with prion diseases

Rajesh Kushwaha et al. Acta Neuropathol Commun. .

Abstract

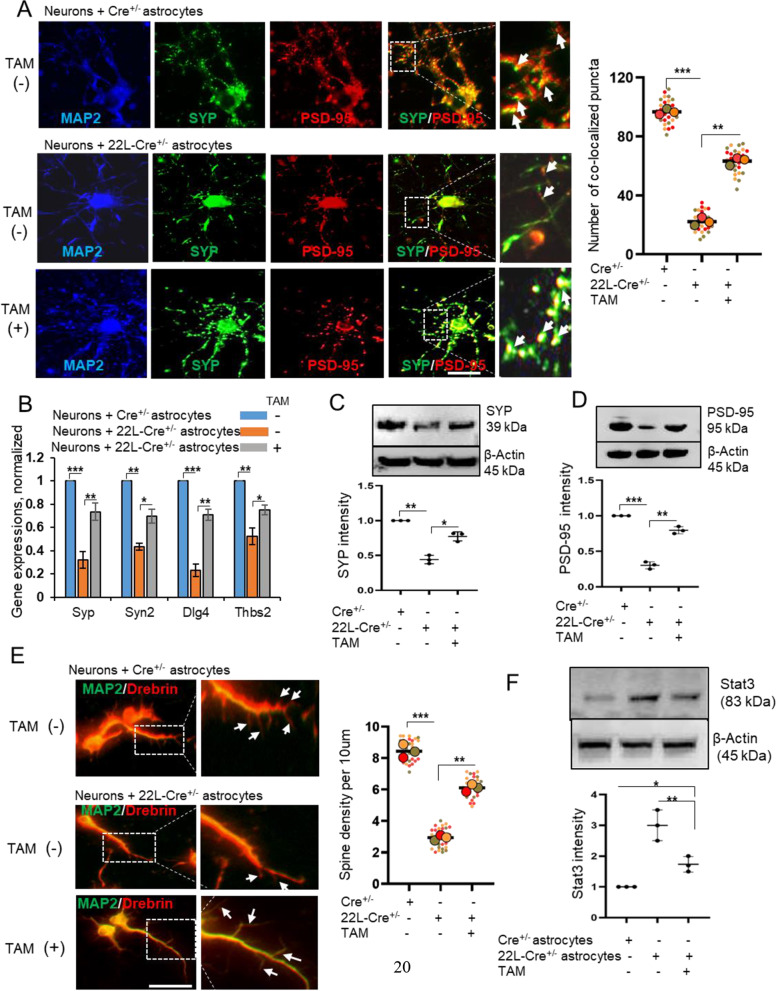
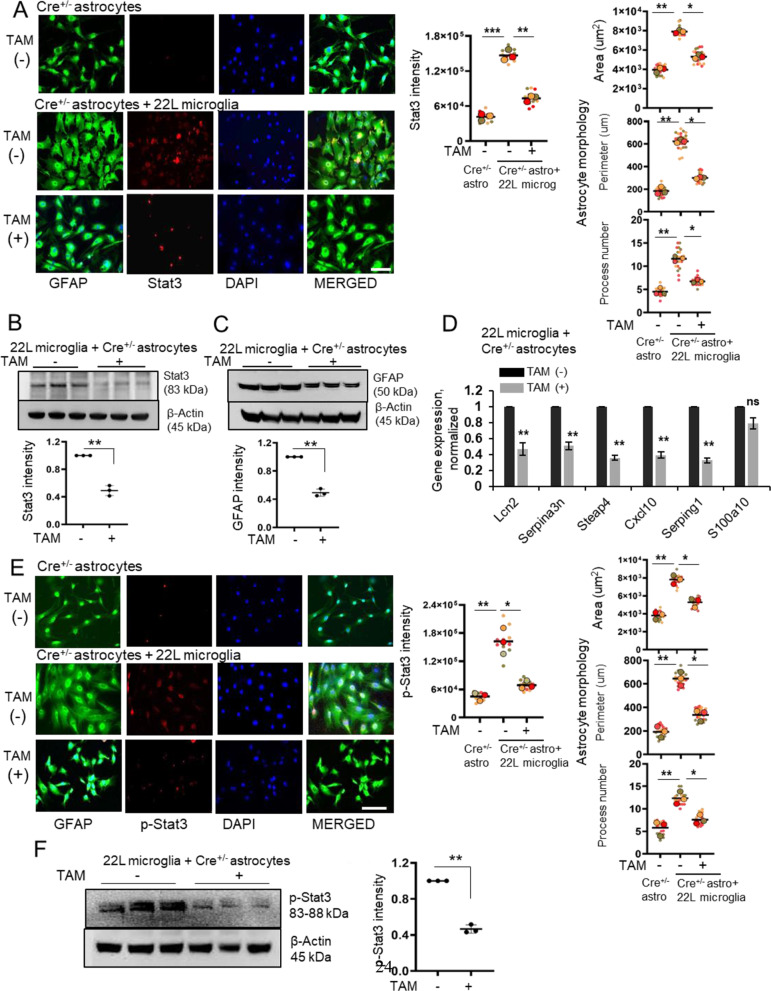
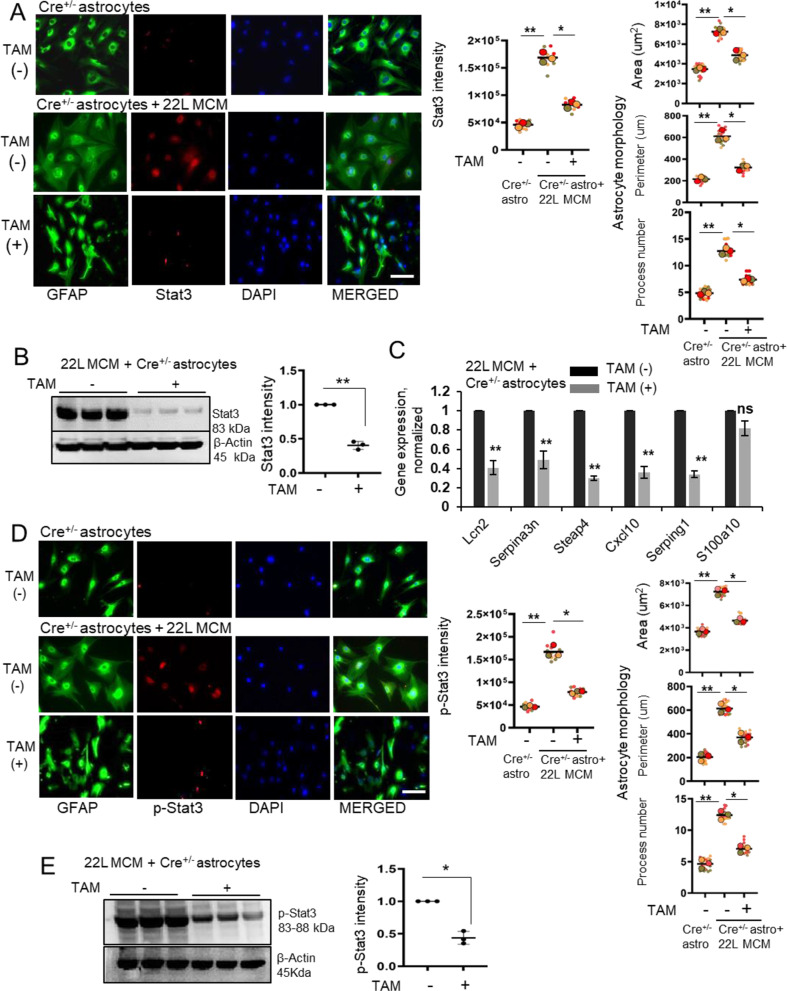
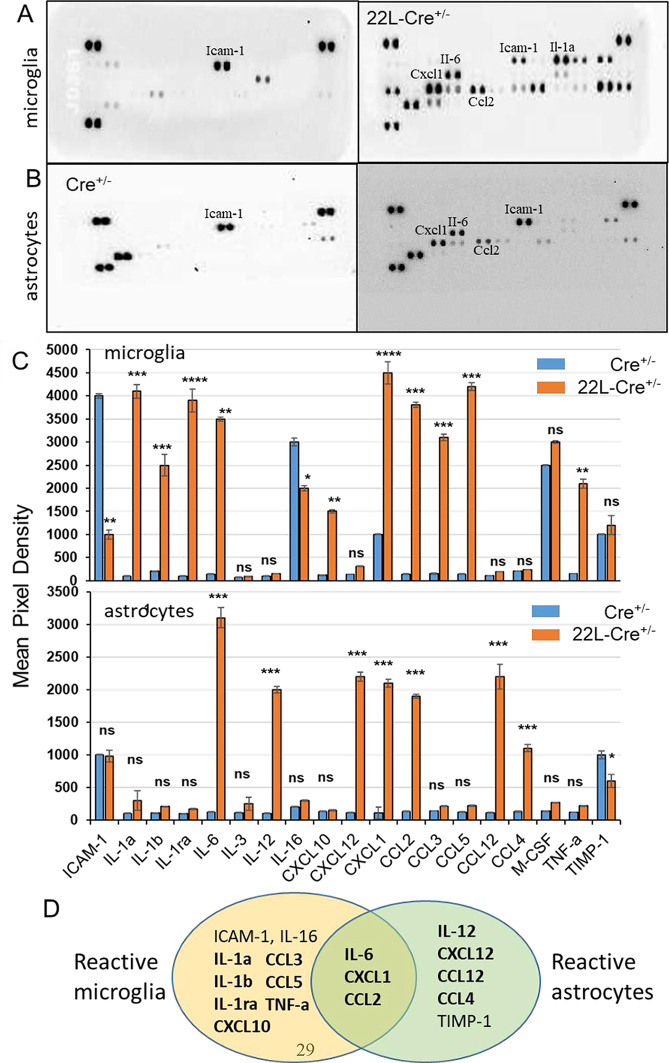
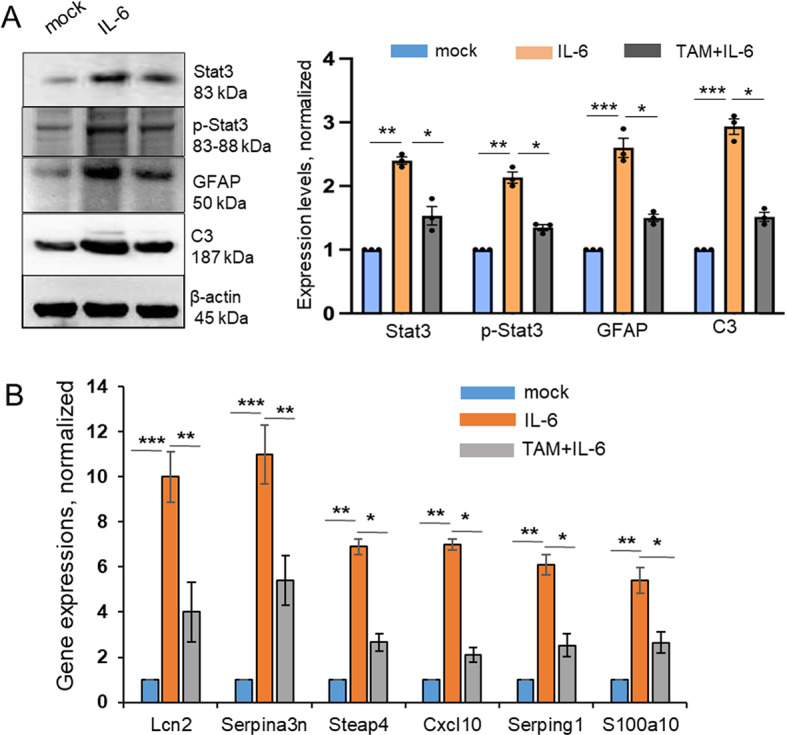
In neurodegenerative diseases, including prion diseases, astrocytes adopt reactive phenotypes that persist throughout disease progression. While astrocyte reactivity may initially serve as a protective response to prion infection, it transitions into a neurotoxic phenotype that disrupts homeostatic functions and exacerbates disease pathology. The transcription factor Stat3 has been recognized as a master regulator of astrocyte reactivity in neurodegenerative diseases, yet its role in prion disease-associated astrocyte reactive phenotypes remains unexplored. The current study addresses this gap by investigating the effects of Stat3 deletion in reactive astrocytes isolated from prion-infected mice. We demonstrate that Stat3 deletion mitigates the reactive astrocyte phenotype and alleviates their synaptotoxic effects. Stat3-dependent activation of astrocytes was reproduced by co-culturing naïve astrocytes with reactive microglia isolated from prion-infected animals or exposing them to microglia-conditioned media. A cytokine array profiling of 40 molecules revealed partially overlapping inflammatory signatures in reactive microglia and astrocytes, with IL-6 prominently upregulated in both cell types. Notably, IL-6 treatment elevated phosphorylated Stat3 levels in naïve astrocytes and triggered astrocyte reactivity. These findings indicate that the synaptotoxic phenotype of astrocytes in prion diseases can be sustained by reactive microglia and self-reinforced in a cell-autonomous manner. Our work highlights the pivotal role of Stat3 signaling in astrocyte activation and suggests that Stat3 inhibition may suppress the reactive phenotype of astrocytes associated with prion diseases.

Keywords: Interleukin 6; Neuroinflammation; Prion diseases; Prions; Reactive astrocytes; Reactive microglia; Stat3 transcription factor.


Conflict of interest statement

Declarations. Ethics approval and consent to participate: The study was carried out in strict accordance with the recommendations in the Guide for the Care and Use of Laboratory Animals of the National Institutes of Health. The animal protocol was approved by the Institutional Animal Care and Use Committee of the University of Maryland, Baltimore (Assurance Number: A32000-01; Protocol Numbers: 1120001 and 00000166-1). Consent for publication: Not applicable. Competing interests: The authors declare no competing interests.

Figures

Fig. 1
Fig. 1
Tamoxifen treatment reduces the levels of Stat3 and p-Stat3 in reactive astrocytes isolated from prion-infected mice. Primary astrocytes were treated with TAM or mock solution for 72 h and analyzed. A, B. Upper panels: immunofluorescence microscopy images of 22L-Cre+/−astrocytes co-immunostained for GFAP and Stat3 (A) or p-Stat3 (B) along with DAPI. Lower panels: quantification of integrated fluorescence intensity for Stat3 (A) and p-Stat3 (B), and morphometric analyses of cell area, perimeter and process number in 22L-Cre+/− astrocytes. C, D. Upper panel: immunofluorescence microscopy images of 22L-Cre−/− astrocytes co-immunostained for GFAP and Stat3 (C) or p-Stat3 (D) along with DAPI. Lower panels: quantification of integrated fluorescence intensity for Stat3 (C) or p-Stat3 (D), and morphometric analyses of cell area, perimeter and process number in 22L-Cre−/− astrocytes. Images are representatives of three cultures originating from independent animals per experimental group. For Stat3 or p-Stat3 intensity, n = 10–12 random fields with 6–7 cells per field of view from N = 3 independent cultures, each prepared from an individual animal, per group. For morphology analysis, n = 80–100 cells from N = 3 independent cultures, each prepared from an individual animal, per group. In A-D SuperPlots: colors represent independent experiments; dots represent in individual fields of view or cells; average values for each experiment are shown as large circles; statistical analyses were performed based on the number of independent experiments; black lines mark means. E. Analysis of expression of Stat3 in 22L-Cre+/− and 22L-Cre−/− astrocytes normalized by the expression levels in mock-treated 22L-Cre+/− or 22L-Cre−/− astrocytes using qRT-PCR. F, G. Representative Western blots and densitometric analysis of Stat3 (F) and p-Stat3 (G) expression in 22L-Cre+/− and 22L-Cre−/− astrocytes normalized per expression of β-actin. For E-G, N = 3 independent cultures, each prepared from an individual animal, per group. For A-G, data represent means ± SE, ***p < 0.001, **p < 0.01, and ‘ns’ non-significant by two-tailed, unpaired t-test, n = 3 independent experiments. Scale bar = 50 μm
Fig. 2
Fig. 2
Stat3 deletion mitigates the reactive phenotype of astrocytes isolated from prion-infected mice. Primary astrocytes were treated with TAM or mock solution for 72 h and analyzed. A, B. Left panels: analysis of GFAP (A) and C3 (B) gene expression in 22L-Cre+/− and 22L-Cre−/− astrocytes using qRT-PCR. Right panels: representative Western blots and densitometric analysis of GFAP (A) and C3 (B) expression normalized per expression of β-actin in 22L-Cre+/− and 22L-Cre−/− astrocytes. C, D. Analysis of expression of genes associated with astrocyte reactivity in 22L-Cre+/− (C) and 22L-Cre−/− (D) astrocytes. The expression levels in TAM-treated astrocytes were normalized relative to those in mock-treated astrocytes. In A-D, N = 3 independent cultures, each prepared from an individual animal, per group. Data represent means ± SE, ***p < 0.001, **p < 0.01, *p < 0.05 and ‘ns’ is non-significant by two-tailed, unpaired t-test. E, F. Left panels: immunofluorescence microscopy images of 22L-Cre+/− (E) and 22L-Cre−/−(F) astrocytes co-immunostained for GFAP and C3 along with DAPI. Right panels: quantification of the C3-positive area within GFAP-positive 22L-Cre+/− (E) and 22L-Cre−/−(F) astrocytes. Images are representatives of three cultures originating from independent animals. n = 13 random fields with 8–10 cells per field of view from N = 3 independent cultures, each prepared from an individual animal, per group. In E and F SuperPlots: colors represent independent experiments; dots represent in individual fields of view; average values for each experiment are shown as large circles; statistical analyses were performed based on the number of independent experiments; black lines mark means, ***p < 0.001, ‘ns’ is non-significant by two-tailed, unpaired t-test. Scale bar = 50 µm
Fig. 3
Fig. 3
Stat3 deletion alleviates the synaptotoxic effects of reactive astrocytes from prion-infected mice. Cre+/−, 22L-Cre+/−, and TAM-pretreated 22L-Cre+/− astrocytes were co-cultured with primary cortical neurons for 10–12 days. 24 h prior of coculturing with neurons, the culture media containing TAM in astrocyte cultures was replaced with the fresh co-culture media without TAM, as described in Methtods. (A) Left panels: fluorescence microscopy images of cortical neurons co-cultured with Cre+/−, 22L-Cre+/− or TAM-pretreated 22L-Cre+/− astrocytes and co-immunostained for MAP2 and pre- and post-synaptic markers synaptophysin (SYP) and PSD95, respectively. Arrows indicate puncta of co-localized SYP and PSD95. Right panel: quantification of co-localized puncta per field of view in co-cultures. N = 23 random fields of view with 1–2 neurons per field of vies from N = 3 independent cultures. (B) Analysis of expression of Syp, Syn2, Dlg4 and Thbs2 genes in neurons co-cultured with astrocytes using qRT-PCR. C, D. Representative Western blots and densitometric analysis of SYP (C) and PSD-95 (D) expression normalized per expression of β-actin in co-cultures. E. Left panels: fluorescence microscopy images of cortical neuronal cells co-cultured with Cre+/−, 22L-Cre+/− and TAM-pretreated 22L-Cre+/− astrocytes co-immunostained for spine marker Drebrin and MAP2. Right panel: quantification of spine density in co-cultures. In E, 30–40 neurons for each experimental condition. In A and E SuperPlots: colors represent independent experiments; dots represent in individual fields of view or neurons; average values for each experiment are shown as large circles; statistical analyses were performed based on the number of independent experiments; black lines mark means. F. Representative Western blots and densitometric analysis of Stat3 expression astrocytes from adult, non-infected Cre+/− mice, TAM-treated 22L-Cre+/− astrocytes and mock-treated 22L-Cre+/− astrocytes normalized per expression of β-actin. In A-F, Data represent means ± SE, *p < 0.05, **p < 0.01, ***p < 0.001, by one-way ANOVA with Bonferroni post-hoc test, N = 3 independent culture experiments per group, each prepared from an individual animal, per group. Scale bars = 25 μm (A) and 10 μm (E)
Fig. 4
Fig. 4
Astrocyte-specific deletion of Stat3 reverses microglia-induced astrocyte reactivity. Astrocyte − 22L microglia co-cultures were treated with TAM or mock solution for 72 h and analyzed A. Left panels: immunofluorescence microscopy images of Cre+/− astrocytes co-cultured with 22L microglia and co-immunostained for GFAP and Stat3 along with DAPI. Cre+/− astrocytes cultured in the absence of microglia are presented as reference. Right panels: quantification of integrated fluorescence intensity of Stat3, and morphometric analyses of cell area, perimeter and process number of astrocytes. B, C. Representative Western blots and densitometric analysis of Stat3 (B) and GFAP (C) expression normalized per expression of β-actin. D. Analysis of expression of genes associated with astrocyte reactivity in Cre+/− astrocytes co-cultured with 22L microglia using qRT-PCR. E. Left panels: immunofluorescence microscopy images of Cre+/− astrocytes co-cultured with 22L microglia and co-immunostained for GFAP and p-Stat3 along with DAPI. Cre+/− astrocytes cultured in the absence of microglia are presented as reference. Right panels: quantification of integrated fluorescence intensity of p-Stat3 and morphometric analyses of cell area, perimeter and process number of astrocytes. F. Representative Western blots and densitometric analysis of p-Stat3 expression normalized per expression of β-actin. In A and E, images are representatives of three cultures originating from individual animals; for Stat3 and p-Stat3 intensity, n = 10 random fields with 5–7 cells per field from N = 3 independent cultures per group; for morphology analysis, n = 80–100 cells from N = 3 independent cultures per group. In SuperPlots: colors represent independent experiments; dots represent in individual fields of view or cells; average values for each experiment are shown as large circles; statistical analyses were performed based on the number of independent experiments; black lines mark means. In B-D and F, N = 3 independent cultures, each prepared from an individual animal, per group. In A-F, data represent means ± SE, ***p < 0.001, **p < 0.01,*p < 0.05, ‘ns’ is non-significant by one-way ANOVA with Bonferroni multiple comparisons test (in A and E) and by two-tailed, unpaired t-test (in B-D and F). Scale bars = 50 µm
Fig. 5
Fig. 5
Stat3-mediated astrocyte reactivity is induced by microglia-secreted factors. Astrocyte were cultured in the presence of 22L MCM and TAM or mock solution for 72 h and analyzed A. Left panels: immunofluorescence microscopy images of Cre+/− astrocytes co-immunostained for GFAP and Stat3 along with DAPI. Cre+/− astrocytes cultured in the absence of 22L MCM are presented as reference. Right panels: quantification of integrated fluorescence intensity of Stat3, and morphometric analyses of cell area, perimeter and process number of astrocytes. B. Representative Western blot and densitometric analysis of Stat3 expression normalized per expression of β-actin. C. Analysis of expression of genes associated with astrocyte reactivity in Cre+/− astrocytes cultured in the presence of 22L MCM using qRT-PCR. D. Left panels: immunofluorescence microscopy images of Cre+/− astrocytes co-immunostained for GFAP and p-Stat3 along with DAPI. Right panels: quantification of integrated fluorescence intensity of p-Stat3 and morphometric analyses of cell area, perimeter and process number. E. Representative Western blots and densitometric analysis of p-Stat3 expression normalized per expression of β-actin. In A and D, images are representatives of N = 3 cultures originating from individual animals; for Stat3 and p-Stat3intensity, n = 10 random fields with 5–6 cells per field from N = 3 independent cultures originating from individual animals; for morphology analysis, n = 70–80 cells from N = 3 independent cultures, originating from individual animals. In SuperPlots: colors represent independent experiments; dots represent in individual fields of view or cells; average values for each experiment are shown as large circles; statistical analyses were performed based on the number of independent experiments; black lines mark means. In B, C and E, N = 3 independent cultures, originating from individual animals. In A-E, data represent means ± SE, **p < 0.01, *p < 0.05, ‘ns’ is non-significant by one-way ANOVA with Bonferroni multiple comparisons test (in A and D) and by two-tailed, unpaired t-test (in B, C and E). Scale bars = 50 µm
Fig. 6
Fig. 6
Reactive microglia and astrocytes secrete pro-inflammatory factors. Analysis of media conditioned by reactive microglia and astrocytes isolated from 22L-Cre+/− and non-infected, adult Cre+/− mice using cytokine/chemokine profiling array. A, B. Representative array images of mouse cytokines in media conditioned by reactive microglia (A) and astrocytes (B). C. Quantification cytokines secreted by microglia and astrocytes from 22L-Cre+/− and Cre+/− animals. D. Venn diagram illustrating an overlap in secreted molecules between reactive astrocytes and microglia. Factors upregulated or downregulated in reactive versus homeostatic states are shown using bold and thin fonts, respectively. Data represent mean ± SE, ****p < 0.0001, ***p < 0.001, **p < 0.01, *p < 0.05 and ‘ns’ is non-significant by two-tailed, unpaired t-test, N = 3 independent experiments, where conditioned media were obtained from three independent cultures, each originating from an individual animal
Fig. 7
Fig. 7
IL-6 induces astrocyte reactivity in a Stat3-dependent manner. Astrocytes were isolated from non-infected, adult Cre+/− mice, treated with IL-6, IL-6 and TAM or mock solution for 72 h and analyzed. (A) Representative Western blots and densitometric analysis of Stat3, p-Stat3, GFAP, and C3 expression normalized per expression of β-actin. (B) Analysis of expression of genes associated with astrocyte reactivity. Expression levels were normalized relative to the expression of the respective gene in mock-treated astrocytes. Data represent mean ± SE, ***p < 0.001, **p < 0.01, *p < 0.05, by one-way ANOVA with Bonferroni multiple comparisons post-hoc test, N = 3 independent astrocyte cultures per group, each originating from an individual animal

Similar articles

References

    1. Phatnani H, Maniatis T (2015) Astrocytes in neurodegenerative disease. Cold Spring Harb Perspect Biol 7(6) - PMC - PubMed
    1. Ferrer I (2017) Diversity of astroglial responses across human neurodegenerative disorders and brain aging. Brain Pathol 27(5):645–674 - PMC - PubMed
    1. Habib N, McCabe C, Medina S, Varshavsky M, Kitsberg D, Dvir-Szternfeld R, Green G, Dionne D, Nguyen L, Marshall JL et al (2020) Disease-associated astrocytes in Alzheimer’s disease and aging. Nat Neurosci 23(6):701–706 - PMC - PubMed
    1. Ben Haim L, Carrillo-de Sauvage M-A, Ceyzériat K, Escartin C (2015) Elusive roles for reactive astrocytes in neurodegenerative diseases. Front Cell Neurosci 9(278) - PMC - PubMed
    1. Acioglu C, Li L, Elkabes S (2021) Contribution of astrocytes to neuropathology of neurodegenerative diseases. Brain Res:147291 - PubMed

Publication types

Substances

LinkOut - more resources