

A phenotyping algorithm for classification of single ventricle physiology using electronic health records
- PMID: 40376075
- PMCID: PMC12080993
- DOI: 10.1093/jamiaopen/ooaf035
A phenotyping algorithm for classification of single ventricle physiology using electronic health records
Abstract
Objectives: Congenital heart disease (CHD) patients with single ventricle physiology (SVP) have heterogeneous characteristics that challenge cohort classification. We aim to develop a phenotyping algorithm that accurately identifies SVP patients using electronic health record (EHR) data.
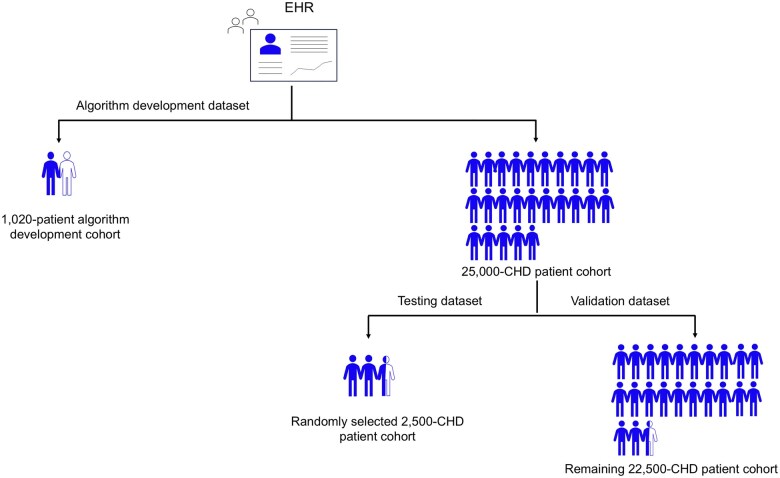
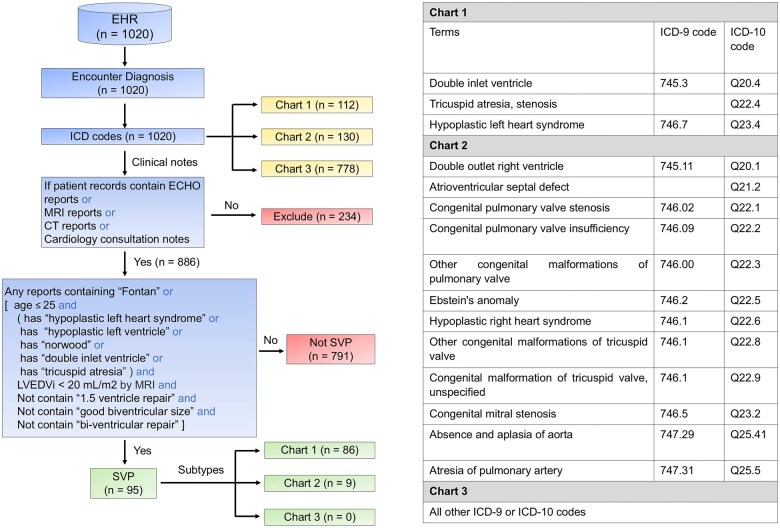
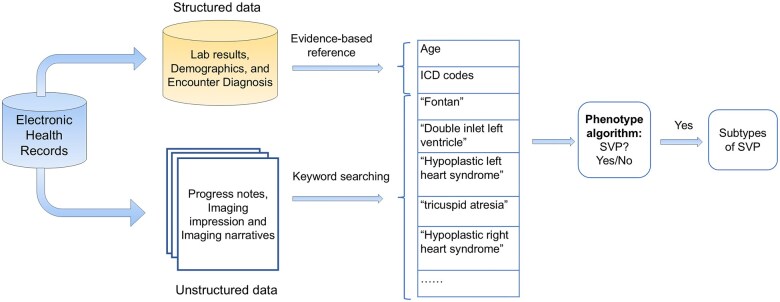
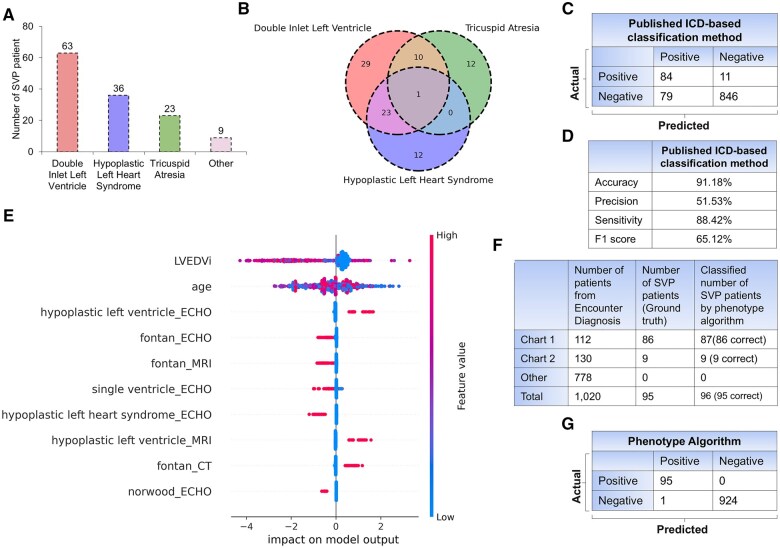
Materials and methods: We used ICD-9 and ICD-10 codes for initial classification, then enhanced the algorithm with domain expertise, imaging reports, and progress notes. The algorithm was developed using a cohort of 1020 patients who underwent magnetic resonance imaging scans and tested in a separate cohort of 2500 CHD patients with adjudication. Validation was performed in a holdout group of 22 500 CHD patients. We evaluated performance using accuracy, sensitivity, precision, and F1 score, and compared it to a published algorithm for SVP using the same dataset.
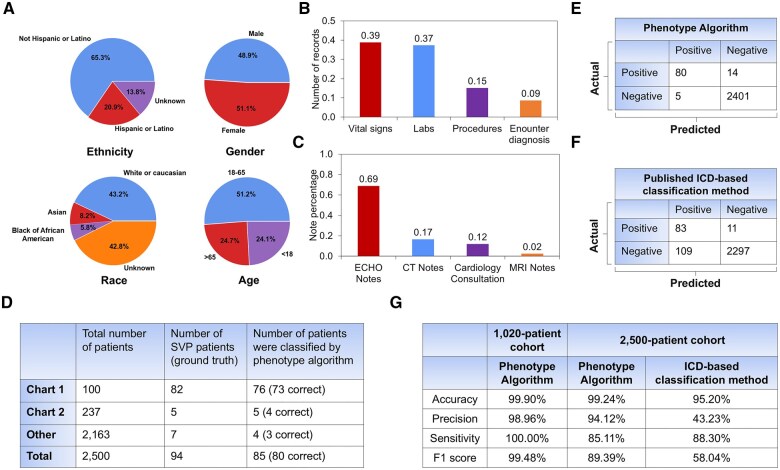
Results: In the 2500-testing cohort, our algorithm based on specialty-defined features and International Classification of Diseases (ICD) codes achieved 99.24% accuracy, 94.12% precision, 85.11% sensitivity, and 89.39% F1 score. In contrast, the published method achieved 95.20% accuracy, 43.23% precision, 88.30% sensitivity, and 58.04% F1 score. In the 22 500-validation cohort, our algorithm achieved 93.82% precision, while the published method achieved 43.00%.
Discussion and conclusions: Our automated phenotype algorithm, combined with physician adjudication, outperforms a published method for SVP classification. It effectively identifies false positives by cross-referencing clinical notes and detects missed SVP cases that were due to absent or erroneous ICD codes. Our integrated phenotyping algorithm showed excellent performance and has the potential to improve research and clinical care of SVP patients through the automated development of an electronic cohort for prognostication, monitoring, and management.
Keywords: cohort development; electronic health records; phenotype algorithm; single ventricle physiology.
© The Author(s) 2025. Published by Oxford University Press on behalf of the American Medical Informatics Association.
Conflict of interest statement
All authors declare no competing interests relevant to this study.
Figures
Similar articles
-
Comparison of Diagnosis Codes to Clinical Notes in Classifying Patients with Diabetic Retinopathy.Ophthalmol Sci. 2024 Jun 14;4(6):100564. doi: 10.1016/j.xops.2024.100564. eCollection 2024 Nov-Dec. Ophthalmol Sci. 2024. PMID: 39253554 Free PMC article.
-
Automated phenotyping of mild cognitive impairment and Alzheimer's disease and related dementias using electronic health records.Int J Med Inform. 2025 Aug;200:105917. doi: 10.1016/j.ijmedinf.2025.105917. Epub 2025 Apr 11. Int J Med Inform. 2025. PMID: 40222334
-
Combining billing codes, clinical notes, and medications from electronic health records provides superior phenotyping performance.J Am Med Inform Assoc. 2016 Apr;23(e1):e20-7. doi: 10.1093/jamia/ocv130. Epub 2015 Sep 2. J Am Med Inform Assoc. 2016. PMID: 26338219 Free PMC article.
-
Supervised Text Classification System Detects Fontan Patients in Electronic Records With Higher Accuracy Than ICD Codes.J Am Heart Assoc. 2023 Jul 4;12(13):e030046. doi: 10.1161/JAHA.123.030046. Epub 2023 Jun 22. J Am Heart Assoc. 2023. PMID: 37345821 Free PMC article.
-
Positive Predictive Value of International Classification of Diseases, Ninth Revision, Clinical Modification, and International Classification of Diseases, Tenth Revision, Clinical Modification, Codes for Identification of Congenital Heart Defects.J Am Heart Assoc. 2023 Aug 15;12(16):e030821. doi: 10.1161/JAHA.123.030821. Epub 2023 Aug 7. J Am Heart Assoc. 2023. PMID: 37548168 Free PMC article.
References
Grants and funding
LinkOut - more resources
Full Text Sources