Detecting the Seasonal and Spatial Patterns of COVID-19 Hospitalization and Deaths in Iran: Insights from a Spatiotemporal and Hotspot Analysis
- PMID: 40376078
- PMCID: PMC12080935
- DOI: 10.4103/ijpvm.ijpvm_146_24
Detecting the Seasonal and Spatial Patterns of COVID-19 Hospitalization and Deaths in Iran: Insights from a Spatiotemporal and Hotspot Analysis
Abstract
Background: Understanding the seasonal and spatial patterns of COVID-19 hospitalization and deaths is crucial for effective hospital management, resource allocation, and public health interventions. The current study conducts a spatiotemporal hotspot analysis that explores the seasonal and geographical patterns of high-risk areas of COVID-19 hospitalizations and deaths in Iran.
Methods: Provincial-level data on laboratory-confirmed COVID-19 cases with acute respiratory symptoms in Iran (February 2019-March 30, 2022) were collected. Hotspot analyses mapped seasonal incidence risks, and Global Moran's spatial autocorrelation analysis identified COVID-19 clusters.
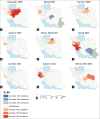
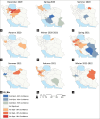
Results: Over the 2 years, 26 hotspots and 11 cold spots were identified (P < 0.05). Western and central provinces showed the highest hospitalization hotspots, while the west and north had the most death hotspots. South and southeast provinces exhibited low incidence and the highest number of cold spots. High-risk areas were prevalent in spring and autumn, mainly in the west, north, and central regions.
Conclusions: This research unveils the clustering patterns of COVID-19 hospitalizations and fatalities in Iran during the most severe pandemic. Spatial clusters and dynamic hotspots varied across regions and time. Prioritizing high-risk areas during critical epidemic waves, devising seasonal care strategies, and implementing preventive measures can significantly improve health outcomes.
Keywords: Covid-19; Iran; hospitalization; incidence; spatiotemporal analysis.
Copyright: © 2025 International Journal of Preventive Medicine.
Conflict of interest statement
Dr. MMG had been the former director of the Iranian Center for Communicable Diseases at the Ministry of Health during the time of the study. All other authors declare that they have no competing interests.
Figures


References
-
- Mahase E. China coronavirus: WHO declares international emergency as death toll exceeds 200. BMJ. 2020;368 m408. doi:10.1136/bmj.m408. - PubMed
-
- Wise J. Covid-19: WHO declares end of global health emergency. BMJ. 2023;381:1041. - PubMed
-
- Kolahchi Z, De Domenico M, Uddin LQ, Cauda V, Grossmann I, Lacasa L, et al. COVID-19 and its global economic impact Coronavirus Disease-COVID-19. Springer. 2021:825–37. - PubMed
LinkOut - more resources
Full Text Sources
