Review
. 2025 Apr 3;17(2):359-384.
doi: 10.1007/s12551-025-01306-w. eCollection 2025 Apr.

Nanotechnology meets medicine: applications of atomic force microscopy in disease

Affiliations
Review

Nanotechnology meets medicine: applications of atomic force microscopy in disease

Zita Matias et al. Biophys Rev. .

Abstract

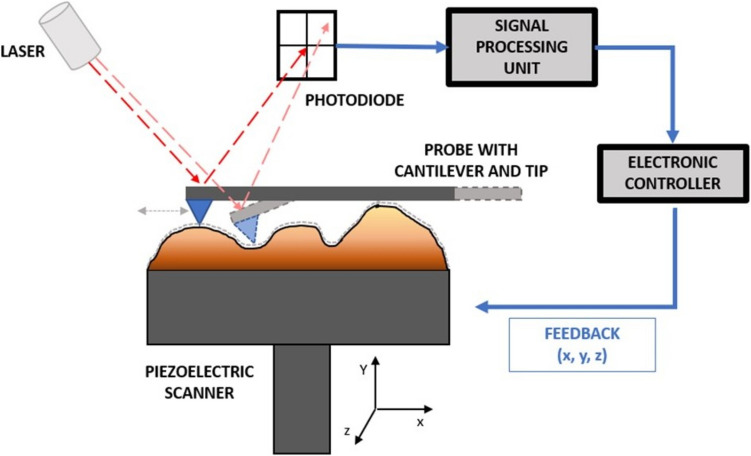
Atomic force microscopy (AFM) is a scanning imaging technique able to work at the nanoscale. It uses a cantilever with a tip to move across samples' surface and a laser to measure the cantilever bending, enabling the assessment of interaction forces between tip and sample and creating a three-dimensional visual representation of its surface. AFM has been gaining notoriety in the biomedical field due to its high-resolution images, as well as due to its ability to measure the inter- and intramolecular interaction forces involved in the pathophysiology of many diseases. Here, we highlight some of the current applications of AFM in the biomedical field. First, a brief overview of the AFM technique is presented. This theoretical framework is then used to link AFM to its novel translational applications, handling broad clinical questions in different areas, such as infectious diseases, cardiovascular diseases, cancer, and neurodegenerative diseases. Morphological and nanomechanical characteristics such as cell height, volume, stiffness, and adhesion forces may serve as novel parameters used to tailor patient care through nanodiagnostics, individualized risk stratification, and therapeutic monitoring. Despite an increasing development of AFM biomedical research with patient cells, showing its unique capabilities in terms of resolution, speed, and accuracy, there is a notable need for applied AFM research in clinical settings. More translational research with AFM may provide new grounds for the valuable collaboration between biomedical researchers and healthcare professionals.

Keywords: Atomic force microscopy; Cancer; Cardiovascular diseases; Infectious diseases; Neurodegenerative diseases.


Conflict of interest statement

Competing interestsThe authors declare no competing interests.

Figures

Fig. 1
Fig. 1
Schematic diagram depicting a typical AFM system. Adapted from (Ishida and Craig 2019)
Fig. 2
Fig. 2
Native infectious SARS-CoV-2 virions imaged by AFM. Topographic image and 3D projection of native infectious SARS-CoV-2 virions adsorbed on a poly-l-lysine-coated mica surface using quantitative imaging mode AFM in buffer (adapted from (Lyonnais et al. 2021), with permission)
Fig. 3
Fig. 3
AFM imaging demonstrates progressive cytoskeletal changes on parasite development and merozoite egress. Uninfected erythrocytes and ring (10 h post-infection, hpi), trophozoite (25 hpi), or schizont (40 hpi)-infected erythrocytes were imaged using AFM. Processed images showed changes on the pRBC surface (mainly knob formation) by the trophozoite stage, at 25 hpi (upper panel). Extraction of cytoskeletal information (lower panel) from AFM images showed an increase in the mesh size of the spectrin network by the trophozoite stage, at 25 hpi, which expanded further by the schizont stage, at 40 hpi (adapted from (Millholland et al. 2011), with permission)
Fig. 4
Fig. 4
Evaluation of elastic fibers breaks and width in mice aortas during aging, using AFM analysis. A AFM topographical image of aorta sections from mice specimen aged 1 month (V1), and B associated AFM PeakForce error image. C AFM PeakForce error image of aorta sections from mice specimen aged 5 months (V5). D AFM PeakForce error image of aorta sections from mice specimen aged 20 months (V20). E Histogram of the width of the elastic fibers taken from PeakForce images for the different conditions including mice aged 10 months (V10). F Quantification of the elastic breaks per lamellae. Thick and homogeneous elastin fibers parallel to each other and very little extracellular matrix in between can be seen for V1. On the contrary, the V20 image exhibits few fibers with highly heterogeneous thickness and rupture points. Results are expressed as mean ± SEM (n = 15). ***, p < 0.001; **, p < 0.01 (adapted from Berquand et al. , with permission)
Fig. 5
Fig. 5
AFM topography measurements of Caco-2 cells before and after treatment with simvastatin. Topography maps of Caco-2 cells before and after supplementation with simvastatin for 24 and 48 h with deflection maps, 3D topography, and topographic sections for forward and backward traces (adapted from (Beton and Brożek-Płuska 2022), with permission)
Fig. 6
Fig. 6
Morphology and biomechanical properties of A549 cells untreated and treated with A549-EVs for 48 h. A Effect of A549-EVs (at 80 and 160 μg/mL) on the morphology, Young’s modulus and surface adhesion of A549 cells, assessed by AFM. BE Histograms of height, length, Young’s modulus, and adhesion of A549 cells with and without treatment (reproduced from (Wang et al. 2021), with permission)
Fig. 7
Fig. 7
Changes in A549 cell stiffness assessed by AFM SMFS, induced by sorafenib tosylate and osimertinib mesylate. Young’s modulus after treatment of A549 cells with A sorafenib tosylate and B osimertinib mesylate (adapted from (Zhu et al. 2021), with permission)
Fig. 8
Fig. 8
Root mean square roughness (Rrms) of the surface of erythrocytes from healthy subjects, and PD, ALS, and AD patients vs. aging time. Mean values and Standard deviation (reproduced from Strijkova-Kenderova et al. , with permission)
Fig. 9
Fig. 9
Characterization of the protein aggregates detected in PD patient serum and CSF samples, compared with healthy controls (HC), using AFM (representative AFM images of serum (A, B) and CSF (D, E) samples dried onto mica. Diameter of the aggregates (mean ± SD) detected in these serum (C) and CSF (F) samples are shown in C and F (adapted from (Lobanova et al. 2022), with permission)

Similar articles

References

    1. Abramczyk H, Imiela A, Brozek-Pluska B, Kopec M (2019) Advances in Raman imaging combined with AFM and fluorescence microscopy are beneficial for oncology and cancer research. Nanomedicine 14(14):1873–1888. 10.2217/nnm-2018-0335 - PubMed
    1. Adelson RP, Palikuqi B, Weiss Z, Checco A, Schreiner R, Rafii S, Rabbany SY (2021) Morphological characterization of Etv2 vascular explants using fractal analysis and atomic force microscopy. Microvasc Res 138:104205. 10.1016/j.mvr.2021.104205 - PMC - PubMed
    1. Aguayo S, Marshall H, Pratten J, Bradshaw D, Brown JS, Porter SR, Spratt D, Bozec L (2017) Early adhesion of Candida albicans onto dental acrylic surfaces. J Dent Res 96(8):917–923. 10.1177/0022034517706354 - PubMed
    1. Alorda-Clara M, Reyes J, Trelles-Guzman MG, Florido M, Roca P, Pons DG, Oliver J (2023) Isolation and characterization of extracellular vesicles in human bowel lavage fluid. Int J Mol Sci 24(8):7391. 10.3390/ijms24087391 - PMC - PubMed
    1. Ando T (2013) High-speed atomic force microscopy. J Electron Microsc 62(1):81–93. 10.1093/jmicro/dfs093 - PubMed

LinkOut - more resources