. 2025 May 1:16:1592549.
doi: 10.3389/fmicb.2025.1592549. eCollection 2025.

A comprehensive multi-omics analysis uncovers the associations between gut microbiota and pancreatic cancer

Affiliations

A comprehensive multi-omics analysis uncovers the associations between gut microbiota and pancreatic cancer

Yang Han et al. Front Microbiol. .

Abstract

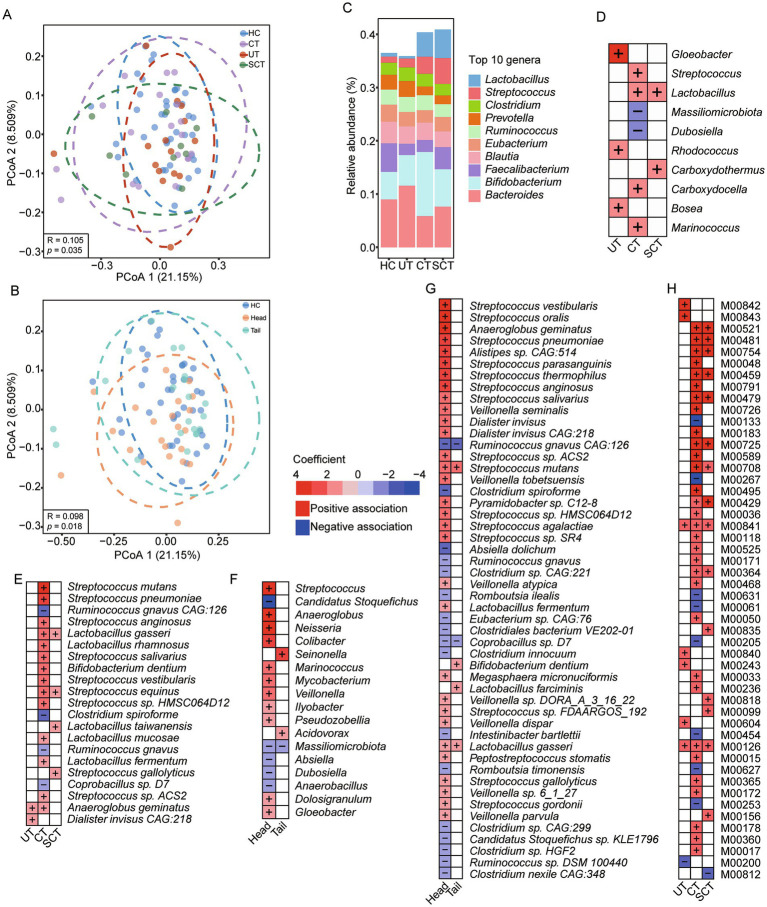
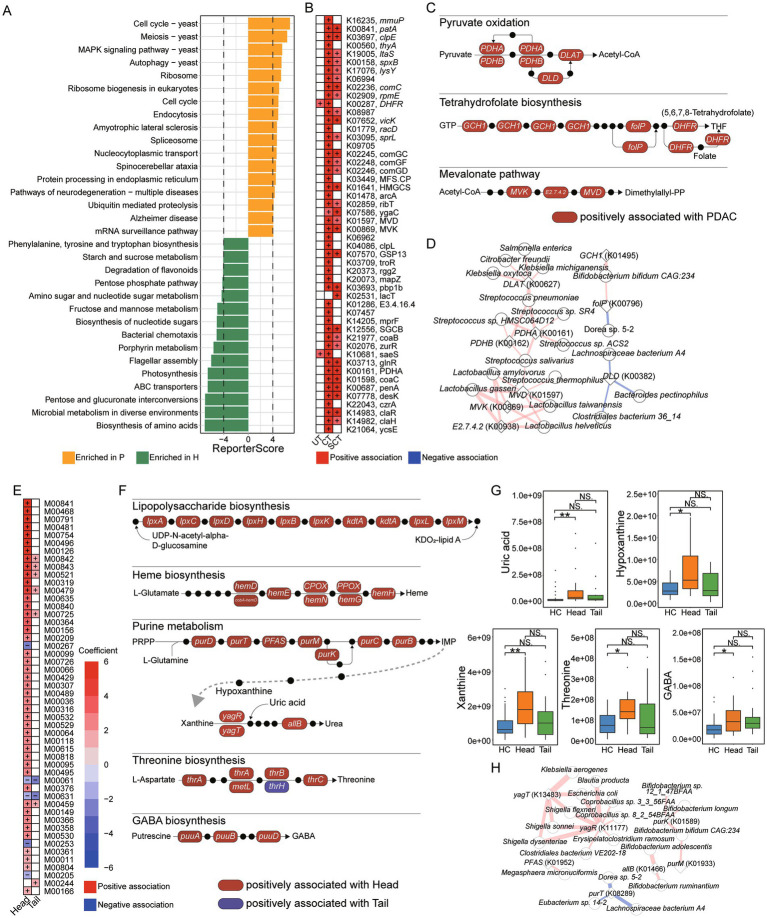
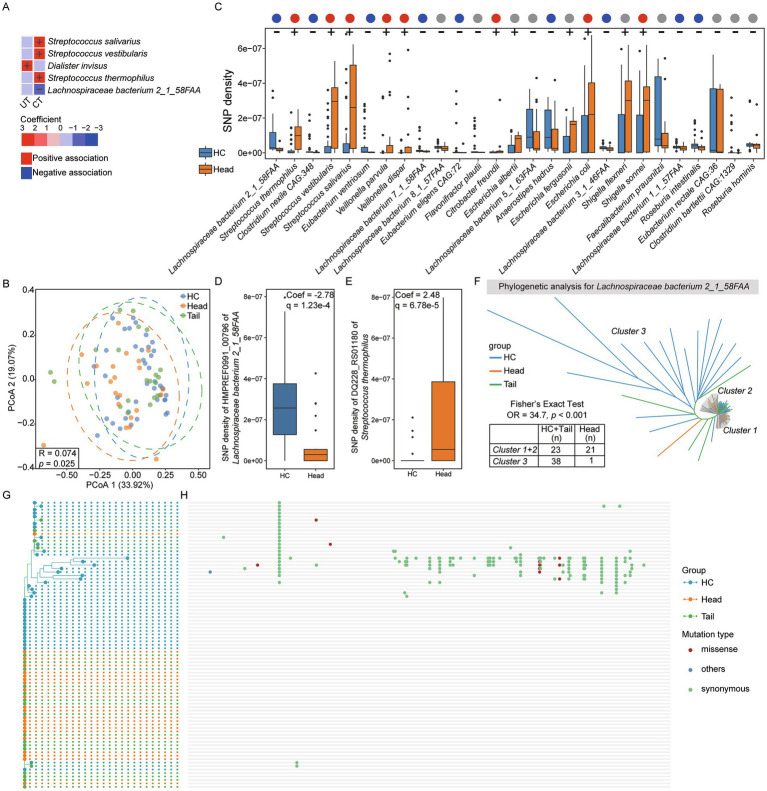
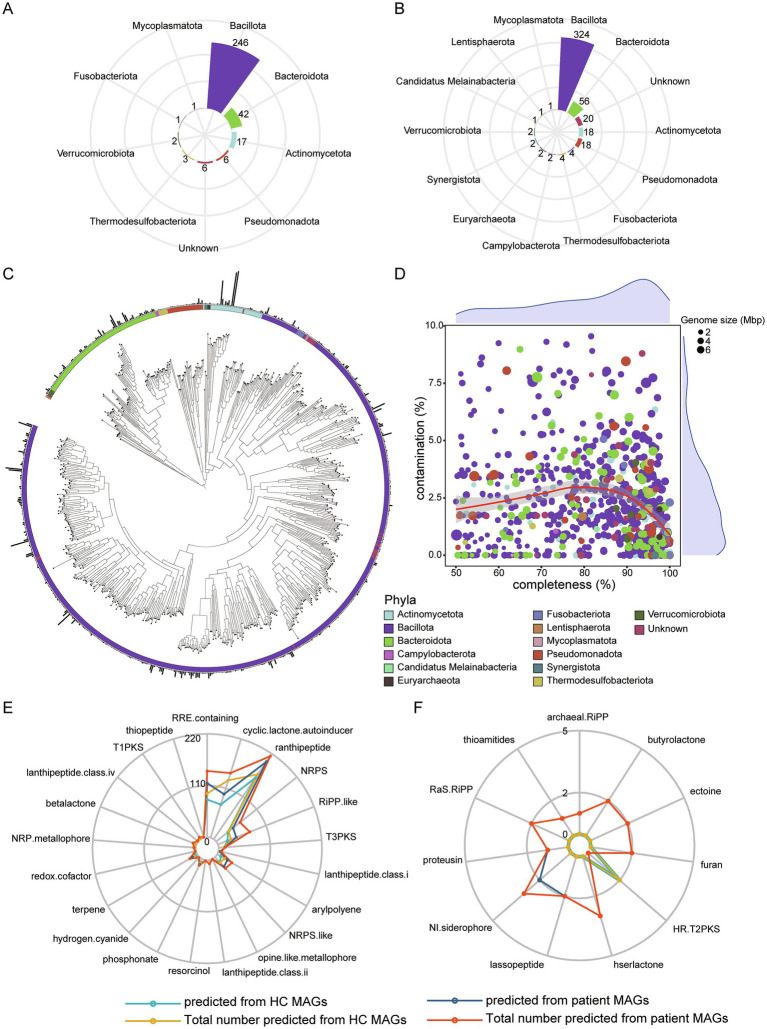
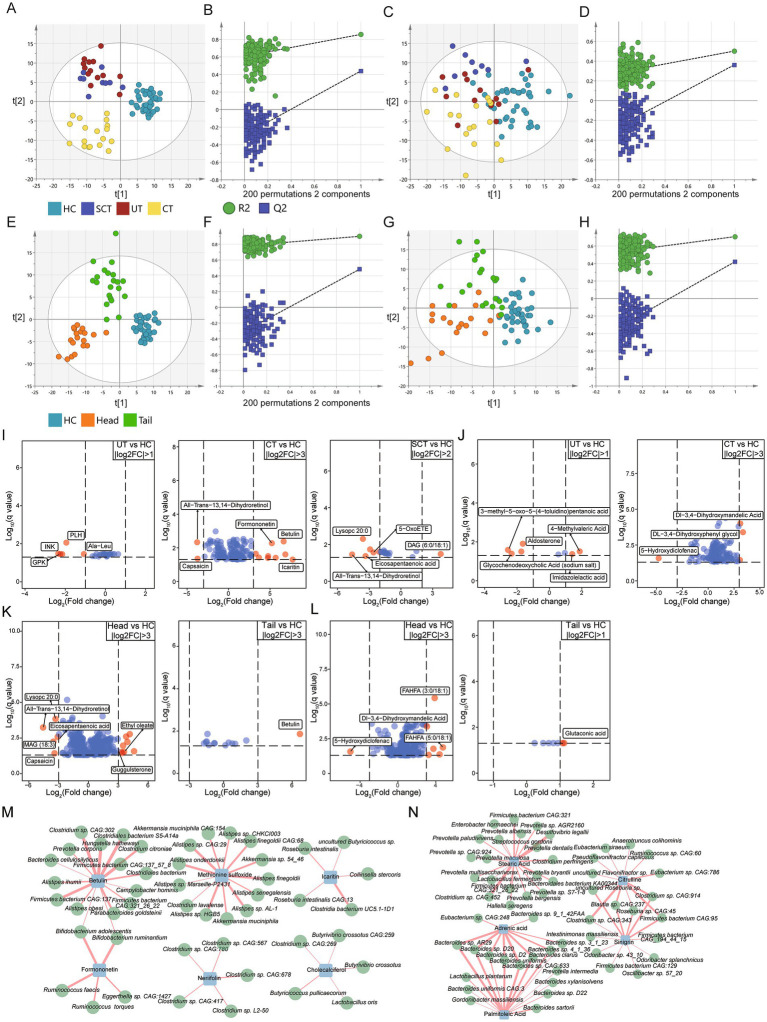
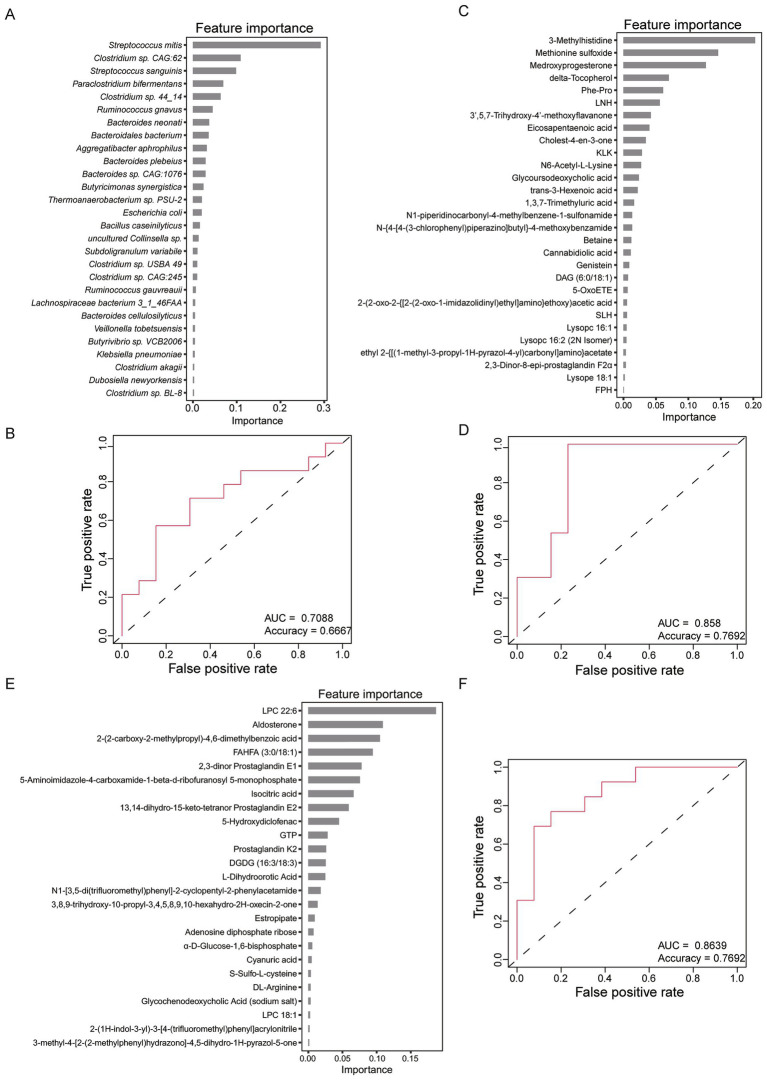
Pancreatic cancer is one of the most lethal malignant neoplasms. Pancreatic cancer is related to gut microbiota, but the associations between its treatment and microbial abundance as well as genetic variations remain unclear. In this study, we collected fecal samples from 58 pancreatic cancer patients including 43 pancreatic ductal adenocarcinoma (PDAC) and 15 non-PDAC, and 40 healthy controls, and shotgun metagenomic sequencing and untargeted metabolome analysis were conducted. PDAC patients were divided into five groups according to treatment and tumor location, including treatment-naive (UT), chemotherapy (CT), surgery combined with chemotherapy (SCT), Head, and body/tail (Tail) groups. Multivariate association analysis revealed that both CT and SCT were associated with increased abundance of Lactobacillus gasseri and Streptococcus equinus. The microbial single nucleotide polymorphisms (SNPs) densities of Streptococcus salivarius, Streptococcus vestibularis and Streptococcus thermophilus were positively associated with CT, while Lachnospiraceae bacterium 2_1_58FAA was positively associated with Head group. Compared with Tail group, the Head group showed positive associations with opportunistic pathogens, such as Escherichia coli, Shigella sonnei and Shigella flexneri. We assembled 424 medium-quality non-redundant metagenome-assembled genomes (nrMAGs) and 276 high-quality nrMAGs. In CT group, indole-3-acetic acid, capsaicin, sinigrin, chenodeoxycholic acid, and glycerol-3-phosphate were increased, and the accuracy of the model based on fecal metabolites reached 0.77 in distinguishing healthy controls and patients. This study identifies the associations between pancreatic cancer treatment and gut microbiota as well as its metabolites, reveals bacterial SNPs are related to tumor location, and extends our knowledge of gut microbiota and pancreatic cancer.

Keywords: gut microbiota; metabolome; metagenomic binning; pancreatic cancer; single nucleotide polymorphisms.


Conflict of interest statement

The authors declare that the research was conducted in the absence of any commercial or financial relationships that could be construed as a potential conflict of interest.

Figures

Figure 1
Figure 1
Differences of gut microbial composition across groups. (A) PCoA result of gut microbial composition among HC, UT, CT and SCT groups. (B) PCoA result of gut microbial composition among HC, Head and Tail groups. (C) The relative abundance of the top 10 genera in each group. (D) Analysis of associations between microbial genera and groups with the HC as the reference group using MaAslin2. (E) Analysis of associations between microbial species and groups with the HC as the reference group using MaAslin2. (F) Analysis of associations between microbial genera and groups with the HC as the reference group using MaAslin2. (G) Analysis of associations between microbial species and groups with the HC as the reference group using MaAslin2, and the top 50 significant associations are displayed. (H) Analysis of associations between microbial KEGG modules and groups with the HC as the reference group using MaAslin2, and the top 50 significant associations are displayed.
Figure 2
Figure 2
Microbial function and correlation analysis. (A) KO enrichment analysis for HC and patient groups. (B) Analysis of associations between microbial KO genes and groups with the HC as the reference group using MaAslin2, and the top 50 significant associations are displayed. (C) Microbial KEGG module analysis for “Pyruvate oxidation,” “Tetrahydrofolate biosynthesis,” “Tetrahydrofolate biosynthesis.” Red box represents microbial KO genes positively associated with PDAC group. Black dot represents an intermediate metabolite. (D) Pearson correlation analysis between microbial KO genes and species (|r| > 0.6). Red line represents positive correlation, and blue line represents negative correlation. The thickness of the line represents the strength of the correlation. (E) Analysis of associations between microbial KEGG modules and groups with the HC as the reference group using MaAslin2, and the top 50 significant associations are displayed. (F) Microbial KEGG module analysis for “Lipopolysaccharide biosynthesis,” “Heme biosynthesis,” “Purine metabolism,” “Threonine biosynthesis,” and “GABA biosynthesis.” Red box represents microbial KO genes positively associated with the Head group, and blue box represents microbial KO genes positively associated with the Tail group. Black dot represents an intermediate metabolite. (G) UHPLC–MS/MS analysis for fecal uric acid, hypoxanthine, xanthine, threonine and GABA levels. (H) Pearson correlation analysis between microbial KO genes involved in purine metabolism and species (|r| > 0.6). Red line represents positive correlation, and blue line represents negative correlation. The thickness of the line represents the strength of the correlation.
Figure 3
Figure 3
Single nucleotide polymorphisms analysis. (A) Setting HC as the reference group, association analysis between each group and microbial SNPs densities. (B) PCoA result for HC, Head and Tail groups. (C) Setting HC as the reference group, significant associations between the Head group and microbial SNPs densities (q < 0.25). The positive associations were indicated by “+,” and the negative associations were indicated by “-.” The red, blue and gray dots represent positive, negative, and no associations between Head group and microbes in abundance, respectively. (D) The most significant gene of Lachnospiraceae bacterium 2_1_58FAA associated with Head group. (E) The most significant gene of Streptococcus thermophilus 2_1_58FAA associated with Head group. (F) Phylogenetic analysis for Lachnospiraceae bacterium 2_1_58FAA genome based on all genes across 83 samples. G and H. Phylogenetic analysis for isoleucyl-tRNA synthetase (HMPREF0991_00796) of Lachnospiraceae bacterium 2_1_58FAA (G) and single nucleotide mutation sites analysis (H). The red dots represent missense mutations, green dots represent synonymous mutations and blue dots represent other mutation types.
Figure 4
Figure 4
De novo assembly and binning. (A) A total of 324 MAGs annotated to each phylum from HC dataset assembly. (B) A total of 455 MAGs annotated to each phylum from patient dataset assembly. (C) Phylogenetic analysis for 723 nrMAGs. (D) The distribution of completeness and contamination across nrMAGs. The color of point represents phylum, and the size of point represents the genome size of nrMAGs. (E) Microbial secondary metabolites predicted using antiSMASH based on all MAGs. (F) Specific microbial secondary metabolites predicted based on HC or patient MAGs.
Figure 5
Figure 5
Untargeted metabolome analysis. (A,C) The orthogonal partial least squares discriminant analysis (OPLS-DA) scores plot for HC, UT, CT and SCT groups based on metabolites of positive and negative ion mode, respectively. (B,D) Permutation test (n = 200) for OPLS-DA model of panels (A,C), respectively. (E,G) OPLS-DA scores plot for HC, Head and Tail groups based on metabolites of positive and negative ion mode, respectively. (F,H) Permutation test (n = 200) for OPLS-DA model of panels (E,G), respectively. (I) The top-ranked differential metabolites of positive ion mode for UT, CT and SCT compared with HC. (J) The top-ranked differential metabolites of negative ion mode for UT and CT compared with HC. (K,L) The top-ranked differential metabolites of positive and negative ion mode for Head and Tail compared with HC, respectively. Differential metabolites with higher fold changes in comparison between groups are displayed with red dots (q < 0.05). (M,N) Correlation analysis between 810 abundant microbes and differential metabolites of interest in positive and negative ion mode, respectively (|r| > 0.4, q < 0.05).
Figure 6
Figure 6
Classifiers for HC and pancreatic cancer patients using eXtreme Gradient Boosting (XGBoost) method. (A) The 28 optimal features of gut microbes selected for constructing classifier model. (B) Receiver operating characteristic (ROC) curve of the classifier based on 28 microbes. (C) The 29 optimal features of metabolites of the positive ion mode selected for constructing classifier model. (D) ROC curve of the classifier based on 29 metabolites of the positive ion mode. (E) The 25 optimal features of metabolites of the negative ion mode selected for constructing classifier model. (F) ROC curve of the classifier based on 25 metabolites of the negative ion mode.

Similar articles

References

    1. Alneberg J., Bjarnason B. S., de Bruijn I., Schirmer M., Quick J., Ijaz U. Z., et al. . (2014). Binning metagenomic contigs by coverage and composition. Nat. Methods 11, 1144–1146. doi: 10.1038/nmeth.3103, PMID: - DOI - PubMed
    1. Altieri B., Grant W. B., Della Casa S., Orio F., Pontecorvi A., Colao A., et al. . (2017). Vitamin D and pancreas: the role of sunshine vitamin in the pathogenesis of diabetes mellitus and pancreatic cancer. Crit. Rev. Food Sci. Nutr. 57, 3472–3488. doi: 10.1080/10408398.2015.1136922, PMID: - DOI - PubMed
    1. Arora R., Sawney S., Saini V., Steffi C., Tiwari M., Saluja D. (2016). Esculetin induces antiproliferative and apoptotic response in pancreatic cancer cells by directly binding to KEAP1. Mol. Cancer 15:64. doi: 10.1186/s12943-016-0550-2, PMID: - DOI - PMC - PubMed
    1. Asnicar F., Thomas A. M., Beghini F., Mengoni C., Manara S., Manghi P., et al. . (2020). Precise phylogenetic analysis of microbial isolates and genomes from metagenomes using PhyloPhlAn 3.0. Nat. Commun. 11:2500. doi: 10.1038/s41467-020-16366-7, PMID: - DOI - PMC - PubMed
    1. Bai C., Zhang X., Yang D., Li D., Feng H., Li Y. (2022). Clinical analysis of bloodstream infection of Escherichia coli in patients with pancreatic Cancer from 2011 to 2019. Can. J. Infect. Dis. Med. Microbiol. 2022, 1–8. doi: 10.1155/2022/1338188, PMID: - DOI - PMC - PubMed

LinkOut - more resources