. 2025 Apr 30;14(4):897-912.
doi: 10.21037/tau-2025-11. Epub 2025 Apr 27.

Piperlongumine inhibits renal cell carcinoma progression by modulating the DDX11-miR-15b-3p-DLD axis

Affiliations

Piperlongumine inhibits renal cell carcinoma progression by modulating the DDX11-miR-15b-3p-DLD axis

Zhenghao Zhang et al. Transl Androl Urol. .

Abstract

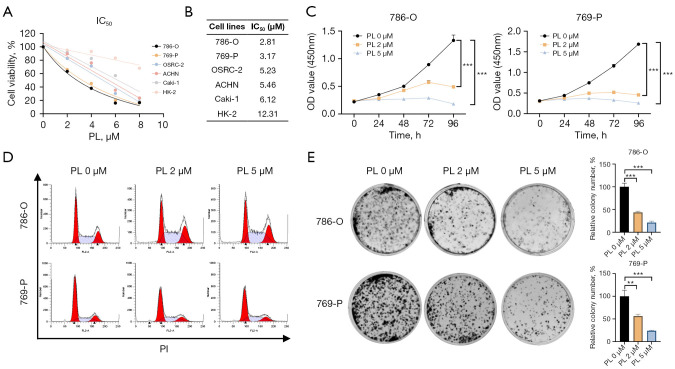
Background: Piperlongumine (PL) is a natural alkaloid obtained from the long pepper and can inhibit the progression of various tumors. However, its role in renal cell carcinoma (RCC) remains unclear. Thus, the purpose of this study was to determine whether PL can suppress RCC progression and to clarify the related mechanisms.

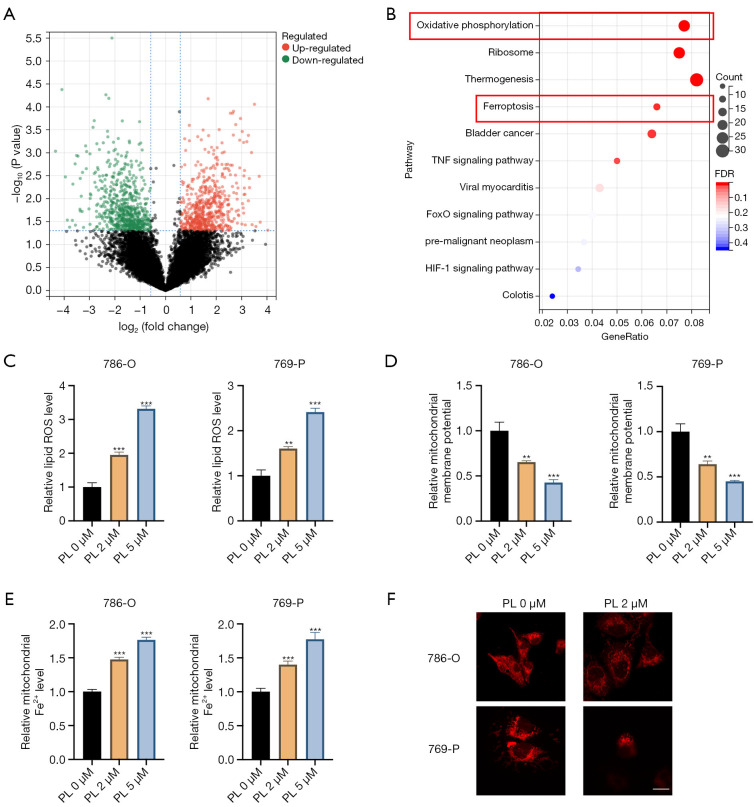
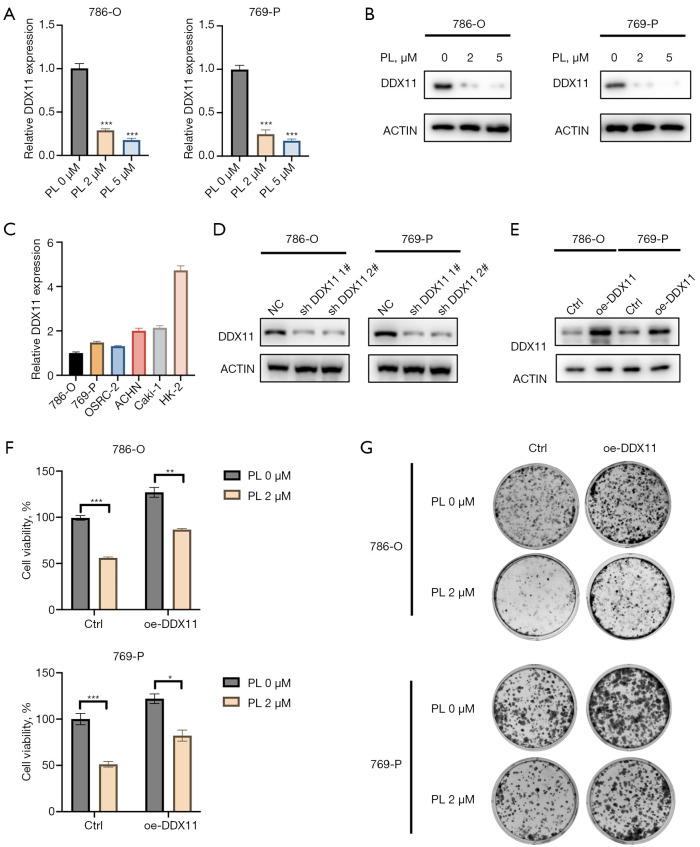
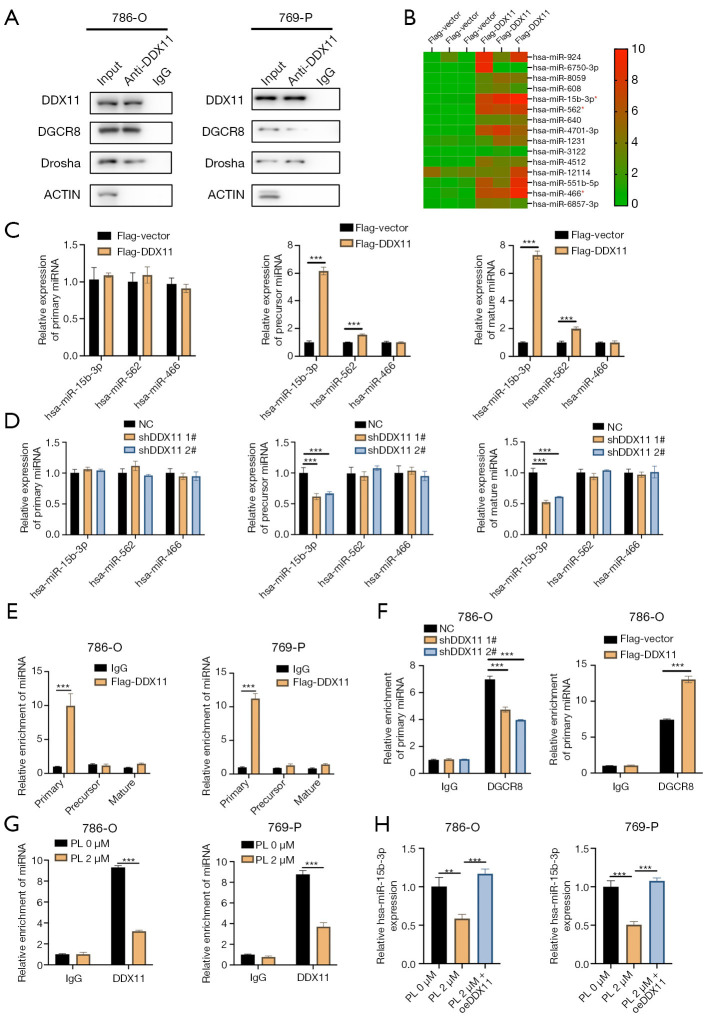
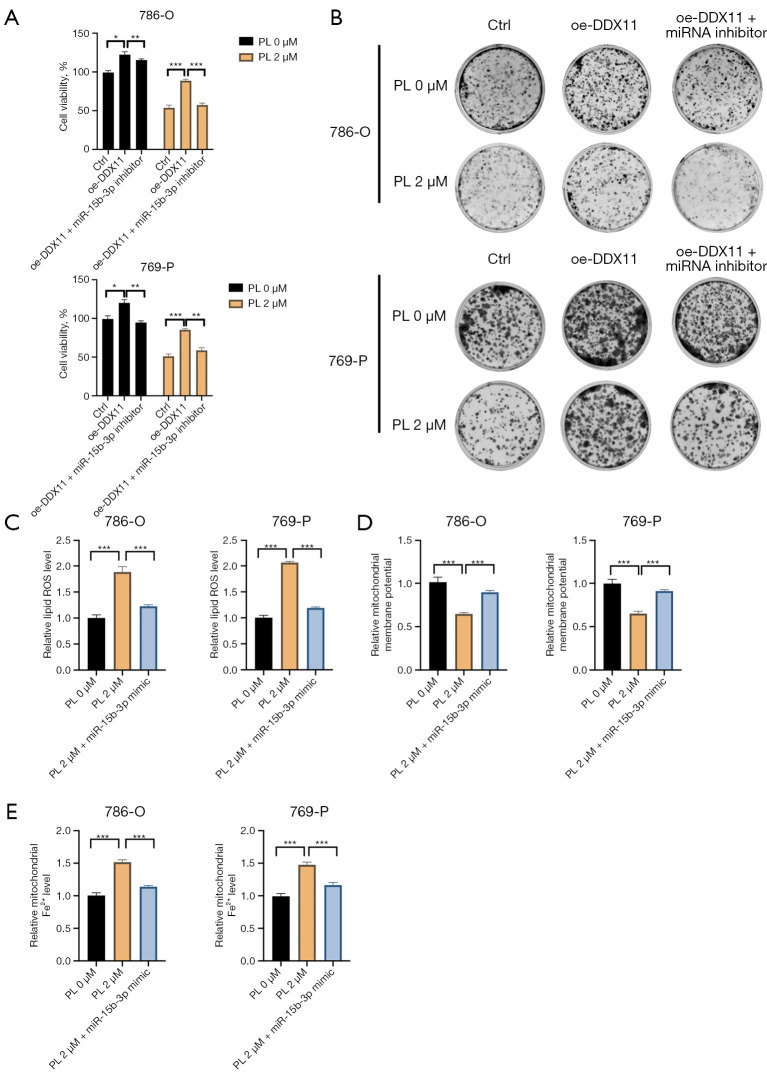
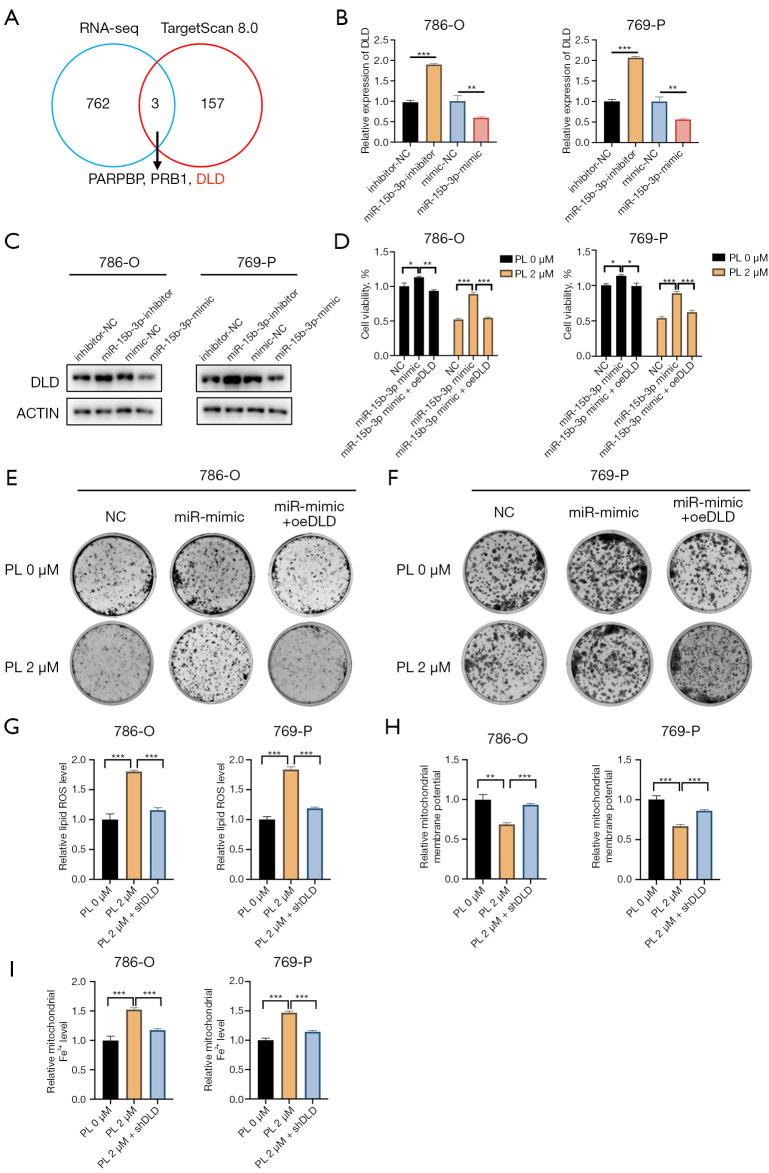
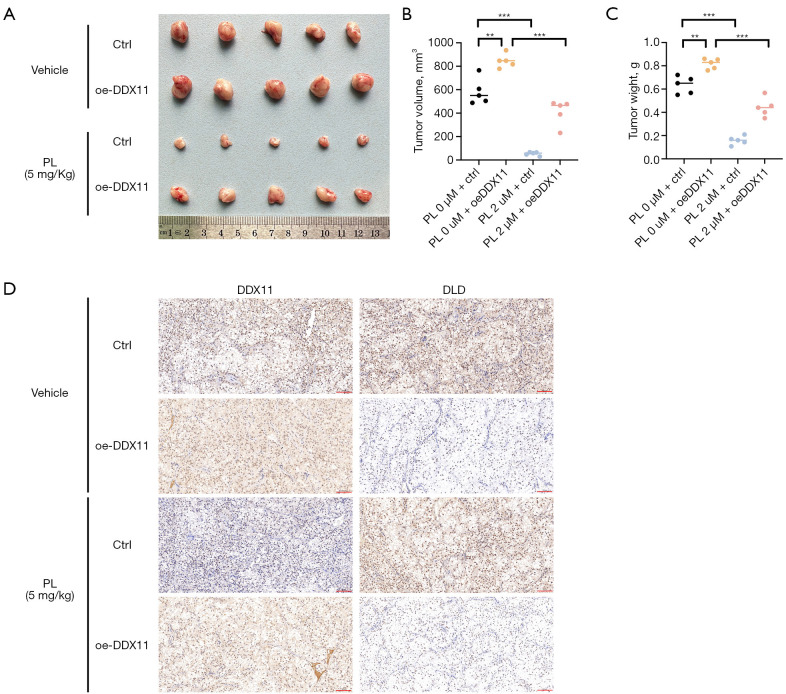
Methods: Cell Counting Kit-8 (CCK-8) and colony formation assays were applied to characterize the effect of PL in RCC cell proliferation; meanwhile, cellular reactive oxygen species (ROS), Fe2+ level, and mitochondrial membrane potential (MMP) assays were used to determine PL's role in mitochondrial homeostasis. Immunofluorescence experiments using MitoTracker red was applied to visualize the morphology of mitochondria. Western blotting and coimmunoprecipitation (Co-IP) and RNA immunoprecipitation (RNA-IP) assays were used to examine PL's regulation of DDX11 expression via miR-15b-3p. In addition, a xenograft mouse model was created to clarify the effect of DDX11 overexpression on RCC progression with or without PL treatment.

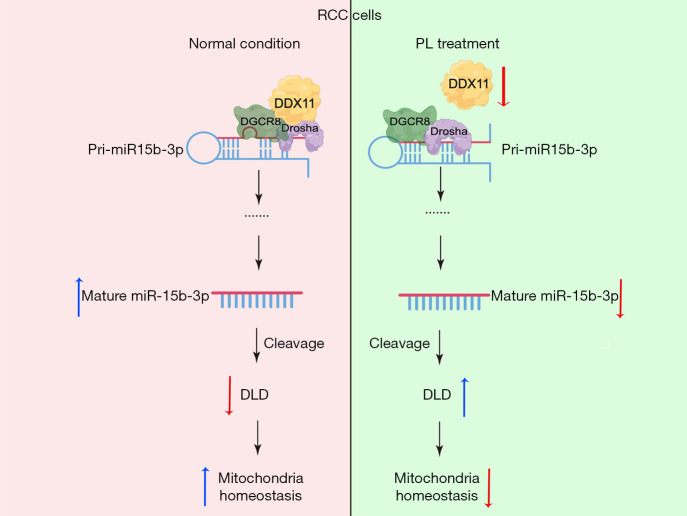
Results: We found that PL inhibited RCC cell proliferation in a dose-dependent manner by interfering with the mitochondrial homeostasis of RCC cells. In terms of mechanism, RNA sequencing showed that PL decreased the expression of DDX11, inhibited the maturation of miR-15b-3p, and further increased the level of dihydrolipoamide dehydrogenase (DLD) to disrupt the mitochondrial homeostasis of RCC cells. In addition, the vivo xenograft mouse model showed that DDX11 plays a stimulatory role in PL-induced RCC inhibition.

Conclusions: Our study demonstrated that DDX11 contributes to PL-induced RCC inhibition by modulating the miR-15b-3p-DLD axis.

Keywords: DDX11; Piperlongumine (PL); dihydrolipoamide dehydrogenase (DLD); miR-15b-3p; renal cell carcinoma (RCC).


Conflict of interest statement

Conflicts of Interest: All authors have completed the ICMJE uniform disclosure form (available at https://tau.amegroups.com/article/view/10.21037/tau-2025-11/coif). The authors have no conflicts of interest to declare.

Figures

Figure 1
Figure 1
PL inhibited renal cell carcinoma cell proliferation. (A) Cell viability of RCC and HK-2 cells treated with 0, 2, 4, 6, and 8 µM of PL for 48 h. Black dot represents 786-O cell line. (B) The IC50 of RCC and HK-2 cells was calculated according to the data in (A). (C) Cell viability of 786-O and 769-P cells treated with 0, 2, and 5 µM of PL for 0, 24, 48, 72, and 96 h. (D) Cell cycle was detected in 786-O and 769-P cells treated with 0, 2, and 5 µM of PL for 48 h. (E) Colony formation assays was performed in 786-O and 769-P cells treated with 0, 2, and 5 µM of PL for 10 days. Magnification 10×. The values are expressed the mean ± SEM. **, P<0.01; ***, P<0.001. IC50, half-maximal inhibitory concentration; OD, optical density; PI, propidium iodide; PL, piperlongumine; RCC, renal cell carcinoma; SEM, standard error of the mean.
Figure 2
Figure 2
PL impaired mitochondrial homeostasis (A) Volcano plot showing the dysregulated genes in 786-O cells treated with 2 µM of PL for 48 h. (B) KEGG analysis showing the dysregulated pathway in RNA-seq data. (C) The levels of ROS were detected in 786-O and 769-P cells treated with 0, 2, and 5 µM of PL for 48 h. (D) The MMP level was detected in 786-O and 769-P cells treated with 0, 2, and 5 µM of PL for 48 h. (E) The mitochondrial Fe2+ level was detected in 786-O and 769-P cells treated with 0, 2, and 5 µM of PL for 48 h. (F) The mitochondrial morphology was examined in 786-O and 769-P cells treated with 0 and 2 µM of PL for 48 h. Scale bar =10 µm. The values are expressed as the mean ± SEM. **, P<0.01; ***, P<0.001. FDR, false discovery rate; KEGG, Kyoto Encyclopedia of Genes and Genomes; MMP, mitochondrial membrane potential; PL, piperlongumine; ROS, reactive oxygen species; SEM, standard error of the mean; TNF, tumor necrosis factor.
Figure 3
Figure 3
PL decreased DDX11 expression in RCC. (A) qRT-PCR assays detected the relative DDX11 expression level in 786-O cells treated with 2 µM of PL for 48 h. (B) Western blot assays detected the DDX11 expression level in 786-O cells treated with 2 µM of PL for 48 h. Molecular weight: DDX11, 108 KDa; Actin, 42 KDa. (C) qRT-PCR assays detected the relative DDX11 expression level in RCC and HK-2 cell lines. (D) Western blot assays detected the knockdown efficiency of DDX11 in 786-O and 769-P cells. Molecular weight: DDX11, 108 KDa; Actin, 42 KDa. (E) Western blot assays detected the overexpression efficiency of DDX11 in 786-O and 769-P cells. (F) Cell viability of 786-O and 769-P cells with or without DDX11 treated with 0 and 2 µM of PL for 48 h. (G) Colony formation assays of 786-O and 769-P cells with or without DDX11 overexpression treated with 0 and 2 μM of PL for 48 h. Magnification: 10×. The values are expressed as the mean ± SEM. *, P<0.05; **, P<0.01; ***, P<0.001. DDX, DEAD-box helicase; PL, piperlongumine; qRT-PCR, reverse-transcription quantitative polymerase chain reaction; RCC, renal cell carcinoma; SEM, standard error of the mean.
Figure 4
Figure 4
PL decreased DDX11 expression in RCC. (A) Co-IP assays were used to examine the interaction between DDX11 and DGCR8 or Drosha. Molecular weight: DDX11, 108 KDa; Actin, 42 KDa. (B) Heatmap showing the dysregulated miRNAs with DDX11 overexpression. (C) Relative primary, precursor, and mature miRNA expression in 786-O cells with DDX11 overexpression. (D) Relative primary, precursor, and mature miRNA expression in 786-O cells with DDX11 knockdown. (E) RIP-qPCR assays detected the relative enrichment of primary, precursor, or mature miR-15b-3p to Flag-DDX11 in 786-O and 769-P cells. (F) RIP-qPCR assays detected the relative enrichment of primary miR-15b-3p to DGCR8 in 786-O cells with DDX11 knockdown or overexpression. (G) RIP-qPCR assays detected the relative enrichment of primary miR-15b-3p to DDX11 in 786-O and 769-P cells under PL treatment. (H) Relative miR-15b-3p expression in 786-O and 769-P cells treated with 0 and 2 µM of PL for 48 h with or without DDX11 overexpression. The values are expressed as the mean ± SEM. *, P<0.05; **, P<0.01; ***, P<0.001. Co-IP, co-immunoprecipitation; DDX, DEAD-box helicase; IgG, immunoglobulin G; RCC, renal cell carcinoma; RIP-qPCR, RNA immunoprecipitation-quantitative polymerase chain reaction; SEM, standard error of the mean.
Figure 5
Figure 5
PL inhibited renal cell carcinoma progression by regulating the DDX11-miR-15b-3p axis. (A) Cell viability of 786-O and 769-P cells with DDX11 overexpression or miR-15b-3p inhibition treated with 0 and 2 µM of PL for 48 h. (B) Colony formation assays of 786-O and 769-P cells with DDX11 overexpression or miR-15b-3p inhibition treated with 0 and 2 µM of PL for 48 h. Magnification 10×. (C) The levels of ROS were detected in 786-O and 769-P cells with miR-15b-3p overexpression treated with 0 and 2 µM of PL for 48 h. (D) The MMP was detected in 786-O and 769-P cells with miR-15b-3p overexpression treated with 0 and 2 µM of PL for 48 h. (E) The mitochondrial Fe2+ level was detected in 786-O and 769-P cells with miR-15b-3p overexpression treated with 0 and 2 µM of PL for 48 h. The values are expressed as the mean ± SEM. *, P<0.05; **, P<0.01; ***, P<0.001. DDX, DEAD-box helicase; MMP, mitochondrial membrane potential; PL, piperlongumine; ROS, reactive oxygen species; SEM, standard error of the mean.
Figure 6
Figure 6
DLD was regulated by the PL-DDX11-miR-15b-3p axis. (A) Venn diagram showing that PARPBP, PRB1, and DLD were all included in RNA-seq data and TargetScan predicted result. (B) qRT-PCR detected the relative expression of DLD in 786-O and 769-P cells with miR-15b-3p overexpression or inhibition. (C) Western blotting detected the relative expression of DLD in 786-O and 769-P cells with miR-15b-3p overexpression or inhibition. (D) Cell viability of 786-O and 769-P cells with miR-15b-3p overexpression or DLD overexpression treated with 0 and 2 µM of PL for 48 h. (E,F) Colony formation assays of 786-O and 769-P cells with miR-15b-3p overexpression or DLD overexpression treated with 0 and 2 µM of PL for 48 h. Magnification 10×. (G) The levels of ROS were detected in 786-O and 769-P cells with DLD knockdown treated with 0 and 2 µM of PL for 48 h. (H) The MMP was detected in 786-O and 769-P cells with DLD knockdown treated with 0 and 2 µM of PL for 48 h. (I) The mitochondrial Fe2+ level was detected in 786-O and 769-P cells with DLD knockdown treated with 0 and 2 µM of PL for 48 h. The values are expressed as the mean ± SEM. *, P<0.05; **, P<0.01; ***, P<0.001. DDX, DEAD-box helicase; DLD, dihydrolipoamide dehydrogenase; NC, negative control; PL, piperlongumine; qRT-PCR, reverse-transcription quantitative polymerase chain reaction; SEM, standard error of the mean.
Figure 7
Figure 7
DDX11 was critically involved in the PL-induced inhibition of RCC. (A-C) The volume and weight of subcutaneous tumors in xenograft mice treated with 0 and 5 mg/kg of PL with and without DDX11 overexpression. (D) IHC staining detected expression of DDX11 and DLD in each group. Scale bar =100 µm. The values are expressed as the mean ± SEM. **, P<0.01; ***, P<0.001. DDX, DEAD-box helicase; DLD, dihydrolipoamide dehydrogenase; IHC, immunohistochemistry; PL, piperlongumine; RCC, renal cell carcinoma; SEM, standard error of the mean.
Figure 8
Figure 8
Schematic diagram depicting the role of PL in RCC. DDX, DEAD-box helicase; DLD, dihydrolipoamide dehydrogenase; PL, piperlongumine; RCC, renal cell carcinoma.

Similar articles

References

    1. Siegel RL, Miller KD, Fuchs HE, et al. Cancer Statistics, 2021. CA Cancer J Clin 2021;71:7-33. 10.3322/caac.21654 - DOI - PubMed
    1. Chen YW, Panian J, Rose B, et al. Recent Developments in the Management of Renal Cell Cancer. JCO Oncol Pract 2025. [Epub ahead of print]. doi: .10.1200/OP-24-00875 - DOI - PubMed
    1. Pham DX, Hsu T. Tumor-initiating and metastasis-initiating cells of clear-cell renal cell carcinoma. J Biomed Sci 2025;32:17. 10.1186/s12929-024-01111-9 - DOI - PMC - PubMed
    1. Huang RS, Chow R, Benour A, et al. Comparative efficacy and safety of ablative therapies in the management of primary localised renal cell carcinoma: a systematic review and meta-analysis. Lancet Oncol 2025;26:387-98. 10.1016/S1470-2045(24)00731-9 - DOI - PubMed
    1. Giri VK, Zaemes J. The selection of targeted therapies for relapsed or refractory advanced renal cell carcinoma. Expert Rev Anticancer Ther 2025;25:337-49. 10.1080/14737140.2025.2468765 - DOI - PubMed

LinkOut - more resources