. 2025 Apr 30;14(4):1082-1110.
doi: 10.21037/tau-2025-39. Epub 2025 Apr 27.

Development and validation of tryptophan metabolism-related risk model and molecular subtypes for predicting postoperative biochemical recurrence in prostate cancer

Affiliations

Development and validation of tryptophan metabolism-related risk model and molecular subtypes for predicting postoperative biochemical recurrence in prostate cancer

Yuan Shao et al. Transl Androl Urol. .

Abstract

Background: Biochemical recurrence (BCR) following radical prostatectomy (RP) remains a major challenge in prostate cancer (PCa) management. Tryptophan metabolism plays a pivotal role in tumor progression and immune modulation. This study aimed to develop and validate a tryptophan metabolism-related risk model and molecular subtypes to predict BCR in PCa patients after RP.

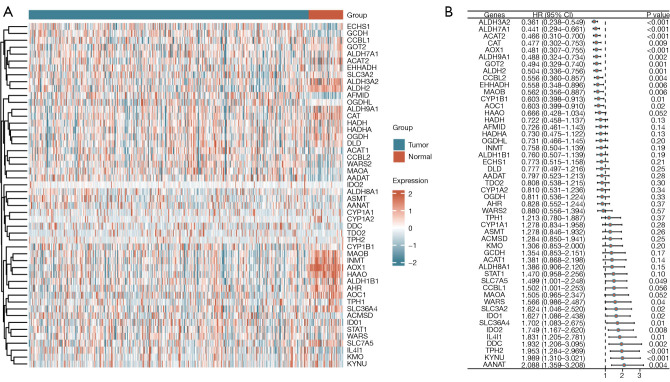
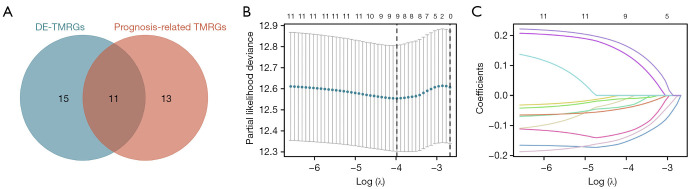
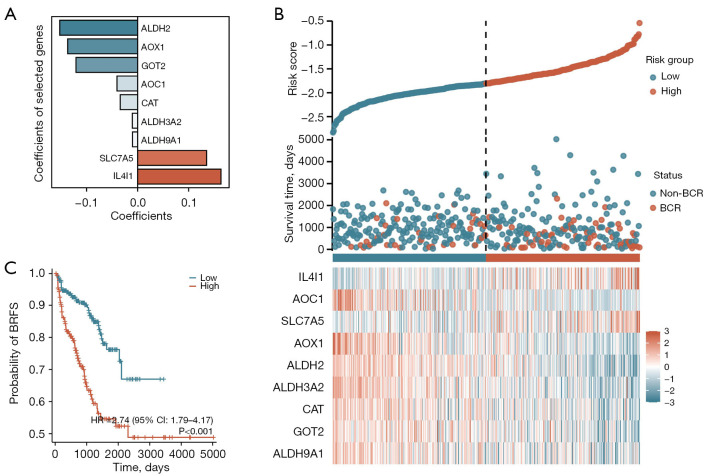
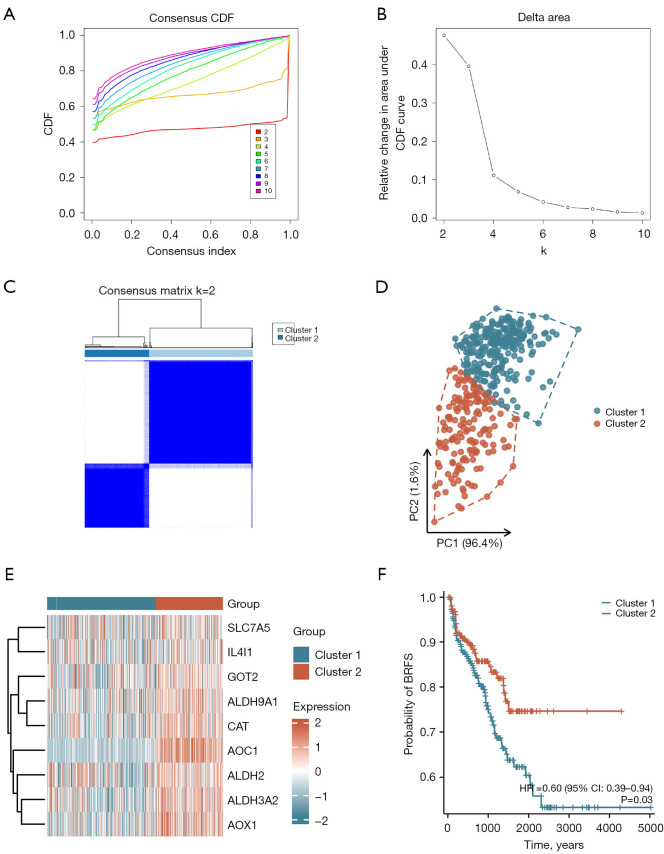
Methods: The Cancer Genome Atlas-Prostate Adenocarcinoma (TCGA-PRAD) dataset, including 421 PCa patients, was analyzed to identify key tryptophan metabolism-related genes (TMRGs) using differential expression, univariate Cox, and the least absolute shrinkage and selection operator (LASSO) regression analyses. The tryptophan metabolism-related risk model was constructed through multivariate Cox regression, and tryptophan metabolism-related molecular subtypes were established using consensus clustering. External validation was conducted using an independent dataset, while immunohistochemistry (IHC) and single-cell sequencing further confirmed TMRG expression patterns and their roles in the tumor microenvironment (TME).

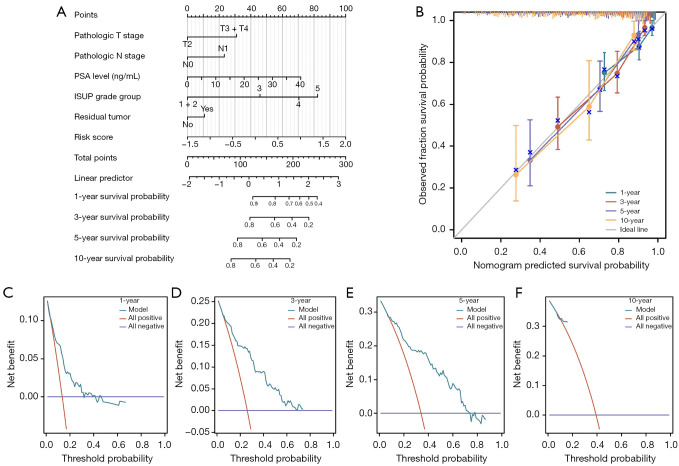
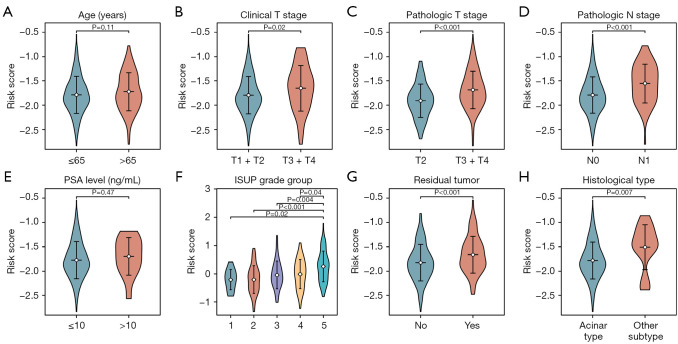
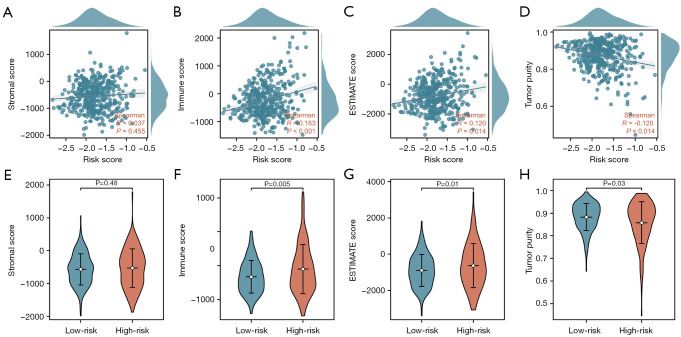
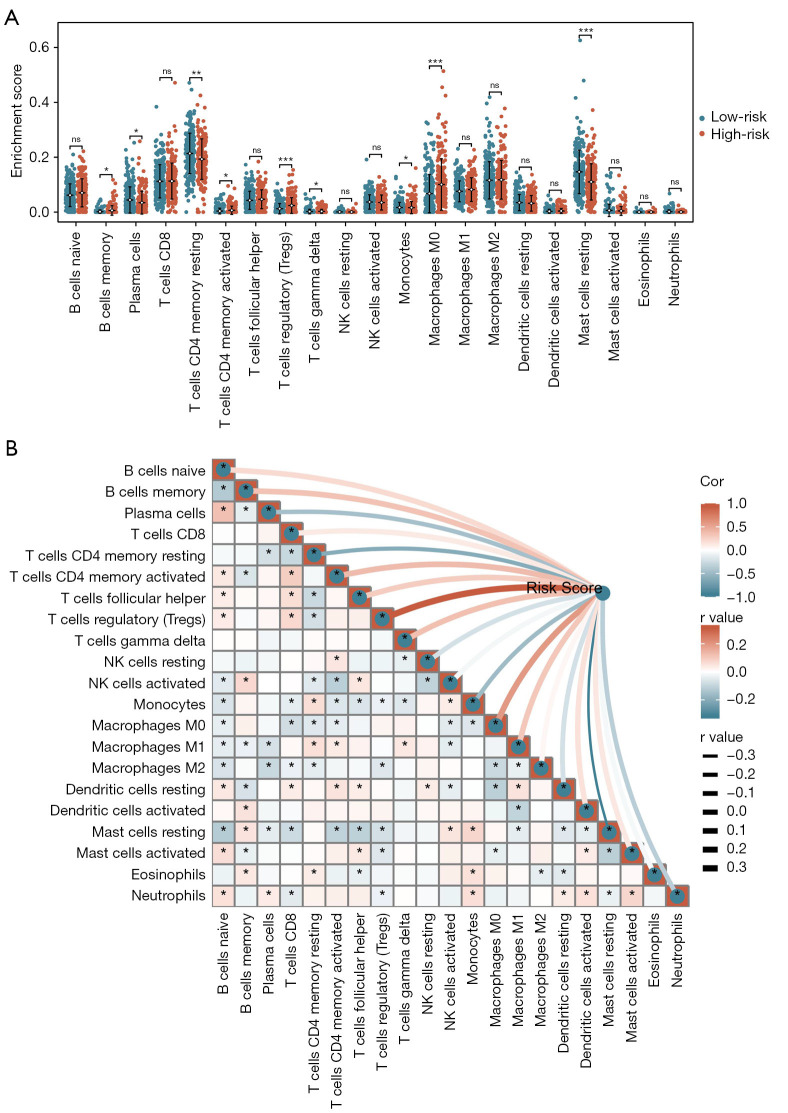
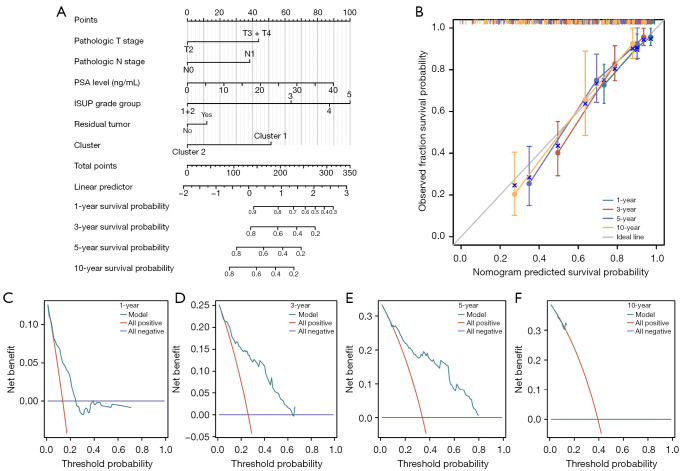
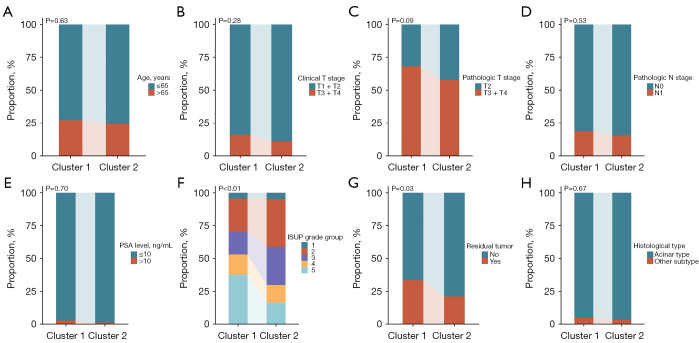
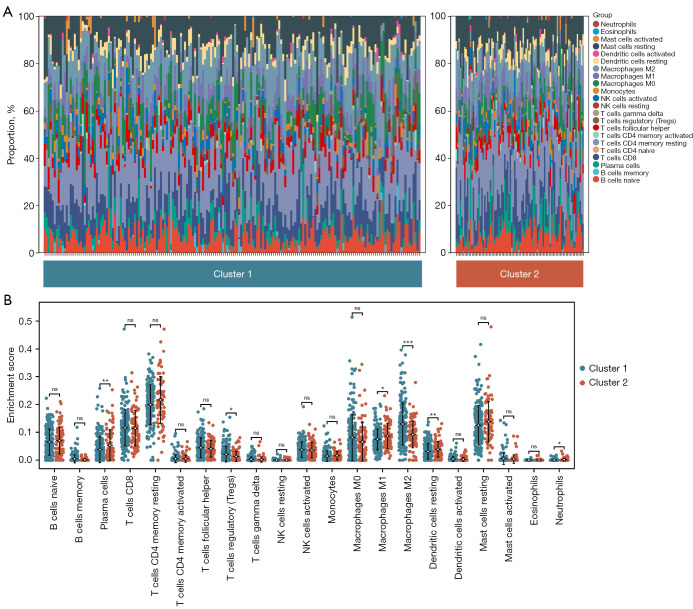
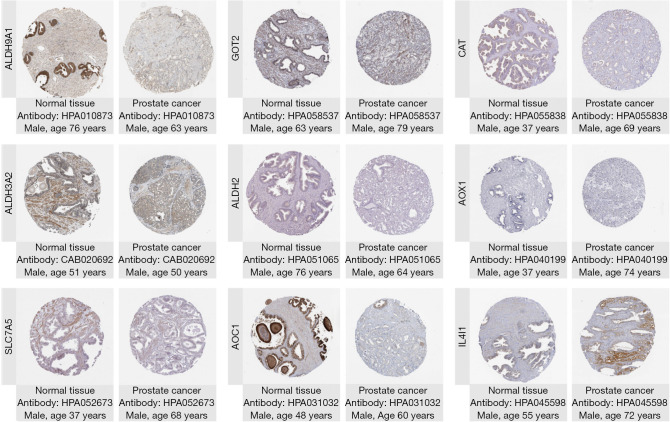
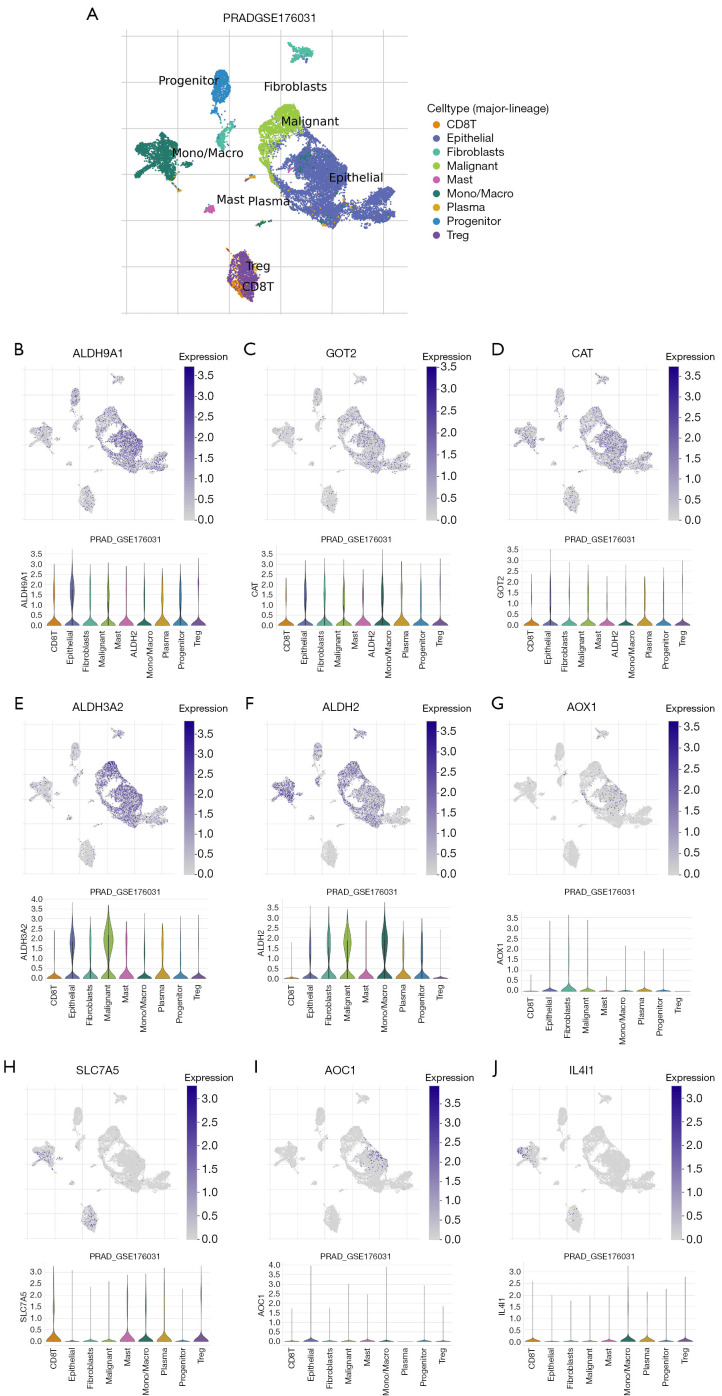
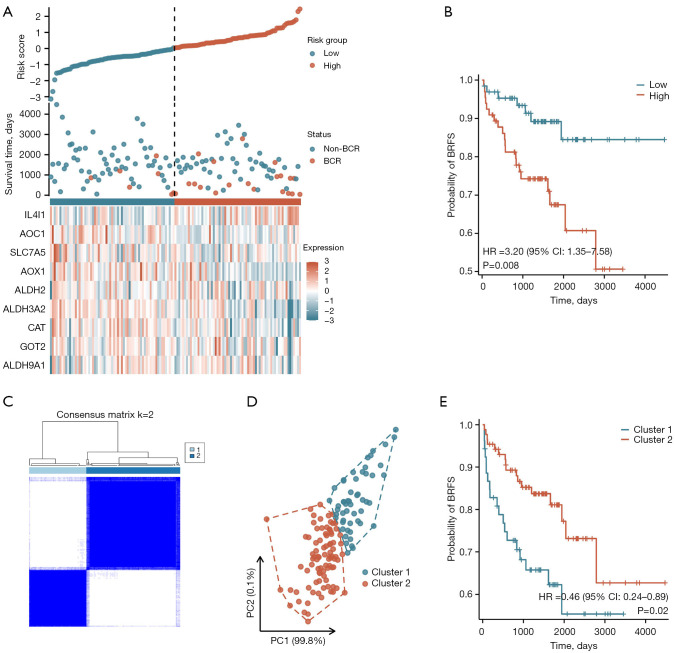
Results: The tryptophan metabolism-related risk model and molecular subtypes effectively stratified PCa patients into low- and high-risk groups or two molecular subtypes. High-risk PCa patients (n=211) and those in Cluster 1 (n=261) exhibited significantly poorer biochemical recurrence-free survival (BRFS) and distinct clinicopathological features, immune infiltration profiles, and TME characteristics. External validation confirmed the robustness of the tryptophan metabolism-related risk model and molecular subtypes. IHC and single-cell sequencing highlighted the expression patterns of TMRGs and their regulatory roles in the TME.

Conclusions: This study established and validated tryptophan metabolism-related risk scores and molecular subtypes as reliable predictors of BCR in PCa patients after RP. These findings provide a foundation for personalized follow-up and treatment strategies, contributing to improved clinical outcomes in PCa management.

Keywords: Prostate cancer (PCa); biochemical recurrence (BCR); molecular subtypes; risk model; tryptophan.


Conflict of interest statement

Conflicts of Interest: All authors have completed the ICMJE uniform disclosure form (available at https://tau.amegroups.com/article/view/10.21037/tau-2025-39/coif). The authors have no conflicts of interest to declare.

Figures

Figure 1
Figure 1
Expression patterns and prognostic value analysis of TMRGs in PCa. (A) Heatmap showing the expression levels of 50 TMRGs in PCa tissues and normal prostate tissues. (B) Forest plot of univariate Cox regression analysis results for the 50 TMRGs in PCa patients. CI, confidence interval; HR, hazard ratio; PCa, prostate cancer; TMRGs, tryptophan metabolism-related genes.
Figure 2
Figure 2
Screening and identification of key TMRGs in PCa. (A) Venn diagram of DE-TMRGs and prognosis-related TMRGs in PCa. (B,C) Results of LASSO regression analysis for the 9 key TMRGs. DE-TMRGs, differentially expressed tryptophan metabolism-related genes; LASSO, least absolute shrinkage and selection operator; PCa, prostate cancer; TMRGs, tryptophan metabolism-related genes.
Figure 3
Figure 3
Construction of the tryptophan metabolism-related risk model based on key TMRGs. (A) Bar chart displaying the coefficients of the 9 key TMRGs in the tryptophan metabolism-related risk score formula. (B) Distribution of the tryptophan metabolism-related risk scores and postoperative BCR status in PCa patients, along with the heatmap showing the expression levels of the 9 key TMRGs in the low-risk and high-risk groups. (C) Kaplan-Meier survival curve for postoperative BRFS in low-risk and high-risk PCa patient groups. BCR, biochemical recurrence; BRFS, biochemical recurrence-free survival; CI, confidence interval; PCa, prostate cancer; TMRGs, tryptophan metabolism-related genes.
Figure 4
Figure 4
Development and evaluation of the prognostic nomogram for postoperative BRFS of PCa patients based on the tryptophan metabolism-related risk scores. (A) Nomogram predicting 1-, 3-, 5-, and 10-year postoperative BRFS for PCa patients based on the tryptophan metabolism-related risk scores. (B) Calibration curves for the nomogram predicting 1-, 3-, 5-, and 10-year postoperative BRFS for PCa patients. (C-F) DCA results for the predictive model of 1-, 3-, 5-, and 10-year postoperative BRFS in PCa patients. BRFS, biochemical recurrence-free survival; DCA, decision curve analysis; PCa, prostate cancer; PSA, prostate-specific antigen; ISUP, International Society of Urological Pathology.
Figure 5
Figure 5
Correlation analysis between tryptophan metabolism-related risk scores and clinicopathological factors in PCa patients. (A-H) Comparison of risk scores by age, clinical T stage, pathological T stage, pathological N stage, PSA levels, ISUP grade group, surgical margin status, and histological subtypes of PCa patients. ISUP, International Society of Urological Pathology; PCa, prostate cancer; PSA, prostate-specific antigen.
Figure 6
Figure 6
Correlation analysis between tryptophan metabolism-related risk scores and TME scores in PCa patients. (A-D) Scatter plots showing correlations with stromal score, immune score, ESTIMATE score, and tumor purity. (E-H) Comparison of these TME scores between low- and high-risk groups. PCa, prostate cancer; TME, tumor microenvironment.
Figure 7
Figure 7
Correlation analysis between the tryptophan metabolism-related risk scores and the abundance of TME immune cell infiltration in PCa patients. (A) Comparison of the infiltration abundance of 22 immune cell types between the low- and high-risk groups of PCa patients. (B) Network heatmap showing the correlation between the tryptophan metabolism-related risk score and the abundance of TME immune cell infiltration. ***, P<0.001; **, P<0.01; *, P<0.05; ns, not significance. PCa, prostate cancer; TME, tumor microenvironment.
Figure 8
Figure 8
Construction of the tryptophan metabolism-related molecular subtypes based on key TMRGs. (A) CDF curve from consensus clustering analysis. (B) Trend of changes in the area under the CDF curve. (C) Clustering analysis results based on key TMRGs. (D) PCA analysis results. (E) Heatmap showing the expression levels of 9 key TMRGs across different molecular subtypes in PCa patients. (F) Kaplan-Meier survival curve of postoperative BRFS among PCa patients with different molecular subtypes. BRFS, biochemical recurrence-free survival; CDF, cumulative distribution function; CI, confidence interval; PC, principal component; PCa, prostate cancer; PCA, principal component analysis; TMRGs, tryptophan metabolism-related genes.
Figure 9
Figure 9
Development and evaluation of the prognostic nomogram for postoperative BRFS of PCa patients based on the tryptophan metabolism-related molecular subtypes. (A) Nomogram predicting 1-, 3-, 5-, and 10-year postoperative BRFS for PCa patients based on tryptophan metabolism-related molecular subtypes. (B) Calibration curves for the nomogram predicting 1-, 3-, 5-, and 10-year postoperative BRFS for PCa patients. (C-F) DCA results for the predictive model of 1-, 3-, 5-, and 10-year postoperative BRFS in PCa patients. BRFS, biochemical recurrence-free survival; DCA, decision curve analysis; ISUP, International Society of Urological Pathology; PCa, prostate cancer; PSA, prostate-specific antigen.
Figure 10
Figure 10
Correlation analysis between tryptophan metabolism-related molecular subtypes and clinicopathological factors in PCa patients. (A-H) Comparison of age, clinical T stage, pathological T stage, pathological N stage, PSA levels, ISUP grade group, surgical margin status, and histological subtypes between the two molecular subtypes. ISUP, International Society of Urological Pathology; PCa, prostate cancer; PSA, prostate-specific antigen.
Figure 11
Figure 11
Correlation analysis between tryptophan metabolism-related molecular subtypes and the abundance of TME immune cell infiltration in PCa patients. (A) The abundance of 22 immune cell types in PCa patients with two molecular subtypes. (B) Comparison of the infiltration abundance of 22 immune cell types between the two molecular subtypes in PCa patients. ***, P<0.001; **, P<0.01; *, P<0.05; ns, not significance. NK, natural killer; PCa, prostate cancer; TME, tumor microenvironment.
Figure 12
Figure 12
Representative immunohistochemical images of the 9 key TMRGs in PCa tissues and normal prostate tissues (Image credit: Human Protein Atlas). ALDH9A1, Normal Tissue: https://images.proteinatlas.org/10873/27713_A_1_5.jpg; Prostate Cancer: https://images.proteinatlas.org/10873/27710_A_9_8.jpg. GOT2, Normal Tissue: https://images.proteinatlas.org/58537/170840_A_1_5.jpg; Prostate Cancer: https://images.proteinatlas.org/58537/170837_A_8_3.jpg. CAT, Normal Tissue: https://images.proteinatlas.org/55838/135658_A_2_5.jpg; Prostate Cancer: https://images.proteinatlas.org/55838/135648_A_7_1.jpg. ALDH3A2, Normal Tissue: https://images.proteinatlas.org/20692/47290_A_3_5.jpg; Prostate Cancer: https://images.proteinatlas.org/20692/47287_A_7_1.jpg. ALDH2, Normal Tissue: https://images.proteinatlas.org/51065/119531_A_1_5.jpg; Prostate Cancer: https://images.proteinatlas.org/51065/119535_A_7_3.jpg. AOX1, Normal Tissue: https://images.proteinatlas.org/40199/166606_A_2_5.jpg; Prostate Cancer: https://images.proteinatlas.org/40199/166603_A_7_2.jpg. SLC7A5, Normal Tissue: https://images.proteinatlas.org/52673/134067_A_2_5.jpg; Prostate Cancer: https://images.proteinatlas.org/52673/134070_A_8_6.jpg. AOC1, Normal Tissue: https://images.proteinatlas.org/31032/72997_A_3_5.jpg; Prostate Cancer: https://images.proteinatlas.org/31032/72993_A_7_3.jpg. IL4I1, Normal Tissue: https://images.proteinatlas.org/45598/102705_A_3_5.jpg; Prostate Cancer: https://images.proteinatlas.org/45598/102702_A_7_6.jpg. TMRGs, tryptophan metabolism-related genes; PCa, prostate cancer.
Figure 13
Figure 13
Single-cell localization of nine key TMRGs and their correlation with immune cell infiltration in PCa tissues based on the single-cell sequencing. (A) Distribution of nine cell types. (B-J) Single-cell localization of ALDH9A1, GOT2, CAT, ALDH3A2, ALDH2, AOX1, SLC7A5, AOC1, and IL4I1. PCa, prostate cancer; TMRGs, tryptophan metabolism-related genes.
Figure 14
Figure 14
Validation of the tryptophan metabolism-related risk scores and molecular subtypes in an external independent cohort. (A) Distribution of the tryptophan metabolism-related risk scores and postoperative BCR status in the validation cohort, along with the heatmap showing the expression levels of 9 key TMRGs in low-risk and high-risk groups of PCa patients. (B) Survival curves of postoperative BRFS for low-risk and high-risk PCa patients in the validation cohort. (C) Clustering analysis results based on key TMRGs in the validation cohort. (D) PCA analysis results in the validation cohort. (E) Survival curves of postoperative BRFS for different molecular subtypes in the validation cohort. BCR, biochemical recurrence; BRFS, biochemical recurrence-free survival; CI, confidence interval; PC, principal component; PCa, prostate cancer; PCA, principal component analysis; TMRGs, tryptophan metabolism-related genes.

Similar articles

References

    1. Siegel RL, Giaquinto AN, Jemal A. Cancer statistics, 2024. CA Cancer J Clin 2024;74:12-49. 10.3322/caac.21820 - DOI - PubMed
    1. Wei JT, Barocas D, Carlsson S, et al. Early Detection of Prostate Cancer: AUA/SUO Guideline Part I: Prostate Cancer Screening. J Urol 2023;210:46-53. 10.1097/JU.0000000000003491 - DOI - PMC - PubMed
    1. Schafer EJ, Laversanne M, Sung H, et al. Recent Patterns and Trends in Global Prostate Cancer Incidence and Mortality: An Update. Eur Urol 2025;87:302-13. 10.1016/j.eururo.2024.11.013 - DOI - PMC - PubMed
    1. Cornford P, van den Bergh RCN, Briers E, et al. EAU-EANM-ESTRO-ESUR-ISUP-SIOG Guidelines on Prostate Cancer-2024 Update. Part I: Screening, Diagnosis, and Local Treatment with Curative Intent. Eur Urol 2024;86:148-63. 10.1016/j.eururo.2024.03.027 - DOI - PubMed
    1. Zaorsky NG, Calais J, Fanti S, et al. Salvage therapy for prostate cancer after radical prostatectomy. Nat Rev Urol 2021;18:643-68. 10.1038/s41585-021-00497-7 - DOI - PubMed

LinkOut - more resources