

Effects of binocularity and eye dominance on visually-driven ocular tracking
- PMID: 40376610
- PMCID: PMC12078213
- DOI: 10.3389/fnins.2025.1504628
Effects of binocularity and eye dominance on visually-driven ocular tracking
Abstract
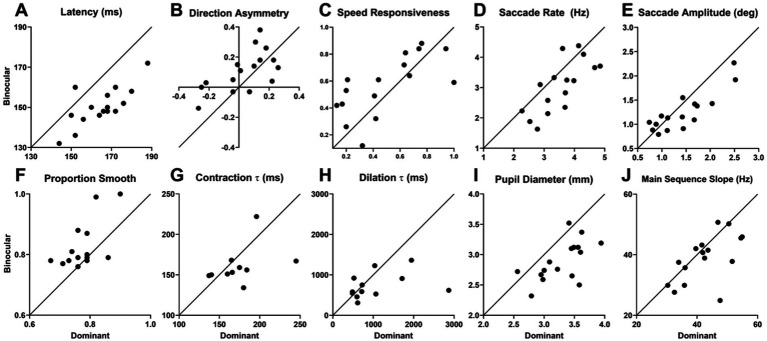
Introduction: We used 18 oculomotor performance metrics (oculometrics) to capture largely independent features of human ocular tracking. Our primary goal was to examine tracking eye movements in a healthy population under monocular and binocular viewing, as well as to examine the potential effects of line-of-sight eye dominance and spatial/directional tuning.
Methods: We compared the ocular responses of 17 healthy well-rested participants using a radial step-ramp paradigm under three viewing conditions: both-eyes viewing, left-eye viewing, and right-eye viewing.
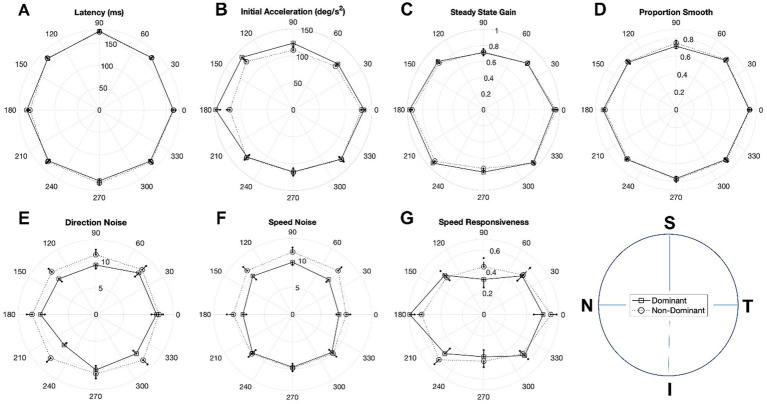
Results: Our findings revealed that binocular viewing enhanced performance over that during monocular viewing for 11 oculometrics, with eye dominance associated with the selective enhancement of 3 oculometrics of visual motion processing. A comparison of binocular and dominant-eye viewing allowed us to segregate the direct enhancements of binocularity per se from those due simply to the inclusion of the dominant eye in binocular viewing and showed that viewing with two eyes is only directly responsible for the enhancement of 9 oculometrics. Our examination of spatial/directional tuning revealed largely isotropic enhancement due to binocularity, as well as several anisotropies in retinal functional processing: (1) a Nasal-Temporal asymmetry for pursuit latency and direction noise, and a Superior-Inferior asymmetry for latency, and (2) anisotropic enhancement in initial acceleration and direction noise (primarily for nasal retina) and speed noise (primarily for superior retina) when viewing through the dominant eye. We also documented Horizontal-Vertical anisotropies in initial acceleration, steady-state gain, proportion smooth, and speed responsiveness for both monocular and binocular viewing.
Conclusion: Our findings demonstrate that there is isotropic enhancement from binocular viewing per se across a wide range of visuomotor features and that important normative characteristics of visual motion processing are shaped by retinal processing non-uniformly across visual space, modulated by eye dominance and perhaps related to previously found normative structural anisotropies in retinal thickness. This constellation of findings characterizes the subtle natural non-linear variations in visuomotor performance to provide insight into the relative roles of the retina and other brain areas in shaping visuomotor performance and to enable the detection of neurological and ophthalmological impairment through comparison with properly matched baselines in support of future research and clinical applications.
Keywords: binocular; monocular; oculometric; saccades; smooth pursuit.
Copyright © 2025 Seyedmadani, Tucker, Anderson, Akay, Akay and Stone.
Conflict of interest statement
MRA was employed by Arctic Slope Regional Corporation. The remaining authors declare that the research was conducted in the absence of any commercial or financial relationships that could be construed as a potential conflict of interest.
Figures


Similar articles
-
See-saw nystagmus and congenital nystagmus identified in the non-decussating retinal-fugal fiber syndrome.Strabismus. 2001 Sep;9(3):143-63. doi: 10.1076/stra.9.3.143.6761. Strabismus. 2001. PMID: 11704879
-
Monocular and binocular reading performance in subjects with normal binocular vision.Clin Exp Optom. 2014 Jul;97(4):341-8. doi: 10.1111/cxo.12137. Epub 2014 Feb 25. Clin Exp Optom. 2014. PMID: 24612111
-
Short-latency disparity vergence responses and their dependence on a prior saccadic eye movement.J Neurophysiol. 1996 Apr;75(4):1392-410. doi: 10.1152/jn.1996.75.4.1392. J Neurophysiol. 1996. PMID: 8727386
-
Does dominance of crossing retinal ganglion cells make the eyes cross? The temporal retina in the origin of infantile esotropia – a neuroanatomical and evolutionary analysis.Acta Ophthalmol. 2014 Sep;92(6):e419-23. doi: 10.1111/aos.12289. Acta Ophthalmol. 2014. PMID: 25259397 Free PMC article. Review.
-
Binocular visual function and fixational control in patients with macular disease: A review.Ophthalmic Physiol Opt. 2022 Mar;42(2):258-271. doi: 10.1111/opo.12925. Epub 2021 Dec 4. Ophthalmic Physiol Opt. 2022. PMID: 34862635 Free PMC article. Review.
References
-
- Ahmed I. A., Senan E. M., Rassem T. H., Ali M. A. H., Shatnawi H. S. A., Alwazer S. M., et al. . (2022). Eye tracking-based diagnosis and early detection of autism Spectrum disorder using machine learning and deep learning techniques. Electronics 11:530. doi: 10.3390/electronics11040530 - DOI
-
- Alcañiz M., Chicchi-Giglioli I. A., Carrasco-Ribelles L. A., Marín-Morales J., Minissi M. E., Teruel-García G., et al. . (2022). Eye gaze as a biomarker in the recognition of autism spectrum disorder using virtual reality and machine learning: a proof of concept for diagnosis. Autism Res. 15, 131–145. doi: 10.1002/aur.2636, PMID: - DOI - PubMed
-
- Bahill A. T., Clark M. R., Stark L. (1975). The main sequence, a tool for studying human eye movements. Math. Biosci. 24, 191–204. doi: 10.1016/0025-5564(75)90075-9 - DOI
LinkOut - more resources
Full Text Sources