. 2025 Jun 15;138(12):jcs263890.
doi: 10.1242/jcs.263890. Epub 2025 Jun 26.

A cryo-electron microscopy structure of yeast Pex5 in complex with a cargo uncovers a novel binding interface

Affiliations

A cryo-electron microscopy structure of yeast Pex5 in complex with a cargo uncovers a novel binding interface

Lior Peer et al. J Cell Sci. .

Abstract

Proper protein targeting to organelles is crucial for maintaining eukaryotic cellular function and homeostasis. This necessity has driven the evolution of specific targeting signals on proteins and the targeting factors that recognize them. A prominent example is peroxisomal matrix proteins, most of which depend on the targeting factor Pex5 to localize and function correctly. Although most Pex5 cargoes contain a peroxisomal targeting signal type 1 (PTS1), they are not all targeted similarly. Some undergo priority targeting, facilitated either by stronger binding to specific subsets of PTS1 signals or by additional interaction interfaces. These observations highlight the extensive complexity of Pex5-mediated targeting. In this study, we reveal that the Saccharomyces cerevisiae (yeast) matrix protein Eci1 can reach peroxisomes and bind Pex5 in the absence of PTS1. By solving the structure of the yeast Pex5-Eci1 complex using cryo-electron microscopy, we identified additional binding interfaces. Our findings provide new insights into the versatile interactions between Pex5 and its cargo, Eci1. More broadly, this work highlights the intricate, dynamic nature of the interactions between cargo factors and their cargoes to meet the complex environment within eukaryotic cells.

Keywords: Saccharomyces cerevisiae; Cryo-EM; Dci1; Eci1; PTS1; Peroxisome; Pex5; Piggybacking; Protein targeting; Protein–protein interaction.


Conflict of interest statement

Competing interests The authors declare no competing or financial interests.

Figures
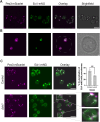
Fig. 1.
Fig. 1.
Eci1 is localized to peroxisomes when its PTS1 is masked by mNeonGreen and when its paralog is absent. (A) Fluorescence microscopy images of Eci1–mNeonGreen (mNG), showing colocalization with peroxisomes (Pex3–mScarlet) when tagged at the C-terminus. Scale bar: 5 μm. (B) High-resolution (SORA) fluorescence microscopy images showing the sub-peroxisomal localization of Eci1–mNG in a Δpex11 background, following growth in oleate as a sole carbon source. Eci1 is in the peroxisomal matrix. Dashed line highlights the cell border. Scale bar: 500 nm. Images in A and B are representative of three technical experimental repeats. (C) Fluorescence microscopy images demonstrating that in the Δdci1 background, the signal of Eci1–mNG is greatly reduced (as shown in Fig. S1B), yet peroxisomal localization of Eci1 is still observed (indicated by white arrows). Scale bars: 5 μm. The graph represents mean±s.d. for one experiment with three technical repeats (n=3) in each strain. **P<0.01 (unpaired two-tailed t-test).
Fig. 2.
Fig. 2.
Eci1 is targeted solely by Pex5. Fluorescence microscopy images of different genetic backgrounds were examined to determine how Eci1 is targeted to peroxisomes and demonstrate a targeting mechanism that is dependent on Pex5 but independent of Pex7 and Pex9. The control and Δpex7 strains show the same extent of colocalization with the peroxisomal marker. In contrast, the rest of the strains show a significant reduction in colocalization compared to the control. Scale bars: 5 μm. The graph represents mean±s.d. for one experiment with three technical repeats (n=3) in each strain. ****P<0.0001 (one-way ANOVA with Dunnett's correction for multiple comparisons).
Fig. 3.
Fig. 3.
Eci1 can bind Pex5 in the absence of its PTS1. (A) Western blot analysis of in vitro His-tag pulldown of Pex5 WT with either Eci1 (WT) or Eci1 lacking its peroxisomal targeting sequence 1 (ΔPTS1). Blots were incubated with either anti-FLAG (upper blot), to detect FLAG–Eci1, or anti-His, to detect His–SUMO–Pex5 (lower blot). When the PTS1 is abolished, Eci1 shows a reduced but still clear ability to bind Pex5 in vitro. S, soluble fraction; E, elution fraction. Blot representative of three experimental repeats. (B) Overlay of two Biacore sensorgrams comparing the respective binding of Eci1 WT (blue) and Eci1ΔPTS1 (red) to immobilized Pex5 (on two separate channels). Binding was assessed in single-cycle kinetics mode without dissociation of the bound proteins using growing concentrations of each of the analytes (1.95 nM, 3.91 nM, 7.81 nM, 15.63 nM, 31.25 nM, 62.5 nM, 125 nM, 250 nM and 500 nM). RU, response units, which are proportional to the mass of analyte bound to the surface-bound protein.
Fig. 4.
Fig. 4.
The cryo-EM structure of Pex5 in complex with an Eci1 hexamer highlights a PTS1 binding interface and a novel EBI. (A) The Eci1 hexamer consists of six subunits depicted in red ribbon. A black circle indicates the additional 13 residues at the C-terminal region (268FRQLGSKQRKHRL280), which include the tripeptide 278HRL280 that defines the PTS1 peroxisomal targeting signal. This C-terminal region is observed in only one Eci1 subunit that interacts with Pex5. (B) The C-terminal domain of Pex5 and the Eci1 hexamer complex are shown as ribbons. The C-terminal domain of Pex5 comprises the TPR domain represented in a gray ribbon and the Eci1 hexamer in a red ribbon. The additional C-terminal region in the Eci1 subunit is indicated by a black circle. A closer view of the interaction between the C-terminal segment of Eci1 and the TPR domain of Pex5 is depicted in the black box, with residues shown as sticks (with nitrogen in blue, carbon in gray for Pex5 and red for Eci1, and oxygen in red for Pex5 and orange for Eci1). (C) An additional 21 residues at the C-terminal domain of Pex5 (276LVNDDLNLGEDYLKYLGGRVN296) representing the EBI that had not been observed previously are highlighted by a black circle. A closer view of the novel EBI involving residues from the C-terminal segment of Eci1 interacting with residues from the TPR3 domain of Pex5 is shown as sticks (color scheme as in B). (D) Electrostatic complementarity relies on multiple salt-bridge interactions between specific amino acid residues from the PTS1 and the EBI interfaces. Residues are labeled and shown as sticks (colorings as in B).
Fig. 5.
Fig. 5.
The Pex5–Eci1 complex structure interfaces exhibit shape and charge compatibility. (A) Surface representation of the TPR domain of Pex5 (gray) interacting with one subunit of the Eci1 hexamer (red). Two binding interfaces were identified: one involving the C-terminal PTS1 of Eci1 interacting with the TPR domain of Pex5, labeled as PTS1, and the newly identified EBI labeled as EBI. Both interfaces exhibit shape complementarity. (B) Electrostatic representation of the electropositive surface of the Eci1 subunit (bottom), which is complementary to the electronegative surface of the TPR domain of Pex5 (top). Electronegative surfaces are depicted in red, electropositive in blue, and neutral in white. The view in B is 180° rotation compared to A.
Fig. 6.
Fig. 6.
The newly defined Pex5–Eci1 EBI differs from the binding interface of PEX5 with AGXT and Pex5 with MDH. (A) The yeast Pex5–Eci1 complex is shown with gray and red ribbons, respectively. (B) The human PEX5–AGXT complex is shown with grey and green ribbons, respectively (PDB entry 3R9A). (C) The Pex5-MDH is shown with grey and orange ribbons, respectively (PDB entry 8GGH). (D) Alignment of the yeast Pex5–Eci1 complex with the PEX5–AGXT and Pex5–MDH structures reveals two binding interfaces. The PTS1, common to all three complexes, is highlighted by a black circle, while the second binding interface for Eci1, AGXT and MDH occupies different regions in the Pex5/PEX5 structures and involves distinct residues. A closer view of the PTS1 binding interface for Eci1, AGXT and MDH is provided in the black box. The resemblance of the PTS1 binding interface among these proteins is emphasized by the black circle.

References

    1. Adams, P. D., Afonine, P. V., Bunkóczi, G., Chen, V. B., Davis, I. W., Echols, N., Headd, J. J., Hung, L.-W., Kapral, G. J., Grosse-Kunstleve, R. W.et al. (2010). PHENIX: a comprehensive Python-based system for macromolecular structure solution. Acta Crystallogr. D Biol. Crystallogr. 66, 213-221. 10.1107/S0907444909052925 - DOI - PMC - PubMed
    1. Al-Hajaya, Y., Karpinska, B., Foyer, C. H. and Baker, A. (2022). Nuclear and peroxisomal targeting of catalase. Plant Cell Environ. 45, 1096-1108. 10.1111/pce.14262 - DOI - PMC - PubMed
    1. Argyriou, C., D'Agostino, M. D. and Braverman, N. (2016). Peroxisome biogenesis disorders. Transl. Sci. Rare Dis. 1, 111-144. 10.3233/trd-160003 - DOI - PMC - PubMed
    1. Ashkenazy, H., Abadi, S., Martz, E., Chay, O., Mayrose, I., Pupko, T. and Ben-Tal, N. (2016). ConSurf 2016: an improved methodology to estimate and visualize evolutionary conservation in macromolecules. Nucleic Acids Res. 44, W344-W350. 10.1093/NAR/GKW408 - DOI - PMC - PubMed
    1. Aviram, N. and Schuldiner, M. (2017). Targeting and translocation of proteins to the endoplasmic reticulum at a glance. J. Cell Sci. 130, 4079-4085. 10.1242/jcs.204396 - DOI - PubMed

MeSH terms

Substances

LinkOut - more resources