. 2025 May;31(5):e70439.
doi: 10.1111/cns.70439.

Auricular Transcutaneous Vagus Nerve Stimulation Enhances Post-Stroke Neurological and Cognitive Recovery in Mice by Suppressing Ferroptosis Through α7 Nicotinic Acetylcholine Receptor Activation

Affiliations

Auricular Transcutaneous Vagus Nerve Stimulation Enhances Post-Stroke Neurological and Cognitive Recovery in Mice by Suppressing Ferroptosis Through α7 Nicotinic Acetylcholine Receptor Activation

Hongyan Gong et al. CNS Neurosci Ther. 2025 May.

Abstract

Aims: Ferroptosis plays a critical role in stroke pathophysiology, yet its dynamics during recovery remain unclear. This study aimed to investigate the evolution of ferroptosis throughout post-stroke recovery and evaluate auricular transcutaneous vagus nerve stimulation (atVNS) as a therapeutic intervention, focusing on the involvement of α7 nicotinic acetylcholine receptor (α7nAChR)-mediated mechanisms.

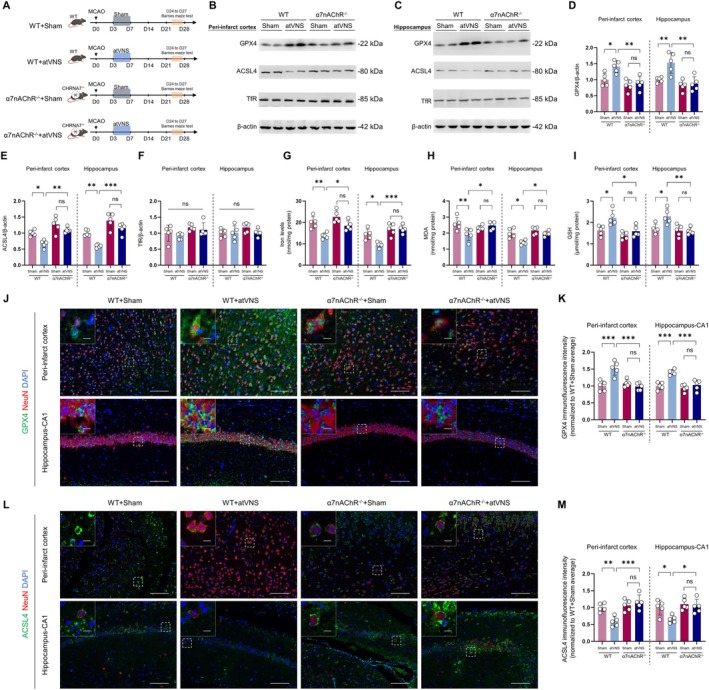
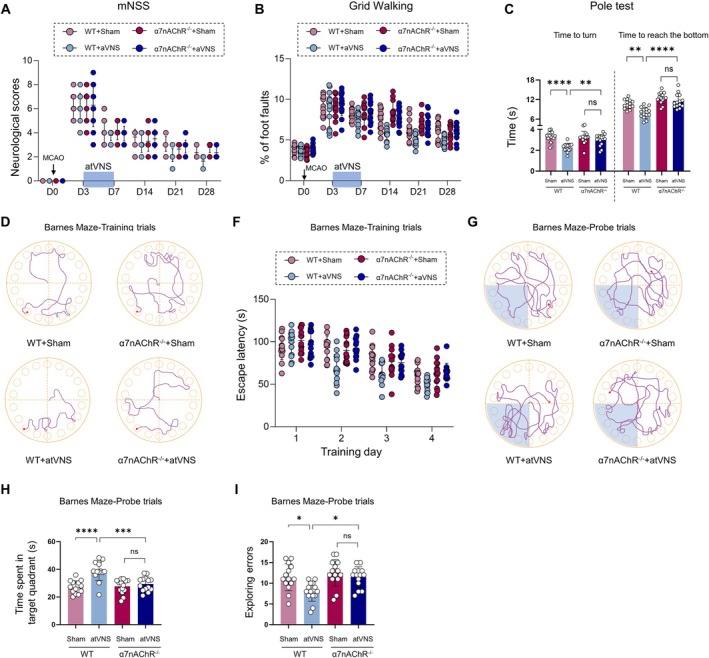
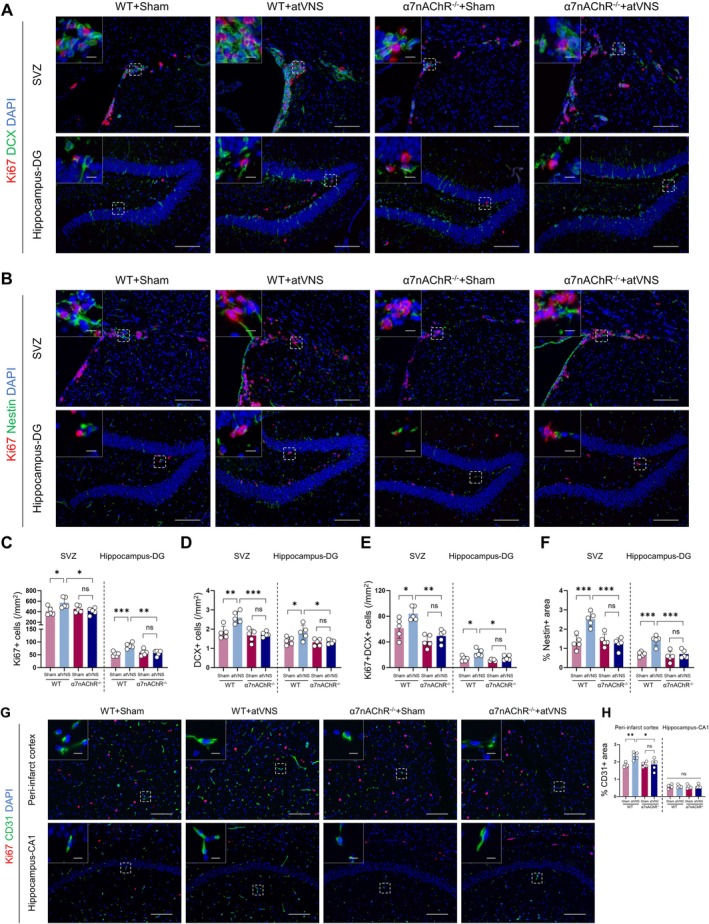
Methods: Using a middle cerebral artery occlusion (MCAO) mouse model, we examined ferroptosis-related protein expression (GPX4, ACSL4, TfR) and iron levels across acute to chronic recovery phases. The therapeutic effects of atVNS were evaluated through the assessment of ferroptosis markers, neurogenesis, angiogenesis, cognitive function, and neuroinflammation. α7nAChR knockout mice were used to investigate the receptor's role in atVNS-mediated recovery.

Results: We observed sustained alterations in ferroptosis markers and iron levels throughout post-stroke recovery. atVNS treatment reduced ferroptosis progression by modulating GPX4 and ACSL4 expression, enhanced neurogenesis and angiogenesis, improved cognitive recovery, and reduced neuroinflammation. These beneficial effects were absent in α7nAChR knockout mice, while atVNS increased neuronal α7nAChR expression in wild-type mice.

Conclusions: This study reveals the persistent involvement of ferroptosis in stroke recovery and demonstrates that atVNS provides comprehensive neuroprotection through α7nAChR-dependent mechanisms. These findings establish atVNS as a promising noninvasive therapeutic approach for stroke recovery and highlight α7nAChR signaling as a potential therapeutic target.

Keywords: auricular transcutaneous vagus nerve stimulation; ferroptosis; neurogenesis; neuroinflammation; α7 nicotinic acetylcholine receptor.


Conflict of interest statement

The authors declare no conflicts of interest.

Figures

FIGURE 1
FIGURE 1
Temporal and spatial dynamics of ferroptosis‐related proteins and iron levels after cerebral ischemia. (A) Experimental timeline for the MCAO (middle cerebral artery occlusion) model and subsequent analyses. (B) Representative TTC (2,3,5‐triphenyltetrazolium chloride) staining of brain sections from sham and MCAO groups at D3 post‐surgery. (C–J) Western blot analysis of GPX4, ACSL4, and TfR expression in the peri‐infarct cortex (C–F) and hippocampus (G–J) at different time points after MCAO. β‐Actin serves as a loading control. Quantification of protein levels normalized to β‐Actin is shown. (K) Transmission electron microscopy images of the peri‐infarct cortex at D0 and D28 post‐MCAO, showing ultrastructural changes indicative of ferroptosis. Scale bars: 2 μm. Red arrows in the D28 panel highlight key features of ferroptosis, including mitochondrial swelling and deformation, increased membrane density, and disruption of organelle structures. The D0 panel shows normal cellular ultrastructure for comparison. (L–O) Immunofluorescence staining and quantification of GPX4 (green) (L,N) and ACSL4 (green) (M,O) in the peri‐infarct cortex and hippocampus‐CA1 region at D0, D7, and D28 post‐MCAO. NeuN (red) marks neurons, DAPI (blue) labels nuclei. Scale bars: 100 μm For main images, 10 μm for insets. Quantification of fluorescence intensity is shown. (P) Quantification of iron levels in the peri‐infarct cortex and hippocampus at D0, D7, and D28 post‐MCAO. (Q, R) Quantification of MDA (malondialdehyde) and GSH (glutathione) levels in the peri‐infarct cortex and hippocampus at D0, D7, and D28 post‐MCAO. Data are presented as mean ± SD. Statistical significance is indicated: *P < 0.05, **p < 0.01, ***p < 0.001, ****p < 0.0001, ns (not significant). Statistical analysis was performed using one‐way ANOVA followed by Tukey's post hoc test (n = 4 per group).
FIGURE 2
FIGURE 2
Impacts of auricular vagus nerve stimulation (atVNS) on the modulation of ferroptosis‐related proteins and iron ion concentrations during the chronic recovery phase following stroke. (A) Timeline of the experimental protocol detailing the MCAO model development and subsequent atVNS treatment from D0 to D28, with Barnes maze test conducted between D24 to D27. (B) Schematic diagram accompanied by a photograph demonstrating the atVNS application. (C) Representative TTC staining of brain sections obtained from Stroke+Sham and Stroke+atVNS groups at D28. (D) Analysis showcasing the quantification of the infarct size at D28 (n = 5 for each group, ‘ns’ denotes not significant). (E–H) Western blot investigations alongside their respective quantifications for GPX4, ACSL4, and TfR within the peri‐infarct cortex region at D28 (n = 5 for each group, *p < 0.05, ***p < 0.001, ‘ns’ indicating not significant). (I–L) Western blot examinations combined with quantification for GPX4, ACSL4, and TfR in the hippocampus at D28 (n = 5 for each group, **p < 0.01, ‘ns’ represents not significant). (M) Evaluation of iron ion levels within both the peri‐infarct cortex and hippocampal regions at D28 (n = 5 per group, *p < 0.05). (N, O) Quantification of MDA and GSH levels in the peri‐infarct cortex and hippocampus at D28 (n = 5 per group, *p < 0.05, **p < 0.01, ***p < 0.001). (P) Transmission electron microscopy of peri‐infarct cortex at D28. Stroke+Sham: Red arrow indicates mitochondrion with ferroptotic features. Stroke+atVNS: Blue arrow indicates mildly swollen mitochondrion with intact cristae. Scale bars: 1 μm. (Q, R) Immunofluorescent staining of GPX4 (green) (Q) and ACSL4 (green) (R) within the peri‐infarct cortex and hippocampal CA1 area at D28. NeuN (red) is utilized to identify neurons, while DAPI (blue) has been employed to label nuclei. The scale bars equal 100 μm for primary images, and 10 μm for the insets. (S, T) Quantification of immunofluorescence intensity for GPX4 (S) and ACSL4 (T) in peri‐infarct cortex and hippocampal CA1 regions (n = 5 per group, *p < 0.05, **p < 0.01). Data are exhibited as mean ± SD. Statistical examinations were conducted using either the unpaired t test or Mann–Whitney U test, as deemed appropriate.
FIGURE 3
FIGURE 3
Effects of auricular vagus nerve stimulation (atVNS) on neurological and cognitive functions after stroke. (A) Modified Neurological Severity Scores (mNSS) from D0 to D28 post‐MCAO for Stroke+Sham and Stroke+atVNS groups (n = 14 per group, *p < 0.05). (B) Grid Walking test results showing the percentage of foot faults from D0 to D28 (n = 14 per group, *p < 0.05, ***p < 0.001). (C, D) Pole test results on D28, showing the time to turn (C) and the time to reach the bottom (D) (n = 14 per group, ***p < 0.001). (E) Representative traces of mouse movement in the Barnes Maze during training trials for Stroke+Sham and Stroke+atVNS groups. (F) Escape latency in Barnes Maze training trials over 4 days (n = 14 per group, *p < 0.05, **p < 0.01). (G) Representative traces of mouse movement in the Barnes Maze during probe trials. (H–I) Barnes Maze probe trial results showing the time spent in the target quadrant (H) and the number of exploring errors (I) (n = 14 per group, **p < 0.01). Data are presented as mean ± SD. Statistical analysis was performed using two‐way ANOVA with Bonferroni's post hoc test for A, B, and F, and unpaired t test for C, D, H, and I.
FIGURE 4
FIGURE 4
Effects of auricular vagus nerve stimulation (atVNS) on neurogenesis and angiogenesis during the recovery period after stroke. (A) Representative immunofluorescence images of Ki67 (red) and DCX (green) staining in the subventricular zone (SVZ) and hippocampus dentate gyrus (DG) for Stroke+Sham and Stroke+atVNS groups. DAPI (blue) labels nuclei. Scale bars: 100 μm for main images, 10 μm for insets. (B) Representative immunofluorescence images of Ki67 (red) and Nestin (green) staining in the SVZ and DG. Scale bars: 100 μm for main images, 10 μm for insets. (C) Quantification of Ki67+ cells in the SVZ and DG (n = 5 per group, *p < 0.05, **p < 0.01). (D) Quantification of DCX+ area percentage in the SVZ and DG (n = 5 per group, *p < 0.05, **p < 0.01). (E) Quantification of Ki67 + DCX+ cells in the SVZ and DG (n = 5 per group, *p < 0.05). (F) Quantification of Nestin+ area percentage in the SVZ and DG (n = 5 per group, **p < 0.01, ***p < 0.001). (G) Representative immunofluorescence images of Ki67 (red) and CD31 (green) staining in the peri‐infarct cortex and hippocampus CA1 region. Scale bars: 100 μm for main images, 10 μm for insets. (H) Quantification of CD31+ area percentage in the peri‐infarct cortex and hippocampus CA1 region (n = 5 per group, *p < 0.05, ns: Not significant). Data are presented as mean ± SD. Statistical analysis was performed using unpaired t test.
FIGURE 5
FIGURE 5
Impact of auricular vagus nerve stimulation (atVNS) on post‐stroke neuroinflammation. (A) Illustrative immunofluorescence images depicting Iba‐1 (green) staining in the peri‐infarct cortex and hippocampal CA1 regions, with DAPI (blue) marking nuclei. Scale bars represent 100 μm for primary images and 10 μm for insets. (B) Representative images showcasing GFAP (green) staining within the same regions. The scale bars are identical to (A). (C) Quantitative representation of Iba‐1 positive cells within the peri‐infarct cortex and hippocampal CA1 areas (n = 5 per group, *p < 0.05, **p < 0.01). (D) Analysis of GFAP‐positive area percentages in the aforementioned regions (n = 5 per group, *p < 0.05, **p < 0.01). (E, F) Characteristic Western blot images of TNF‐α, p‐ERK, and p‐p38 MAPK in the peri‐infarct cortex (E) and hippocampus (F). (G‐I) Data quantification from Western blot analyses for TNF‐α (G), p‐ERK (H), and p‐p38 MAPK (I), each normalized to β‐Actin (n = 5 per group, *p < 0.05, **p < 0.01, ***p < 0.001). (J) Exemplary immunofluorescence images displaying p‐ERK (green) in the peri‐infarct cortex and hippocampal CA1 areas. The scale bars are consistent with (A). (K) Illustrative images of co‐staining for p‐p38 MAPK (green) and Iba‐1 (red) within the same regions. Again, the scale bars remain unchanged. (L) Fluorescence intensity quantification for p‐ERK within the peri‐infarct cortex and hippocampal CA1 sectors (n = 5 per group, *p < 0.05). (M) Quantification of p‐p38 MAPK and Iba‐1 co‐labeled cells within these areas (n = 5 per group, *p < 0.05, **p < 0.01). All data are expressed as mean ± SD. An unpaired t test was utilized for statistical analyses.
FIGURE 6
FIGURE 6
Expression of α7 nicotinic acetylcholine receptor (α7nAChR) after stroke and effects of auricular vagus nerve stimulation (atVNS). (A) Representative Western blots of α7nAChR in the peri‐infarct cortex and hippocampus at D0, D7, and D28 post‐stroke. (B) Quantification of α7nAChR/β‐Actin ratio from Western blots (n = 5 per group, *p < 0.05, **p < 0.01, ****p < 0.0001). (C) Representative immunofluorescence images showing co‐localization of α7nAChR (green) with NeuN (red, top) and Iba‐1 (red, bottom). Scale bars: 100 μm For main images, 10 μm for insets. (D) Representative immunofluorescence images of α7nAChR (green) in the peri‐infarct cortex, hippocampus‐CA1, and hippocampus‐DG regions at D0 and D28. DAPI (blue) labels nuclei. Scale bars: 100 μm For main images, 10 μm for insets. (E) Representative Western blots of α7nAChR in the peri‐infarct cortex and hippocampus for Stroke+Sham and Stroke+atVNS groups at D28. (F) Quantification of α7nAChR/β‐Actin ratio from Western blots in (E) (n = 5 per group, *p < 0.05, ns: Not significant). Data are presented as mean ± SD. Statistical analysis was performed using one‐way ANOVA with Tukey's post hoc test for (B) and unpaired t test for (F).
FIGURE 7
FIGURE 7
α7nAChR knockout diminishes the anti‐ferroptotic effects of atVNS during the Recovery Period After Stroke. (A) Experimental design for wild‐type (WT) and α7nAChR knockout (α7nAChR−/−) mice with MCAO and atVNS treatment. (B, C) Representative Western blots of GPX4, ACSL4, and TfR in the peri‐infarct cortex (B) and hippocampus (C) for all groups at D28. (D–I) Quantification of Western blot results for GPX4 (D), ACSL4 (E), TfR (F), and iron levels (G) in the peri‐infarct cortex and hippocampus, plus MDA (H) and GSH (I) levels (n = 5 per group, *p < 0.05, **p < 0.01, ***p < 0.001, ns: Not significant). (J) Representative immunofluorescence images of GPX4 (green) and NeuN (red) in the peri‐infarct cortex and hippocampus‐CA1. DAPI (blue) labels nuclei. Scale bars: 100 μm for main images, 10 μm for insets. (K) Quantification of GPX4 immunofluorescence intensity (n = 5 per group, ***p < 0.001, ns: Not significant). (L) Representative immunofluorescence images of ACSL4 (green) and NeuN (red) in the peri‐infarct cortex and hippocampus‐CA1. Scale bars: 100 μm for main images, 10 μm for insets. (M) Quantification of ACSL4 immunofluorescence intensity (n = 5 per group, *p < 0.05, **p < 0.01, ***p < 0.001, ns: Not significant). Data are presented as mean ± SD. Statistical analysis was performed using one‐way ANOVA with Tukey's post hoc test.
FIGURE 8
FIGURE 8
Effects of α7nAChR knockout on atVNS‐induced recovery of cognitive and neurological functions post‐stroke. (A) Variation in Modified Neurological Severity Score (mNSS) across time for all groups (n = 14 each). (B) Grid walking test results indicating percentage of foot faults over time (n = 14 per group). (C) Results of pole test showing time taken to turn and reach the bottom (n = 14 per group, **p < 0.01, ****p < 0.0001, ns: Not significant). (D) Illustrative trajectories of mice during Barnes Maze training trials. (F) Latency to escape during Barnes Maze training trials across 4 days (n = 14 per group). (G) Representational tracks of mice during Barnes Maze probe trials. (H) Duration in target quadrant during Barnes Maze probe trials (n = 14 per group, ***p < 0.001, ****p < 0.0001, ns: Not significant). (I) Count of exploratory errors during Barnes Maze probe trials (n = 14 per group, *p < 0.05, ns: Not significant). Data is shown as mean ± SD. Statistical analysis was utilized using two‐way ANOVA with Tukey's post hoc test for A, B, F and one‐way ANOVA with Tukey's post hoc test for C, H, I.
FIGURE 9
FIGURE 9
Elimination of α7nAChR curbs the enhancement of neurogenesis and angiogenesis instigated by atVNS. (A) Representative immunofluorescence images of Ki67 (red), DCX (green), and DAPI (blue) in the subventricular zone (SVZ) and hippocampus dentate gyrus (DG) regions. Scale bars: 100 μm for main images, 10 μm for insets. (B) Representative immunofluorescence images of Ki67 (red), Nestin (green), and DAPI (blue) in the SVZ and hippocampus DG regions. Scale bars: 100 μm for main images, 10 μm for insets. (C) Quantification of Ki67+ cells in the SVZ and hippocampus DG (n = 5 per group, *p < 0.05, **p < 0.01, ***p < 0.001, ns: Not significant). (D) Quantification of DCX+ cells in the SVZ and hippocampus DG (n = 5 per group, *p < 0.05, **p < 0.01, ***p < 0.001, ns: Not significant). (E) Quantification of Ki67+/DCX+ double‐positive cells in the SVZ and hippocampus DG (n = 5 per group, *p < 0.05, **p < 0.01, ns: Not significant). (F) Quantification of Nestin+ area in the SVZ and hippocampus DG (n = 5 per group, ***p < 0.001, ns: Not significant). (G) Representative immunofluorescence images of Ki67 (red), CD31 (green), and DAPI (blue) in the peri‐infarct cortex and hippocampus CA1 regions. Scale bars: 100 μm for main images, 10 μm for insets. (H) Quantification of CD31+ area in the peri‐infarct cortex and hippocampus CA1 regions (n = 5 per group, *p < 0.05, **p < 0.01, ns: Not significant). Data are presented as mean ± SD. Statistical analysis was performed using one‐way ANOVA with Tukey's post hoc test.
FIGURE 10
FIGURE 10
α7nAChR Knockout diminishes atVNS‐induced neuroinflammatory protection after stroke. (A) Representative immunofluorescence images of Iba1 (green) and DAPI (blue) in the peri‐infarct cortex and hippocampus CA1 regions. Scale bars: 100 μm For main images, 10 μm for insets. (B) Representative immunofluorescence images of GFAP (green) and DAPI (blue) in the peri‐infarct cortex and hippocampus CA1 regions. Scale bars: 100 μm For main images, 10 μm for insets. (C) Quantification of Iba1+ cells in the peri‐infarct cortex and hippocampus CA1 (n = 5 per group, *p < 0.05, **p < 0.01, ***p < 0.001, ns: Not significant). (D) Quantification of GFAP+ area in the peri‐infarct cortex and hippocampus CA1 (n = 5 per group, *p < 0.05, **p < 0.01, ***p < 0.001, ****p < 0.0001, ns: Not significant). (E, F) Representative Western blot images of TNF‐α, p‐ERK, p‐p38 MAPK, and β‐Actin in the peri‐infarct cortex (E) and hippocampus (F). (G–I) Quantification of Western blot results for TNF‐α (G), p‐ERK (H), and p‐p38 MAPK (I) in the peri‐infarct cortex and hippocampus (n = 5 per group, *p < 0.05, **p < 0.01, ***p < 0.001, ****p < 0.0001, ns: Not significant). Data are presented as mean ± SD. Statistical analysis was performed using one‐way ANOVA with Tukey's post hoc test.
FIGURE 11
FIGURE 11
Proposed mechanisms mediating the therapeutic effects of atVNS during the stroke recovery. Activation of the α7nAChR by atVNS is hypothesized to trigger several beneficial pathways: (1) inhibition of ferroptosis, evidenced by increased GPX4 expression and decreased ACSL4 levels and lipid peroxidation; (2) suppression of neuroinflammation, mediated via reduced glial (microglia and astrocyte) activation and downregulation of pro‐inflammatory signaling; and (3) stimulation of neurogenesis and angiogenesis. Crucially, ferroptosis and neuroinflammation are tightly interlinked; ferroptotic cell death can release damage‐associated molecular patterns (DAMPs) and oxidized lipids that propagate inflammatory responses, while inflammatory mediators released by activated glia can, in turn, sensitize neurons to ferroptosis by increasing oxidative stress or altering iron metabolism. Therefore, the simultaneous targeting of both processes by atVNS via α7nAChR may disrupt this detrimental feedback loop. These combined therapeutic effects ultimately contribute to improved neurological and cognitive recovery.

Similar articles

References

    1. Candelario‐Jalil E., Dijkhuizen R. M., and Magnus T., “Neuroinflammation, Stroke, Blood‐Brain Barrier Dysfunction, and Imaging Modalities,” Stroke 53, no. 5 (2022): 1473–1486. - PMC - PubMed
    1. Jelinek M., Jurajda M., and Duris K., “Oxidative Stress in the Brain: Basic Concepts and Treatment Strategies in Stroke,” Antioxidants 10, no. 12 (2021): 1886. - PMC - PubMed
    1. Liu S., Feng X., Jin R., and Li G., “Tissue Plasminogen Activator‐Based Nanothrombolysis for Ischemic Stroke,” Expert Opinion on Drug Delivery 15, no. 2 (2018): 173–184. - PMC - PubMed
    1. Vázquez‐Oliver A., Brambilla‐Pisoni C., Domingo‐Gainza M., Maldonado R., Ivorra A., and Ozaita A., “Auricular Transcutaneous Vagus Nerve Stimulation Improves Memory Persistence in Naïve Mice and in an Intellectual Disability Mouse Model,” Brain Stimulation 13, no. 2 (2020): 494–498. - PubMed
    1. Wang Y., Wu S., Li Q., Sun H., and Wang H., “Pharmacological Inhibition of Ferroptosis as a Therapeutic Target for Neurodegenerative Diseases and Strokes,” Advanced Science 10, no. 24 (2023): e2300325. - PMC - PubMed

MeSH terms

Substances