. 2025 Jul;32(1):197.
doi: 10.3892/mmr.2025.13562. Epub 2025 May 16.

Glucose, glutamine, lactic acid and α‑ketoglutarate restore metabolic disturbances and atrophic changes in energy‑deprived muscle cells

Affiliations

Glucose, glutamine, lactic acid and α‑ketoglutarate restore metabolic disturbances and atrophic changes in energy‑deprived muscle cells

Miu Ikeda et al. Mol Med Rep. 2025 Jul.

Abstract

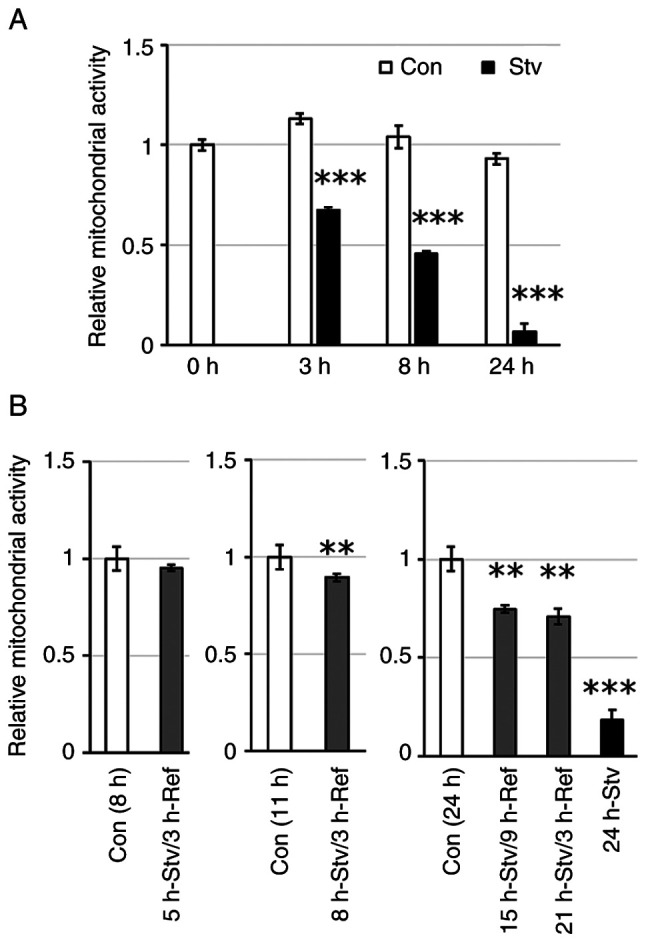
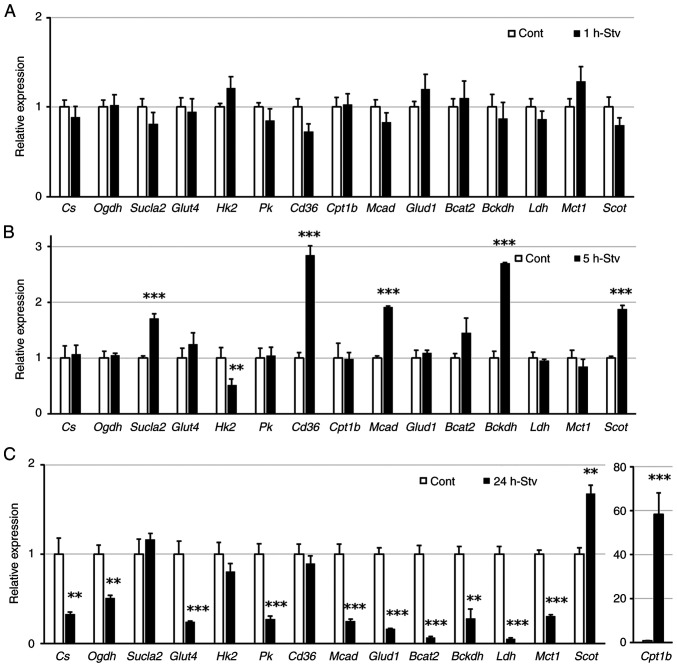
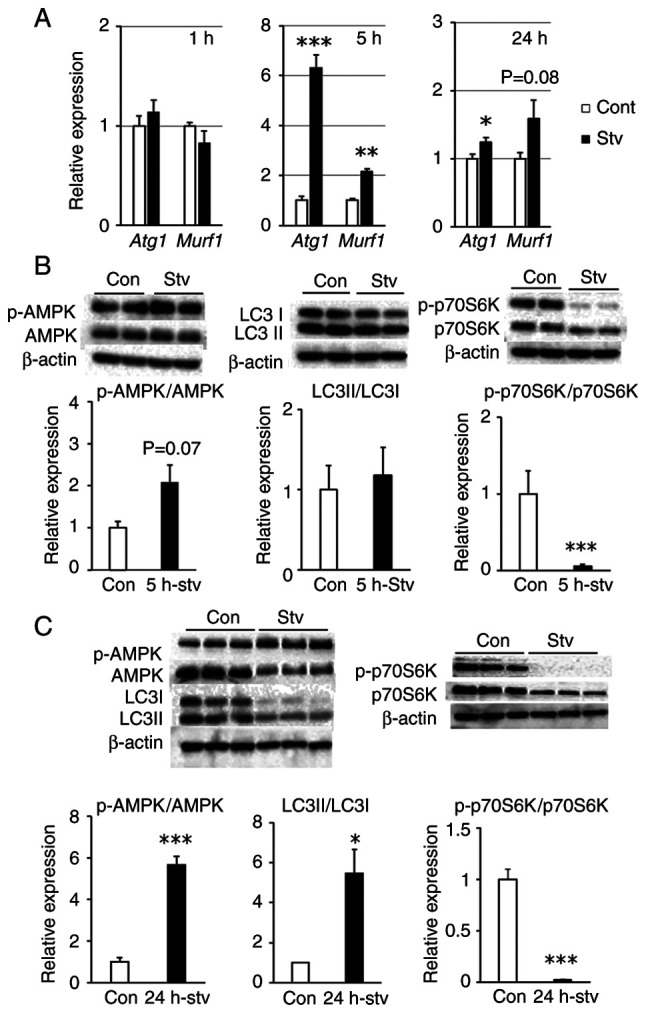
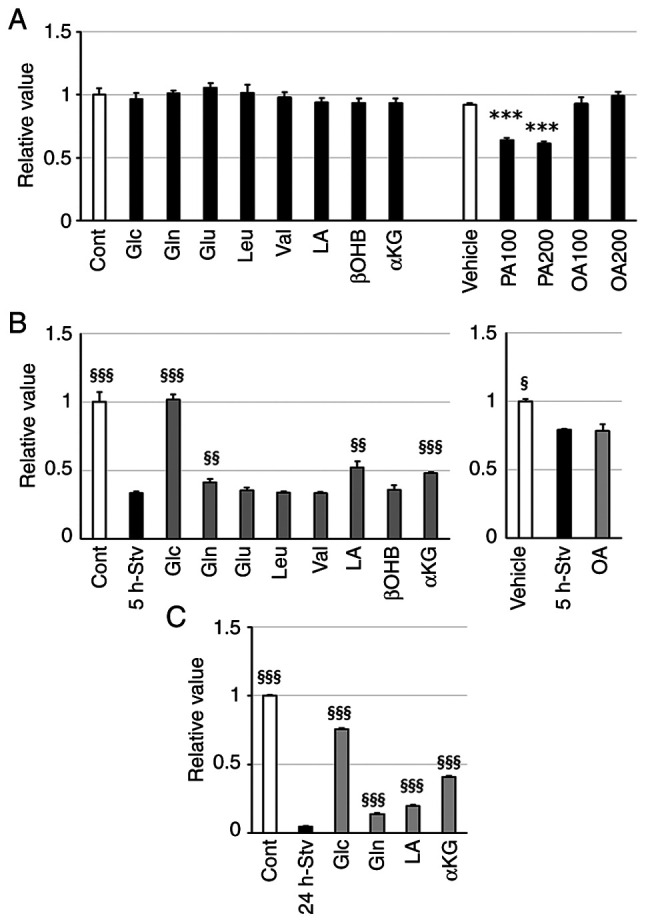
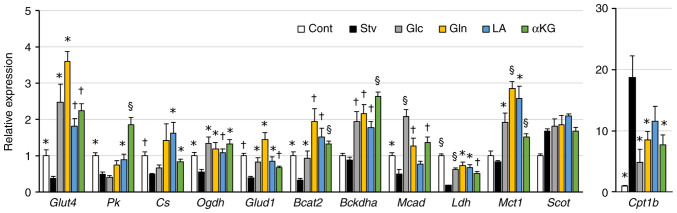
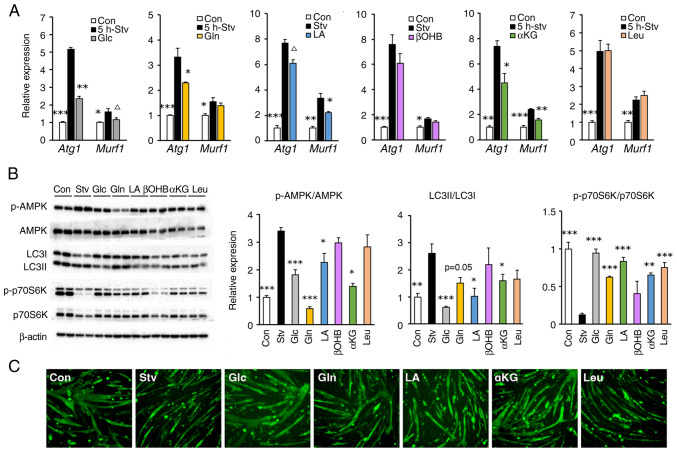
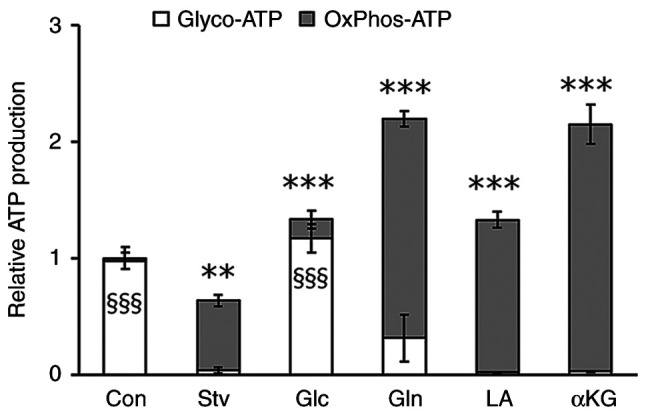
Skeletal muscle atrophy is often triggered by catabolic conditions such as fasting, malnutrition and chronic diseases; however, the efficacy of nutritional supplementation in maintaining muscle mass and preventing muscle atrophy remains controversial. The present study aimed to compare the inhibitory effects of various nutritional substrates on starvation‑induced catabolic changes and muscle cell atrophy. C2C12 muscle cells were starved for up to 24 h in medium lacking serum and main nutrients (glucose, glutamine and pyruvate). To assess the effects of exogenous substrates, the cells were incubated in starvation medium and individually supplemented with each of the following nutrients: Glucose, amino acids, fatty acids, lactate or ketone bodies. The expression of each gene and protein was analyzed by reverse transcription‑quantitative PCR and western blotting, respectively. Mitochondrial activity was determined by MTT assay and cell morphology was observed by immunofluorescence staining. The results revealed that starvation for >3 h suppressed mitochondrial activity, and after 5 h of starvation, the expression levels of several metabolic genes were increased; however, the levels of most, with the exception of Scot and Cpt‑1b, were suppressed after 24 h. Protein degradation and a decrease in protein synthesis were observed after 5 h of starvation, followed by autophagy with morphological atrophy at 24 h. Supplementation with specific substrates, with the exception of leucine, such as glucose, glutamine, lactic acid or α‑ketoglutarate, attenuated the suppression of mitochondrial activity, and altered gene expression, protein degradation and myotube atrophy in starved myotubes. Furthermore, the decrease in intracellular ATP production after 24 h of starvation was reversed by restoring glycolysis in glucose‑treated cells, and via an increase in mitochondrial respiration in cells treated with glutamine, lactic acid or α‑ketoglutarate. In conclusion, increasing the availability of glucose, glutamine, lactic acid or α‑ketoglutarate may be beneficial for countering muscle atrophy associated with inadequate nutrient intake.

Keywords: atrophy; metabolism; muscle cells; nutrient substrates; starvation.


Conflict of interest statement

The authors declare that they have no competing interests.

Figures

Figure 1.
Figure 1.
Effect of starvation duration on metabolic activity. (A) Cells were incubated in starvation medium for 3, 8, or 24 h. (B) Cells were incubated in starvation medium for 5, 8, 15, 21, or 24 h, followed by the replacement of the medium with regular DMEM and incubated for an additional 3 or 9 h. Control cells were incubated in regular DMEM for the same duration. Metabolic activity was assessed by MTT assay, and the values are expressed as fold-change compared with the values for control cells. Values represent the mean ± SEM (n=4-6). **P<0.01, ***P<0.001 vs. control cells at the same time point. Con, control; Stv, starvation; Ref, refeeding.
Figure 2.
Figure 2.
Effect of starvation on metabolic gene expression. Cells were incubated in regular DMEM or starvation medium for (A) 1, (B) 5, or (C) 24 h. The expression levels of representative genes related to metabolic fuel utilization were quantified. Values are expressed as fold-change compared with the values of control cells incubated in regular DMEM. The gene names for each abbreviation are presented in Table SI. Values represent the mean ± SEM (n=4). **P<0.01; ***P<0.001 vs. control cells at the same time point. Cont, control; Stv, starvation.
Figure 3.
Figure 3.
Effect of starvation on protein synthesis and degradation. Cells were incubated in starvation medium for 1, 5, or 24 h. (A) The relative mRNA expression of Atg1 and Murf1 was quantified by reverse transcription-quantitative PCR. (B and C) Protein phosphorylation levels of AMPK and p70S6K, and the protein expression ratio of LC3II/LC3I after (B) 5, or (C) 24 h of starvation were analyzed by western blotting. Representative blot images are shown in the upper part. Values are expressed as fold-change compared with the values of control cells incubated in regular DMEM. Values are presented as the mean ± SEM (n=3). *P<0.05, **P<0.01, ***P<0.001 vs. control. Atg1, atrogin-1; Con, control; Murf1, muscle ring finger 1; p-, phosphorylated; Stv, starvation.
Figure 4.
Figure 4.
Effect of single nutrient supplementation on metabolic activity. (A) Cells were incubated in regular DMEM supplemented with the indicated nutrient for 24 h. (B and C) C2C12 myotubes were cultured in starvation medium only or with the indicated nutrient for (B) 5 or (C) 24 h. Albumin and NaOH were added as vehicle controls in both regular and starvation media in the experiment for the fatty acid (PA and OA). Metabolic activity was assessed using the MTT assay. Values are expressed as fold-change compared with the values of the control cells incubated in regular DMEM. Values are presented as the mean ± SEM (n=3-4). ***P<0.001 vs. vehicle control; §P<0.05, §§P<0.01, §§§P<0.001 vs. starved cells in the same group. Cont, control; Vehicle, vehicle control; Stv, starvation; Glc, glucose; Gln, glutamine; Glu, glutamic acid; Leu, leucine; Val, valine; LA, lactate; βOHB, β-hydroxy butyric acid; αKG, α-ketoglutarate; PA, palmitic acid; OA, oleic acid.
Figure 5.
Figure 5.
Effect of single nutrient supplementation on metabolic gene expression. Cells were incubated in starvation medium with (colored bars) or without (black bars) the indicated nutrients for 24 h. The expression levels of representative genes related to metabolic fuel utilization were quantified. Values are expressed as fold-change compared with the values of the control cells incubated in regular DMEM (empty bars). Values are presented as the mean ± SEM (n=3-4). *P<0.05, P<0.01, §P<0.001 vs. starved cells. Cont, control; Stv, starvation; Glc, glucose; Gln, glutamine; LA, lactate; αKG, α-ketoglutarate.
Figure 6.
Figure 6.
Effect of single nutrient supplementation on protein metabolism and morphological atrophy. Cells were incubated in starvation medium with (colored bars) or without (black bars) the indicated nutrients for (A) 5 or (B and C) 24 h. (A) Relative mRNA expression of Atg1 and Murf1 was quantified by reverse transcription-quantitative PCR. (B) Protein phosphorylation levels of AMPK and p70S6K, and the protein expression ratio of LC3II/LC3I were analyzed by western blotting. Representative blot images are shown on the left side. (C) Representative fluorescence images of MHC antibody-stained myotubes at ×200 magnification were captured using a fluorescence microscope (BZ-X700; Keyence). Values are expressed as fold-change compared with the values of the control cells incubated in regular DMEM. Values are presented as mean ± SEM (n=3-4). ΔP<0.1, *P<0.05, **P<0.01, ***P<0.001 vs. starved cells. Atg1, atrogin-1; Con, control; Murf1, muscle ring finger 1; p-, phosphorylated; Stv, starvation; Glc, glucose; Gln, glutamine; LA, lactate; βOHB, β-hydroxy butyric acid; αKG, α-ketoglutarate; Leu, leucine.
Figure 7.
Figure 7.
Effect of single nutrient supplementation on ATP production. C2C12 myotubes were incubated in starvation medium with or without the indicated nutrients for 24 h. The ATP production rates from glycolysis (Glyco-ATP) and OxPhos (OxPhos-ATP) were determined. Values are expressed as fold-change compared with the values of the control cells incubated in regular DMEM. Values are presented as mean ± SEM (n=3-4). **P<0.01, ***P<0.001 vs. control cells for total ATP production; §§§P<0.001 vs. starved cells for Glyco-ATP production. Con, control; Glyco-ATP, glycolytic ATP; OxPhos, oxidative phosphorylation; Stv, starvation.

Similar articles

References

    1. Frontera WR, Ochala J. Skeletal muscle: A brief review of structure and function. Calcif Tissue Int. 2015;96:183–195. doi: 10.1007/s00223-014-9915-y. - DOI - PubMed
    1. Sieber CC. Malnutrition and sarcopenia. Aging Clin Exp Res. 2019;31:793–798. doi: 10.1007/s40520-019-01170-1. - DOI - PubMed
    1. Yuan S, Larsson SC. Epidemiology of sarcopenia: Prevalence, risk factors, and consequences. Metabolism. 2023;144:155533. doi: 10.1016/j.metabol.2023.155533. - DOI - PubMed
    1. Owens DJ. Nutritional support to counteract muscle atrophy. Adv Exp Med Biol. 2018;1088:483–495. doi: 10.1007/978-981-13-1435-3_22. - DOI - PubMed
    1. Wang Y, Liu Q, Quan H, Kang SG, Huang K, Tong T. Nutraceuticals in the prevention and treatment of the muscle atrophy. Nutrients. 2021;13:1914. doi: 10.3390/nu13061914. - DOI - PMC - PubMed