. 2025 Jul;56(1):107.
doi: 10.3892/ijmm.2025.5548. Epub 2025 May 16.

Gossypin induces apoptosis and autophagy via the MAPK/JNK pathway in HT‑29 human colorectal cancer cells

Affiliations

Gossypin induces apoptosis and autophagy via the MAPK/JNK pathway in HT‑29 human colorectal cancer cells

Jun-Mo Moon et al. Int J Mol Med. 2025 Jul.

Abstract

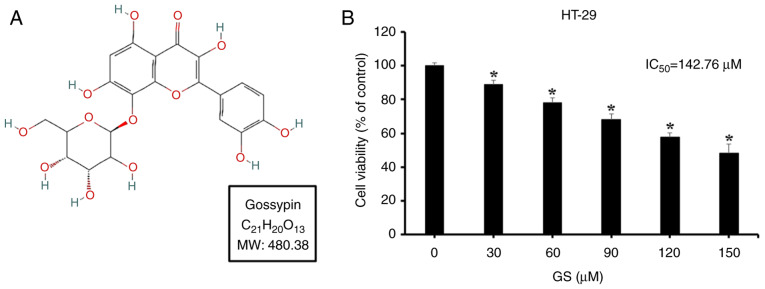
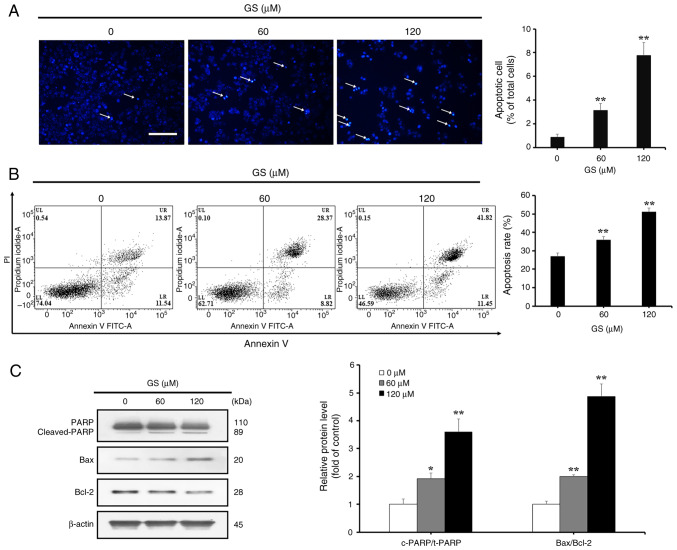
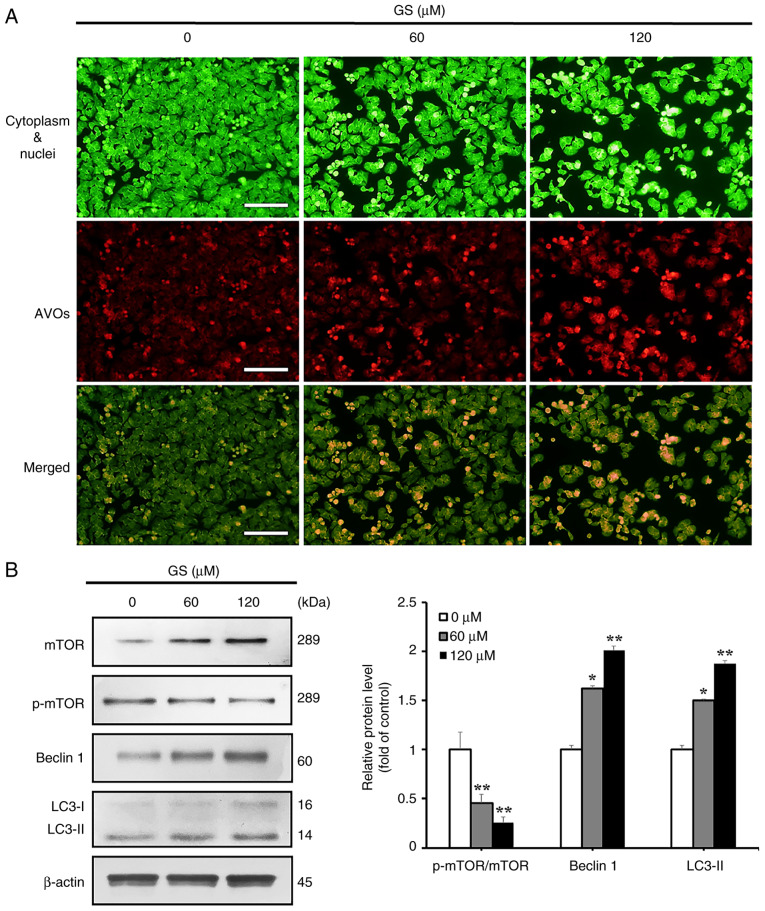
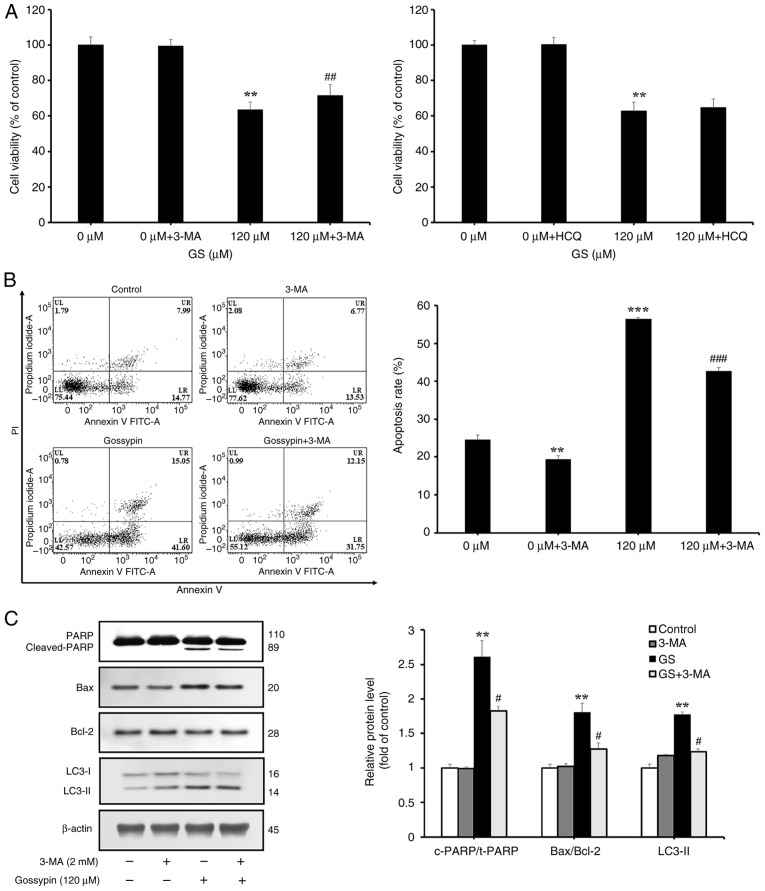
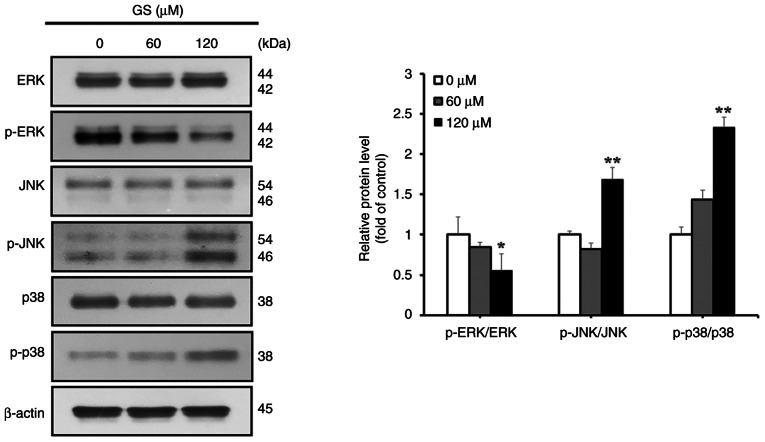
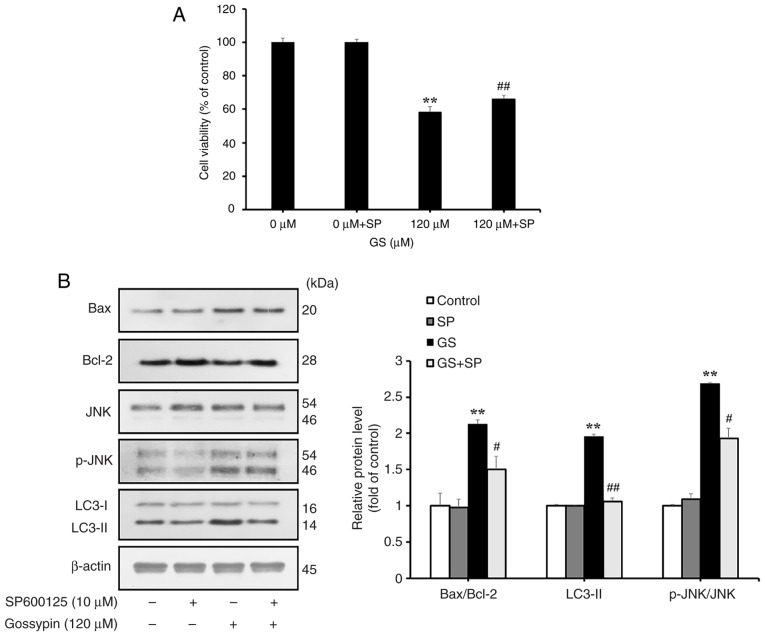
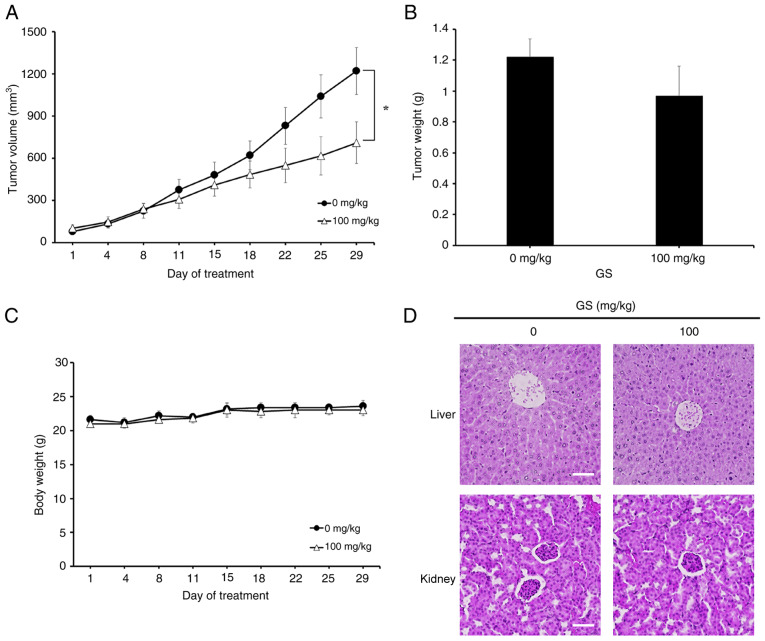
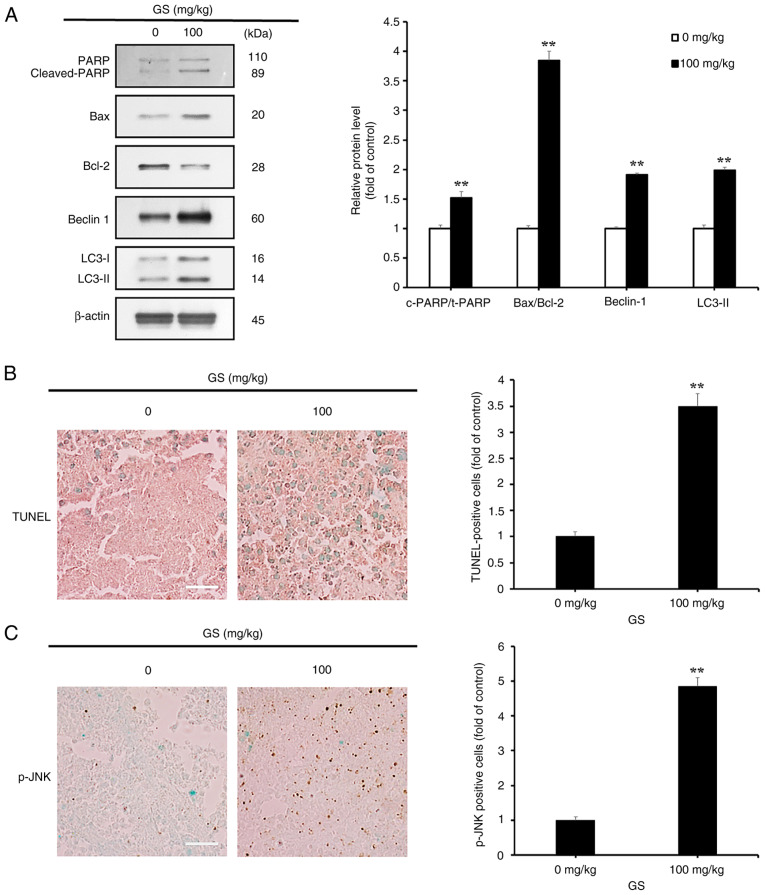
Gossypin, a flavone found in Hibiscus vitifolius, exhibits antioxidant, antidiabetic, anti‑inflammatory and anticancer effects. The present study investigated the potential of gossypin to induce apoptosis and autophagy in HT‑29 human colorectal cancer (CRC) cells, and assessed its association with the MAPK/JNK pathway. Cell viability assays, DAPI staining, flow cytometry, acridine orange staining, western blotting, hematoxylin and eosin staining, terminal deoxynucleotidyl transferase dUTP nick end labeling (TUNEL) staining and immunohistochemistry were performed. The results revealed an increased number of apoptotic bodies, higher apoptosis rates and enhanced autophagy in gossypin‑treated HT‑29 cells. To investigate autophagy during cell death, the effects of the early autophagy inhibitor 3‑methyladenine (3‑MA) and the late autophagy inhibitor hydroxychloroquine on cell viability and the expression of apoptosis‑related proteins were assessed. Significant increases in cell viability were observed following 3‑methyladenine pretreatment, as well as a decrease in the expression levels of Bcl‑2 and an increase in Bax. The analysis of MAPK pathway proteins following treatment with gossypin revealed that the levels of phosphorylated (p‑)JNK and p‑p38 were significantly increased in a concentration‑dependent manner. The JNK inhibitor SP600125 was used to confirm the role of the JNK pathway in gossypin‑induced apoptosis and autophagy. Moreover, gossypin reduced the volume of HT‑29 tumors in mice, and western blotting indicated the induction of apoptosis and autophagy in these tumors in vivo. Finally, TUNEL and immunohistochemistry experiments confirmed the induction of apoptosis and p‑JNK upregulation in these tumors in vivo. In conclusion, the present study suggested that gossypin may induce MAPK/JNK‑mediated apoptosis and autophagy in HT‑29 CRC cells, highlighting the potential of gossypin as an anticancer agent.

Keywords: HT‑29; MAPK/JNK pathway; apoptosis; autophagy; colorectal cancer; gossypin.


Conflict of interest statement

The authors declare that they have no competing interests.

Figures

Figure 1
Figure 1
Effects of GS on the viability of HT-29 human colorectal cancer cells. (A) Chemical structure of GS (PubChem identifier: 45933927; https://pubchem.ncbi.nlm.nih.gov/compound/45933927). (B) HT-29 were treated with various concentrations of GS for 24 h. The inhibition of cell viability was measured using the MTT assay. Data are presented as the mean and standard deviation of three experimental repeats. *P<0.05 vs. control group. GS, gossypin; IC50, half maximal inhibitory concentration.
Figure 2
Figure 2
Effects of GS on the apoptosis of HT-29 colorectal cancer cells. (A) HT-29 cells were treated with GS (0, 60 and 120 µM) for 24 h, and the cells were then stained with DAPI. Positive cells were analyzed using a fluorescence microscope and the arrows indicate chromatin condensation (scale bar, 100 µm). The average number of DAPI-positive cells is presented as a percentage of total cells. (B) HT-29 cells were treated with GS (0, 60 and 120 µM) for 24 h, stained with Annexin V/PI and analyzed by flow cytometry. The percentage of apoptotic cells among total cells is shown. (C) HT-29 cells were treated with GS (0, 60 and 120 µM) for 24 h, and the expression levels of apoptosis-related proteins, PARP, Bax and Bcl-2, were measured by western blotting. β-actin was used as a loading control, and semi-quantification was performed using ImageJ. Control (0 µM) cells were subjected to treatment with an equal amount of dimethyl sulfoxide. The results are representative of three independent experiments and data are presented as the mean ± standard deviation. *P<0.05, **P<0.01 vs. control group. GS, gossypin; PI, propidium iodide.
Figure 3
Figure 3
Effect of GS on the induction of autophagy in HT-29 colorectal cancer cells. HT-29 cells were treated with GS (0, 60 and 120 µM) for 24 h. (A) AVOs were visualized via fluorescence microscopy using acridine orange staining. The cytoplasm and the nuclei-were stained fluorescent green, and the AVOs were stained fluorescent red (scale bar, 100 µm). (B) Expression levels of autophagy-related proteins, mTOR, p-mTOR, Beclin 1 and LC3, were measured by western blotting. β-actin was used as a loading control and semi-quantification was performed using ImageJ. The results are representative of three independent experiments and data are presented as the mean ± standard deviation. *P<0.05, **P<0.01 vs. control group. AVOs, acidic vesicular organelles; GS, gossypin; p-, phosphorylated.
Figure 4
Figure 4
Effect of GS on autophagy in HT-29 colorectal cancer cells. (A) HT-29 cells were pretreated with 3-MA (2 mM) or HCQ (20 µM) for 2 h and then treated with GS (120 µM) for 24 h. Cell viability was measured using the MTT assay. (B) HT-29 cells were pretreated with 3-MA (2 mM) for 2 h and then treated with GS (120 µM) for 24 h. The cells were then stained with Annexin V/PI and were analyzed by flow cytometry. The bar graph represents the percentage of apoptotic cells among total cells. (C) Protein expression levels of Bax, Bcl-2 and LC3 were measured by western blotting. β-actin was used as a loading control and semi-quantification was performed using ImageJ. The results are representative of three independent experiments and data are presented as the mean ± standard deviation. **P<0.01, ***P<0.001 vs. control group; #P<0.05, ##P<0.01, ###P<0.001 vs. GS group. 3-MA, 3-methyladenine; GS, gossypin; HCQ, hydroxychloroquine; PI, propidium iodide.
Figure 5
Figure 5
Effects of GS on the expression levels of MAPK pathway proteins. Expression levels of MAPK pathway-related proteins, ERK, p-ERK, JNK, p-JNK, p38 and p-p38 were measured by western blotting. β-actin was used as a loading control and semi-quantification was performed using ImageJ. The results are representative of three independent experiments and data are presented as the mean ± standard deviation. *P<0.05, **P<0.01 vs. control group. GS, gossypin; p-, phosphorylated.
Figure 6
Figure 6
GS induces regulation of apoptosis and autophagy via JNK in HT-29 colorectal cancer cells. (A) HT-29 cells were pretreated with SP (10 µM) for 2 h and then treated with GS (120 µM) for 24 h. Cell viability was measured using the MTT assay. (B) Protein expression levels of Bax, Bcl-2, JNK, p-JNK and LC3 were measured by western blotting. β-actin was used as a loading control and semi-quantification was performed using ImageJ. The results are representative of three independent experiments and data are presented as the mean ± standard deviation. **P<0.01 vs. control group; #P<0.05, ##P<0.01 vs. GS treatment group. GS, gossypin; p-, phosphorylated; SP, SP600125.
Figure 7
Figure 7
Effects of GS on HT-29 tumors in vivo. Nude mice bearing HT-29 cells as a xenograft model were treated with GS (0 and 100 mg/kg) for 28 days. (A) Tumor volume, (B) tumor weight and (C) body weight were measured. (D) Histological toxicity analysis of the liver and kidney in nude mice was performed using hematoxylin and eosin staining (scale bar, 50 µm). *P<0.05 vs. control group. GS, gossypin.
Figure 8
Figure 8
Effects of GS on JNK-mediated apoptosis and autophagy in tumors. (A) Tumor protein expression levels of PARP, Bax, Bcl-2, Beclin 1 and LC3 were measured by western blotting. β-actin was used as a loading control and semi-quantification was performed using ImageJ. The results are representative of three independent experiments and data are presented as the mean ± standard deviation. (B) Apoptosis was measured in tumor tissues using a TUNEL assay. (C) p-JNK expression was measured in tumor tissues by immunohistochemistry. TUNEL-positive and p-JNK-positive cells were observed under a light microscope (scale bar, 25 µm) and are shown as the average of three fields. **P<0.01 vs. control group. GS, gossypin; p-, phosphorylated; TUNEL, terminal deoxynucleotidyl transferase dUTP nick end labeling.

Similar articles

References

    1. Zaorsky NG, Churilla TM, Egleston BL, Fisher SG, Ridge JA, Horwitz EM, Meyer JE. Causes of death among cancer patients. Ann Oncol. 2017;28:400–407. doi: 10.1093/annonc/mdw604. - DOI - PMC - PubMed
    1. WHO Colorectal cancer. 2023. https://www.who.int/newsroom/fact-sheets/detail/colorectal-cancer .
    1. Ahmed M. Colon cancer: A clinician's Perspective in 2019. Gastroenterology Res. 2020;13:1–10. doi: 10.14740/gr1239. - DOI - PMC - PubMed
    1. Siegel RL, Miller KD, Jemal A. Cancer statistics, 2018. CA Cancer J Clin. 2018;68:7–30. doi: 10.3322/caac.21442. - DOI - PubMed
    1. Vogel JD, Felder SI, Bhama AR, Hawkins AT, Langenfeld SJ, Shaffer VO, Thorsen AJ, Weiser MR, Chang GJ, Lightner AL, et al. The American society of colon and rectal surgeons clinical practice guidelines for the management of colon cancer. Dis Colon Rectum. 2022;65:148–177. doi: 10.1097/DCR.0000000000002323. - DOI - PubMed