. 2025 Aug;24(8):e70091.
doi: 10.1111/acel.70091. Epub 2025 May 16.

Nuclear Import Defects Drive Cell Cycle Dysregulation in Neurodegeneration

Affiliations

Nuclear Import Defects Drive Cell Cycle Dysregulation in Neurodegeneration

Jonathan Plessis-Belair et al. Aging Cell. 2025 Aug.

Abstract

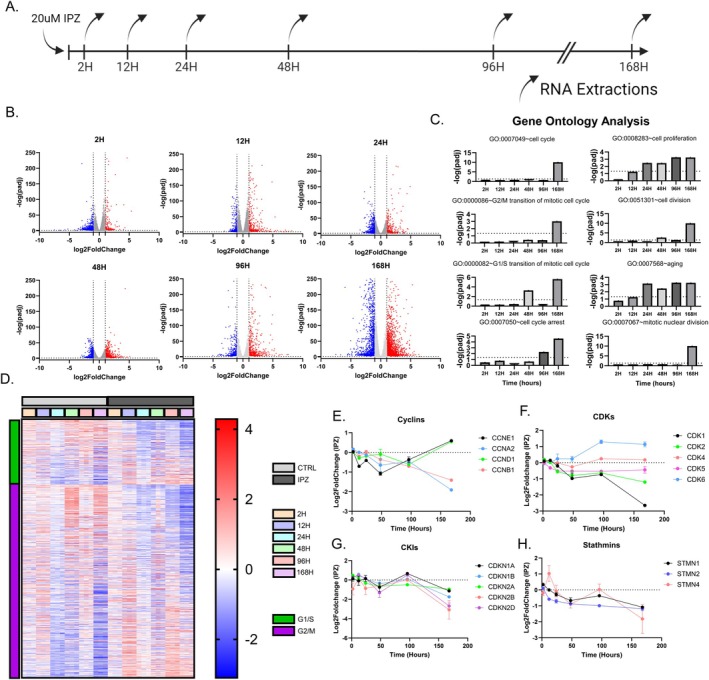
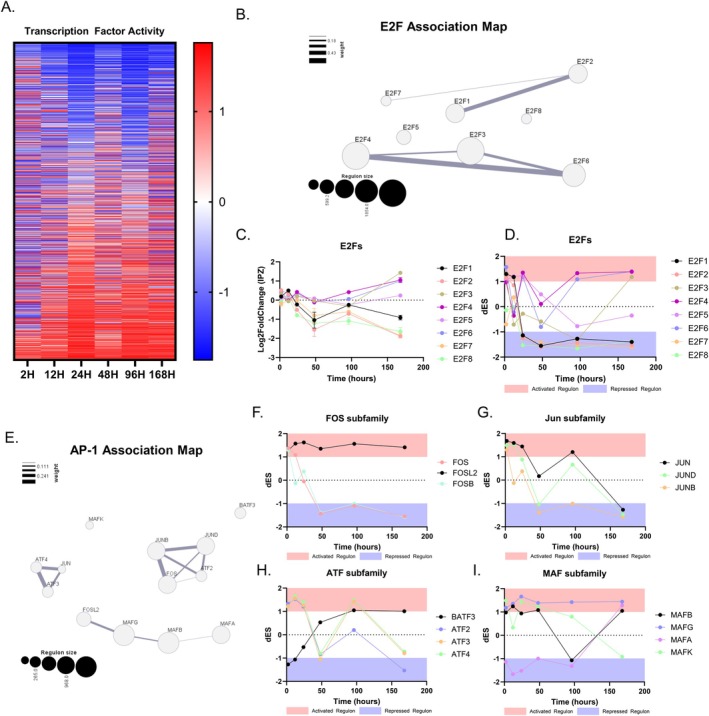
Neurodegenerative diseases (NDDs) and other age-related disorders have been classically defined by a set of key pathological hallmarks. Two of these hallmarks, cell cycle dysregulation (CCD) and nucleocytoplasmic transport (NCT) defects, have long been debated as being either causal or consequential in the pathology of accelerated aging. Specifically, aberrant cell cycle activation in post-mitotic neurons has been shown to trigger neuronal cell death pathways and cellular senescence. Additionally, NCT has been observed to be progressively dysregulated during aging and in neurodegeneration, where the increased subcellular redistribution of nuclear proteins, such as TAR DNA-Binding Protein-43 (TDP-43), to the cytoplasm is a primary driver of disease. However, the functional significance of NCT defects as either a causal mechanism or consequence of pathology, and how the redistribution of cell cycle machinery contributes to neurodegeneration, remains unclear. Here, we describe that pharmacological inhibition of importin-β nuclear import is capable of perturbing cell cycle machinery both in mitotic neuronal cell lines and post-mitotic primary neurons in vitro. Our NemfR86S mouse model of motor neuron disease, characterized by nuclear import defects, further recapitulates the hallmarks of CCD we observed in mitotic cell lines and in post-mitotic primary neurons in vitro, and in spinal motor neurons in vivo. The observed CCD is consistent with the transcriptional and phenotypical dysregulation commonly associated with neuronal cell death and senescence-like features in NDDs. Together, this evidence suggests that impairment of nuclear import pathways resulting in CCD may be a common driver of pathology in neurodegeneration.

Keywords: cell cycle; neurodegeneration; nuclear import.


Conflict of interest statement

We permit the right to Wiley and Aging Cell to license and reproduce the above information. We required no permissions for any data or figures produced in this manuscript.

The authors declare no conflicts of interest.

Figures

FIGURE 1
FIGURE 1
IPZ‐treated mitotic neuronal cell lines demonstrate cell cycle dysregulation consistent with the downregulation of stathmins. (A) Timeline of the experimental set up. Cells were treated for 7 days in parallel with RNA extractions occurring at 2, 12, 24, 48, 96, and 168 h. (B) Volcano plot of significant DEGs for each time point. Red data points indicated upregulated DEGs (log2FC > 1, p‐adj < 0.05) and blue data points indicate downregulated DEGs (log2FC < −1, p‐adj < 0.05). Gray data points indicate DEGs that do not meet the threshold (−1 < log2FC < 1|p‐adj > 0.05). (C) Gene Ontology Analysis of significant DEGs shown in (B) for each given timepoint (p‐adj < 0.05). (D) Z‐score heatmap of genes associated with G1/S and G2/M clusters. (E–H) Log2FoldChange Expression of Cyclins (E), CDKs (F), CKIs (G), Stathmins (H), over the 7‐day time course.
FIGURE 2
FIGURE 2
IPZ‐treated cell lines show time‐dependent cell‐cycle regulator activity dysregulation. (A) Differential Enrichment Score (dES) heatmap of IPZ‐treated SK‐N‐MC cells. The activity of 1192 transcription factors are inferred based on a reconstructed transcriptional network (RTN) from SK‐N‐MC gene expression profiles. (B) E2F Association Map inferred from the RTN displaying each regulon (E2Fs 1–8) and its size (represented by area), as well as overlapping associations in transcriptional activity with other regulons (measured by weighted line). (C) Log2FoldChange Expression of E2Fs 1–8 over the 7‐day time course. (D) dES transcriptional activity of E2Fs 1–8 over the 7‐day time course. (E) AP‐1 complex Association Map inferred from the RTN displaying each regulon family (FOS, JUN, ATF, and MAF). Size is represented by area as well as overlapping associations in transcriptional activity with other regulons (measured by weighted line). (F–I) dES transcriptional activity of FOS (F), JUN (G), ATF (H), and MAF (I) subfamilies over the 7‐day time course. Activated regulon activity in red shaded area (dES > 1) and repressed regulon activity in blue shaded area (dES < −1). Scatter plot bars are mean with standard deviation (C).
FIGURE 3
FIGURE 3
Cell‐cycle dysregulation is associated with senescence‐like features independent of CKI expression. (A) Z‐score heatmap of genes associated with senescence and SASP. (B, C) Log2FoldChange Expression of SASP (B) and Nuclear Envelope (C) DEGs over the time course of 7‐days. (D) Immunostaining of lamin B1 (blue) with Mitotracker CMXRos (red) and Lysotracker stains (white) in CTRL and IPZ‐treated SK‐N‐MC cells. (E) Nuclear area (μm2) of CTRL and IPZ‐treated SK‐N‐MC cells (n = 304–379 cells). (F) lamin B1 fluorescence intensity from (D) (n = 128–134). (G, H) Quantification of average mitochondria and lysosomes per cell isolated from Mitotracker CMXRos and Lysotracker stains from (D) (n = 8 trials). (I) Immunostaining of γH2AX (Ser 139, green) and DAPI (blue) in CTRL and IPZ‐treated SK‐N‐MC cells. (J) Quantification of average γH2AX foci per nucleus isolated from (I). (K) Average γH2AX fluorescence intensity per foci from (I) (n = 6). (L) DNA intensity from DAPI staining from isolated from CTRL and IPZ‐treated SK‐N‐MC cells from (I) (n = 303–421). All data was analyzed by unpaired two‐tailed t‐test. (**p < 0.01, ***p < 0.001, ****p < 0.0001). (M) Frequency distribution histogram of DNA intensity from (L) for CTRL and IPZ‐treated SK‐N‐MC cells. Scale bars are 10 μm.
FIGURE 4
FIGURE 4
Nemf R86S MEFs demonstrate a G1/S cell‐cycle arrest and Stmn2 downregulation. (A–C) Log2FoldChange Expression from Nemf R86S MEFs for E2Fs (A), Cyclins (B), and CKIs (C). (D) Volcano plot analysis of long non‐coding RNA DEGs. Red data points indicated upregulated DEGs (log2FC > 0.5, p‐adj < 0.05) and blue data points indicate downregulated DEGs (log2FC < −0.5, p‐adj < 0.05). Gray data points indicate DEGs that do not meet the threshold (−0.5 < log2FC < 0.5|p‐adj > 0.05). (E) Western blot analysis of E2F1 and p16INK4A with respective β‐Actin loading control. (F, G) Quantification of protein expression from western blot analysis in (E). Data analyzed by unpaired two‐tailed t‐test (n = 3). (H) FACS of DNA content from DAPI staining of WT and Nemf R86S MEFs with and without Nocodazole treatment. (I) Quantification of the percentage of cells from (H) separated into G1, S, G2, and apoptosis peaks based on DNA content. Data from (H) analyzed by two‐way ANOVA with Šídák's multiple comparisons test (n = 3). (J) Colorimetric Caspase‐3 activity assay measuring AC‐DEVD‐pNA cleavage for WT and Nemf R86S MEFs with and without Nocodazole treatment normalized to WT (n = 4). (K) FACS of DNA content from DAPI staining of Control (WT) and R86S MEFs, as well as WT MEFs treated with Importazole, Deferoxamine, L‐Mimosine, and Nocodazole. (L) Quantitative PCR analysis of Stmn2 RNA isolated from Control (WT) and R86S MEFs, as well as WT MEFs treated with Importazole, Deferoxamine, L‐Mimosine, and Nocodazole (n = 3). Data from (J, L) analyzed by ordinary one‐way ANOVA with Tukey's multiple comparison test. (ns p > 0.05, *p < 0.05, **p < 0.01, ***p < 0.001, ****p < 0.0001).
FIGURE 5
FIGURE 5
Mutant Nemf R86S and IPZ‐treated primary neuronal cultures demonstrate time‐dependent transcriptional dysregulation consistent with cell‐cycle dysregulation. (A) Timeline of the experimental set up. Primary cortical neurons were isolated at P0 from the same litter and cultured for 2 weeks. At the 2‐week time point, CTRL cells (WT mice) were treated with IPZ (20 μM) for either 2 or 7 days. CTRL and Nemf R86S (R86S) primary cultures were maintained in parallel with IPZ‐treated cells, with RNA extractions at 2 and 7 days. (B–I) Quantitative PCR of CTRL, R86S, and IPZ‐treated primary cortical neurons of Stmn2 (B), E2f1 (C), Cdkn1a (D), Cdkn2a (E), Meg3 (F), Lmnb1 (G), Cxcl8 (H), Il6 (I) at 2 and 7 days. Data from (B–I) analyzed by two‐way ANOVA with Šídák's multiple comparisons test. (n = 3) (*p < 0.05, **p < 0.01, ***p < 0.001).
FIGURE 6
FIGURE 6
Differential expression and localization of CKIs in Nemf R86S and IPZ‐treated post‐mitotic neurons (A) Immunostaining of p16 (A, red), MAP2 (green), and DAPI (blue) in CTRL, Nemf R86S (R86S), and IPZ‐treated primary cortical neuronal cultures. (B, C) Nuclear (B) and cytoplasmic (C) p16 intensity from (A) isolated from neuronal (MAP2+, green open circle) and non‐neuronal (MAP2‐, black closed circle) cells (n = 166–185 cells). (D) Immunostaining of p21 (red), MAP2 (green), and DAPI (blue) in CTRL, Nemf R86S (R86S), and IPZ‐treated primary cortical neuronal cultures. (E) Nuclear p21 intensity from (D) isolated from neuronal (MAP2+, green open circle) and non‐neuronal (MAP2−, black closed circle) cells (n = 104–118 cells). (F) DNA intensity from DAPI staining isolated from neuronal (MAP2+, green open circle) and non‐neuronal (MAP2−, black closed circle) cells (n = 225–244 cells). Data from (C–F) analyzed by ordinary one‐way ANOVA with Tukey's multiple comparison test. (ns p > 0.05, *p < 0.05, **p < 0.01, ***p < 0.001, ****p < 0.0001). (G, H) Frequency distribution histograms from (F) separated into MAP2− cells and MAP2+ cells. (I) Immunostaining of p27 (red), MAP2 (green), and DAPI (blue) in CTRL, Nemf R86S (R86S), and IPZ‐treated primary cortical neuronal cultures. (J, K) Nuclear (J) and cytoplasmic (K) p27 intensity from (I) isolated from neuronal (MAP2+, green open circle) and non‐neuronal (MAP2−, black closed circle) cells (n = 120–266 cells). (L) Immunostaining of p27 (red), MAP2 (green), and DAPI (blue) in the ventral horn of WT and Nemf R86S spinal cord sections. (M, N) Nuclear (M) and cytoplasmic (N) p27 intensity from (L) isolated from neuronal (MAP2+, green open circle) and non‐neuronal (MAP2−, black closed circle) cells (n = 111–120 MAP2+ cells, 506–536 MAP2− cells). Scale bars are 20 μm.

Update of

Similar articles

  • Nuclear Import Defects Drive Cell Cycle Dysregulation in Neurodegeneration.
    Plessis-Belair J, Russo T, Riessland M, Sher RB. Plessis-Belair J, et al. bioRxiv [Preprint]. 2025 Jan 31:2025.01.28.635269. doi: 10.1101/2025.01.28.635269. bioRxiv. 2025. Update in: Aging Cell. 2025 Aug;24(8):e70091. doi: 10.1111/acel.70091. PMID: 39975276 Free PMC article. Updated. Preprint.
  • Prescription of Controlled Substances: Benefits and Risks.
    Preuss CV, Kalava A, King KC. Preuss CV, et al. 2025 Jul 6. In: StatPearls [Internet]. Treasure Island (FL): StatPearls Publishing; 2025 Jan–. 2025 Jul 6. In: StatPearls [Internet]. Treasure Island (FL): StatPearls Publishing; 2025 Jan–. PMID: 30726003 Free Books & Documents.
  • The Black Book of Psychotropic Dosing and Monitoring.
    DeBattista C, Schatzberg AF. DeBattista C, et al. Psychopharmacol Bull. 2024 Jul 8;54(3):8-59. Psychopharmacol Bull. 2024. PMID: 38993656 Free PMC article. Review.
  • Short-Term Memory Impairment.
    Cascella M, Al Khalili Y. Cascella M, et al. 2024 Jun 8. In: StatPearls [Internet]. Treasure Island (FL): StatPearls Publishing; 2025 Jan–. 2024 Jun 8. In: StatPearls [Internet]. Treasure Island (FL): StatPearls Publishing; 2025 Jan–. PMID: 31424720 Free Books & Documents.
  • Management of urinary stones by experts in stone disease (ESD 2025).
    Papatsoris A, Geavlete B, Radavoi GD, Alameedee M, Almusafer M, Ather MH, Budia A, Cumpanas AA, Kiremi MC, Dellis A, Elhowairis M, Galán-Llopis JA, Geavlete P, Guimerà Garcia J, Isern B, Jinga V, Lopez JM, Mainez JA, Mitsogiannis I, Mora Christian J, Moussa M, Multescu R, Oguz Acar Y, Petkova K, Piñero A, Popov E, Ramos Cebrian M, Rascu S, Siener R, Sountoulides P, Stamatelou K, Syed J, Trinchieri A. Papatsoris A, et al. Arch Ital Urol Androl. 2025 Jun 30;97(2):14085. doi: 10.4081/aiua.2025.14085. Epub 2025 Jun 30. Arch Ital Urol Androl. 2025. PMID: 40583613 Review.

Cited by

References

    1. Aranda‐Anzaldo, A. , and Dent M. A.. 2017. “Why Cortical Neurons Cannot Divide, and Why Do They Usually Die in the Attempt?” Journal of Neuroscience Research 95, no. 4: 921–929. - PubMed
    1. Baldassarre, G. , Belletti B., Nicoloso M. S., et al. 2005. “p27Kip1‐Stathmin Interaction Influences Sarcoma Cell Migration and Invasion.” Cancer Cell 7, no. 1: 51–63. - PubMed
    1. Balusu, S. , Horré K., Thrupp N., et al. 2023. “MEG3 Activates Necroptosis in Human Neuron Xenografts Modeling Alzheimer's Disease.” Science 381, no. 6663: 1176–1182. 10.1126/science.abp9556. - DOI - PMC - PubMed
    1. Baughn, M. W. , Melamed Z., López‐Erauskin J., et al. 2023. “Mechanism of STMN2 Cryptic Splice‐Polyadenylation and Its Correction for TDP‐43 Proteinopathies.” Science 379, no. 6637: 1140–1149. 10.1126/science.abq5622. - DOI - PMC - PubMed
    1. Bellouze, S. , Baillat G., Buttigieg D., de la Grange P., Rabouille C., and Haase G.. 2016. “Stathmin 1/2‐Triggered Microtubule Loss Mediates Golgi Fragmentation in Mutant SOD1 Motor Neurons.” Molecular Neurodegeneration 11: 1–20. - PMC - PubMed

Substances

LinkOut - more resources