. 2025 May 31;39(10):e70650.
doi: 10.1096/fj.202500371R.

Histone Deacetylase 6 Controls Atrial Fibrosis and Remodeling in Postinfarction Mice Through the Modulation of Wnt3a/GSK-3β Signaling

Affiliations

Histone Deacetylase 6 Controls Atrial Fibrosis and Remodeling in Postinfarction Mice Through the Modulation of Wnt3a/GSK-3β Signaling

Shangzhi Shu et al. FASEB J. .

Abstract

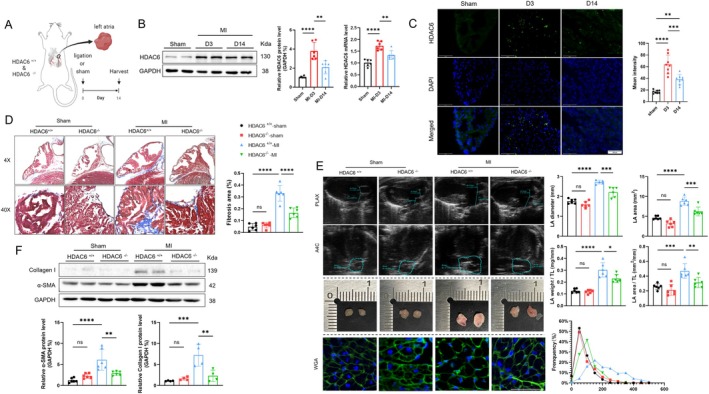
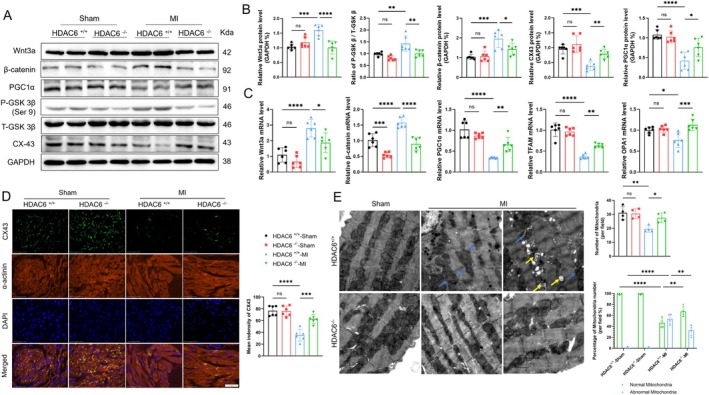
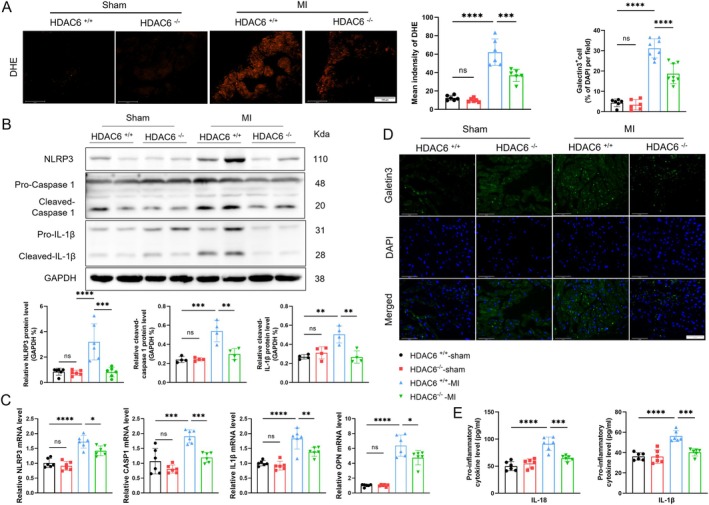
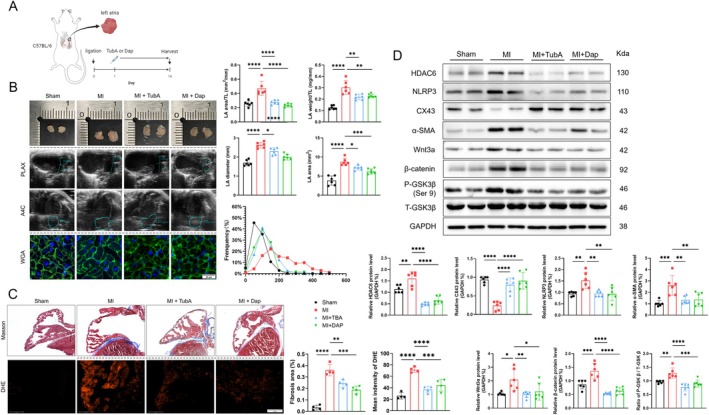
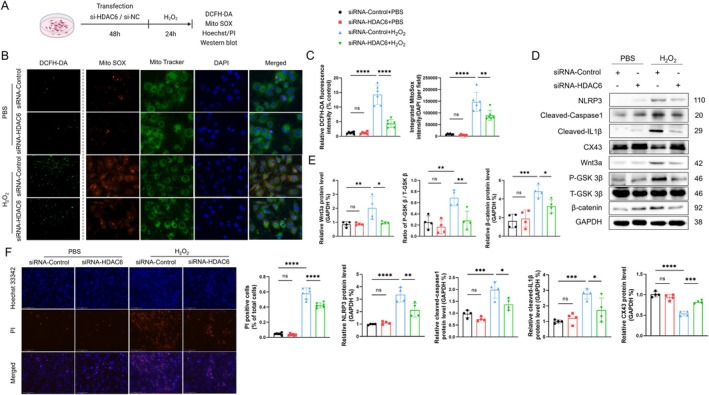
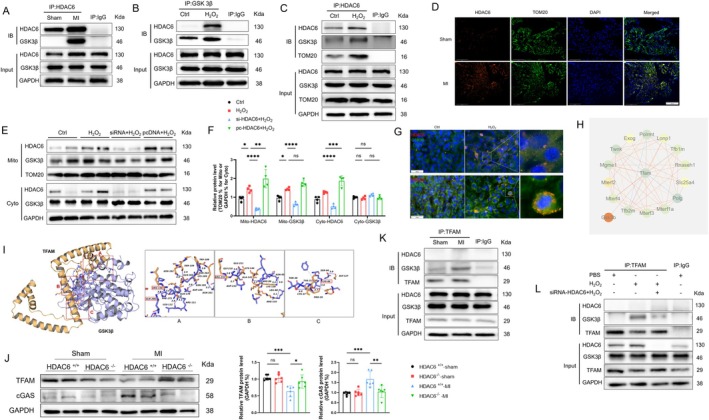
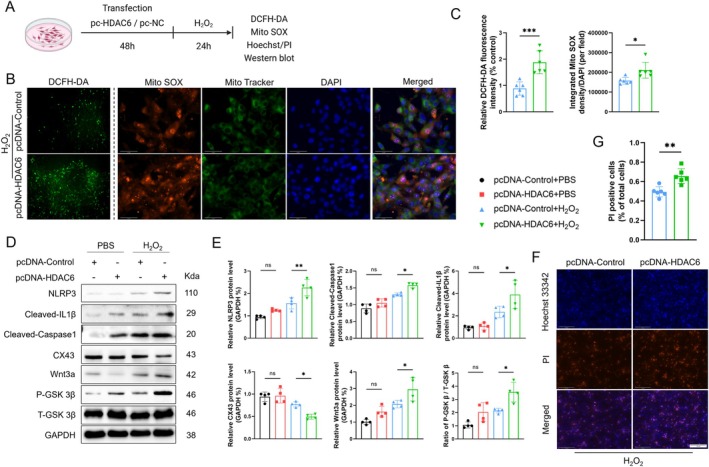
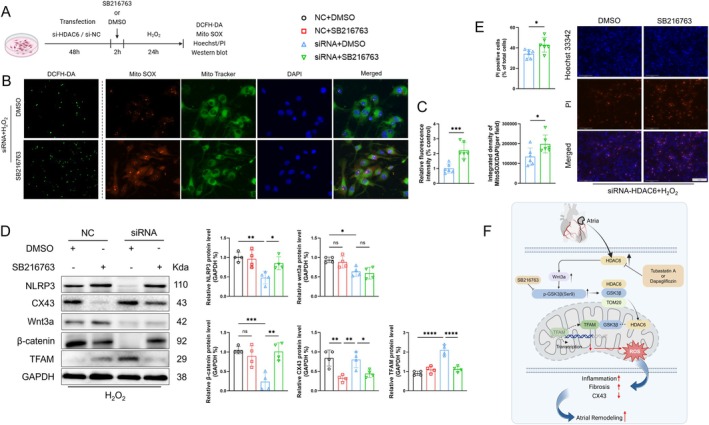
Myocardial infarction (MI)-induced hemodynamic disorder often causes atrial structural and electrophysiological remodeling. Given that histone deacetylase 6 (HDAC6) plays important roles in pathobiology, we investigated the molecular mechanism underlying MI-induced atrial remodeling in mice, with a special focus on HDAC6-mediated Wnt3a/GSK3β signaling activation. We observed an upregulation of HDAC6 expression in the left atria of mice at 2 weeks post-MI, accompanied by atrial enlargement, increased atrial fibrosis and inflammation, myocyte hypertrophy, impaired mitochondrial biogenesis, elevated levels of Wnt3a, GSK3β, and β-catenin protein, and reduced gap junction CX43 expression; these alterations were reversed by HDAC6 deletion. This atrialoprotective effect was mimicked by HDAC6 inhibition with the HDAC6 inhibitor tubastatin A (TubA). In HL1 mouse atrial myocytes, HDAC6 silencing (or overexpression) reduced (increased) the Wnt3a and p-GSK3β protein levels, providing evidence and a mechanistic explanation of HDAC6-mediated Wnt3a/GSK3β signaling activation in mitochondrial oxidative stress production and cell pyroptosis. After HDAC6 formed a complex with GSK3β and translocated into the mitochondria, GSK3β competitively bound with TFAM to mtDNA, thereby affecting mitochondrial function and ROS generation. The SGLT2 inhibitor dapagliflozin exhibited efficacy that was comparable to that of TubA by inhibiting HDAC6 signaling in mice. These results indicate an essential role of HDAC6 in atrial remodeling in response to post-MI stress, possibly via the modulation of Wnt3a/GSK3β-mediated mitochondrial oxidative stress production and pyroptosis and matrix protein production, and they suggest a novel therapeutic strategy for the prevention of post-MI-related atrial morphological and electrophysiological remodeling by regulating HDAC6 activity.

Keywords: atrial remodeling; fibrosis; mitochondria; myocardial infarction; oxidative stress.


Conflict of interest statement

The authors declare no conflicts of interest.

Figures

FIGURE 1
FIGURE 1
Increased expression of HDAC6 in the left atrial (LA) post‐myocardial infarction (MI) contributes to atrial fibrosis and enlargement, and this is alleviated by HDAC6 deficiency. (A) Illustration of the experimental protocol. (B, C) HDAC6 protein, mRNA levels, and immunofluorescence (scale bar: 100 μm) were evaluated in the sham group and at 3 and 14 days post‐MI. (D, F) Masson's staining of the LA at 14 days post‐MI, along with the western blot of fibrosis‐related proteins (α‐SMA and collagen I). The results of the quantitative analysis of the fibrosis area and protein levels are shown. (E) Representative echocardiography, gross specimens, and wheat germ agglutinin (WGA) staining (scale bar: 50 μm) of the LA at 14 days post‐MI, performed to evaluate LA enlargement and cardiomyocyte size. The LA diameter, LA area, LA weight/TL (tibia length), LA area/TL, and the frequency distribution of cell size were evaluated separately. *p < 0.05, **p < 0.01, ***p < 0.001, ****p < 0.0001. A4C, apical four‐chamber view; DAPI, 4′: 6‐diamidino‐2‐phenylindole; PLAX, parasternal long‐axis view.
FIGURE 2
FIGURE 2
HDAC6 deficiency affects the Wnt/GSK3β signal pathway, inhibits CX43 downregulation, and restores mitochondrial function. (A, B) The protein level of wnt3a, β‐catenin, PGC1α, CX43, P‐GSK3β, and T‐GSK3β by western blot. The results of the quantitative analysis of Wnt3a, β‐catenin, PGC1α, the CX43 level, and the ratio of P‐GSK3β/T‐GSK3β are shown. (C) The relative mRNA levels of Wnt3a, β‐catenin, PGC1α, TFAM, and OPA1. (D) Immunofluorescence of CX43 (green), α‐actinin (red), and DAPI (blue) (scale bar: 50 μm). The results of the quantitative analysis of CX43 fluorescence intensity are shown. (E) Transmission electron microscopy images of mitochondria (scale bar: 1 μm). *p < 0.05, **p < 0.01, ***p < 0.001, ****p < 0.0001. CX43, connexin 43; P‐T‐GSK3β, phosphorylated or total glycogen synthase kinase 3 beta; PGC1α, peroxisome proliferator‐activated receptor gamma coactivator 1‐alpha; TFAM, mitochondrial transcription factor A.
FIGURE 3
FIGURE 3
HDAC6 deficiency alleviates oxidative stress and inflammation in the LA post‐MI. (A) DHE staining of LA tissue 3 days post‐MI (scale bar: 100 μm). The results of the quantitative analysis of fluorescence intensity are shown. (B) Western blot of NLRP3, pro‐caspase1, cleaved‐caspase1, pro‐IL1β, cleaved‐IL1β, and CX43. The results of the quantitative analysis of NLRP3, cleaved‐caspase1, cleaved‐IL1β, and CX43 are shown. (C) The relative mRNA levels of NLRP3, CASP1, IL1β and OPN. (D) Representative immunofluorescence staining of galectin 3 (green) and DAPI (blue). The results of the quantitative analysis of galectin3‐positive cells are shown. (E) The ELISA assay measurements of the serum IL‐1β and IL‐18 concentrations. *p < 0.05, **p < 0.01, ***p < 0.001, ****p < 0.0001. DHE, dihydroethidium; OPN, osteopontin.
FIGURE 4
FIGURE 4
Tubastatin A and dapagliflozin can inhibit HDAC6 and alleviate atrial remodeling post‐MI. (A) Illustration of the experimental protocol. (B) Representative echocardiography, gross specimens, and WGA staining results (scale bar: 50 μm) of atrial tissue after 14 days of drug treatment. The LA diameter, LA area, LA weight/TL, LA area/TL, and the frequency distribution of cell size were evaluated separately. (C) Masson staining of the LA after 14 days of drug treatment and the results of the quantitative analysis of the fibrosis area. DHE staining of LA after 3 days of drug treatment and the quantitative analysis results concerning fluorescence intensity. (D) The western blot and quantitative analysis of HDAC6, NLRP3, CX43, α‐SMA, Wnt3a, β‐catenin, P‐GSK3β, and T‐GSK3β. *p < 0.05, **p < 0.01, ***p < 0.001, ****p < 0.0001.
FIGURE 5
FIGURE 5
HDAC6 knockout alleviates H2O2‐induced pyroptosis, oxidative stress, and CX43 downregulation in HL1 cells. (A) Illustration of the transfection and treatment experimental protocol. (B, C) DCFH‐DA (scale bar: 100 μm) and Mito SOX (red)/Mito Tracker (green) (scale bar: 50 μm) staining of cells after siRNA transfection and H2O2 treatment. The results of the quantitative analysis of fluorescence intensity are presented. (D, E) Western blot and quantitative analysis of NLRP3, cleaved‐caspase1, cleaved‐IL1β, CX43, Wnt3a, P‐GSK3β, T‐GSK3β and β‐catenin. (F) Hoechst/PI staining of cells in each group. The results of the quantitative analysis of PI‐positive cells are shown. *p < 0.05, **p < 0.01, ***p < 0.001, ****p < 0.0001. DCFH‐DA, 2′,7′‐dichlorodihydrofluorescein diacetate; MitoSOX, mitochondrial superoxide indicator; PI, propidium iodide.
FIGURE 6
FIGURE 6
HDAC6 binds to GSK3β and translocates to the mitochondria in H2O2‐induced HL1 cells and atria post‐MI. (A) Co‐immunoprecipitation using HDAC6 antibody in the LA after MI. (B) Co‐immunoprecipitation using GSK3β antibody in cells with or without H2O2 induction. (C) Co‐immunoprecipitation using HDAC6 antibody or IgG Isotype antibody. Immunoblotting was performed for GSK3β, HDAC6, and TOM20. (D) Immunofluorescence of TOM20 (green), HDAC6 (red), and DAPI (blue) (scale bar: 100 μm). (E, F) Western blotting was conducted separately for HDAC6 and GSK3β in mitochondrial and cytoplasmic fractions, using TOM20 as the mitochondrial reference marker and GAPDH as the cytoplasmic reference marker. The results of the quantitative analysis of HDAC6 and GSK3β are shown. (G) Cell immunofluorescence staining, from top to bottom: HDAC6 (red) and GSK3β (green), and HDAC6 (red) and TOM20 (green), with all nuclei stained using DAPI (blue) (scale bar: 50 μm). (H) GSK3β with the proteins that are closely related to mitochondrial function and structure. (I) Graphical representation of molecular binding between GSK3β and TFAM protein obtained with the HDOCK server. (J) Western blot and quantitative analyses of TFAM and cGAS. (K, L) Co‐immunoprecipitation using TFAM antibody in LA post‐MI and in cells with or without H2O2 induction. *p < 0.05, **p < 0.01, ***p < 0.001, ****p < 0.0001. cGAS, cyclic GMP‐AMP synthase.
FIGURE 7
FIGURE 7
HDAC6 overexpression activates the Wnt3a/GSK3β signaling pathway, promoting oxidative stress and pyroptosis. (A) The transfection and treatment experimental protocol. (B, C) DCFH‐DA (scale bar: 100 μm) and Mito SOX (red)/Mito Tracker (green) (scale bar: 50 μm) staining of cells after pcDNA transfection and H2O2 induction. The results of the quantitative analysis of fluorescence intensity ae shown. (D, E) Western blot and quantitative analysis of NLRP3, cleaved‐caspase1, cleaved‐IL1β, CX43, Wnt3a, β‐catenin, P‐GSK3β, and T‐GSK3β in cells with HDAC6 overexpression. (F, G) Hoechst/PI staining of cells in each group. The results of the quantitative analysis of PI‐positive cells. *p < 0.05, **p < 0.01, ***p < 0.001, ****p < 0.0001.
FIGURE 8
FIGURE 8
HDAC6 promotes oxidative stress by modulating the Wnt/GSK3β signaling pathway. (A) The transfection and treatment experimental protocol. (B, C) DCFH‐DA (scale bar: 100 μm) and Mito SOX (red)/Mito Tracker (green) (scale bar: 50 μm) staining of cells after siRNA transfection, SB216763 treatment, and H2O2 induction. The results of the quantitative analysis of fluorescence intensity are presented. (D) Western blot and quantitative analysis of wnt3a, β‐catenin, NLRP3, and CX43 in cells in each group. (E) Hoechst/PI staining of cells after transfection and treatment. The results of the quantitative analysis of PI‐positive cells. (F) Schematic illustration of the role of HDAC6 in regulating atrial remodeling post‐MI. *p < 0.05, **p < 0.01, ***p < 0.001, ****p < 0.0001. OCR, oxygen consumption rate.

Similar articles

Cited by

References

    1. Schmitt J., Duray G., Gersh B. J., and Hohnloser S. H., “Atrial Fibrillation in Acute Myocardial Infarction: A Systematic Review of the Incidence, Clinical Features and Prognostic Implications,” European Heart Journal 30 (2009): 1038–1045. - PubMed
    1. Montero‐Cabezas J. M., Abou R., Chimed S., et al., “Effects of Atrial Ischemia on Left Atrial Remodeling in Patients With ST‐Segment Elevation Myocardial Infarction,” Journal of the American Society of Echocardiography 36 (2023): 163–171. - PubMed
    1. Tubeeckx M. R. L., De Keulenaer G. W., Heidbuchel H., and Segers V. F. M., “Pathophysiology and Clinical Relevance of Atrial Myopathy,” Basic Research in Cardiology 119 (2024): 215–242. - PubMed
    1. De Jong A. M., Maass A. H., Oberdorf‐Maass S. U., Van Veldhuisen D. J., Van Gilst W. H., and Van Gelder I. C., “Mechanisms of Atrial Structural Changes Caused by Stretch Occurring Before and During Early Atrial Fibrillation,” Cardiovascular Research 89 (2011): 754–765. - PubMed
    1. Maguy A., Mahendran Y., Tardif J. C., Busseuil D., and Li J., “Autoimmune Atrial Fibrillation,” Circulation 148 (2023): 487–498. - PMC - PubMed

MeSH terms

LinkOut - more resources