. 2025 May 10;53(9):gkaf415.
doi: 10.1093/nar/gkaf415.

Transcription factors form a ternary complex with NIPBL/MAU2 to localize cohesin at enhancers

Affiliations

Transcription factors form a ternary complex with NIPBL/MAU2 to localize cohesin at enhancers

Gregory Fettweis et al. Nucleic Acids Res. .

Abstract

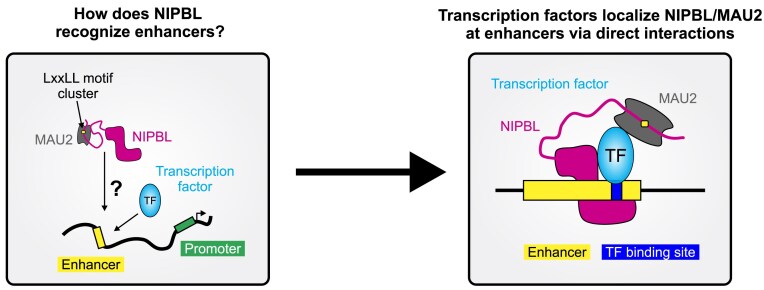
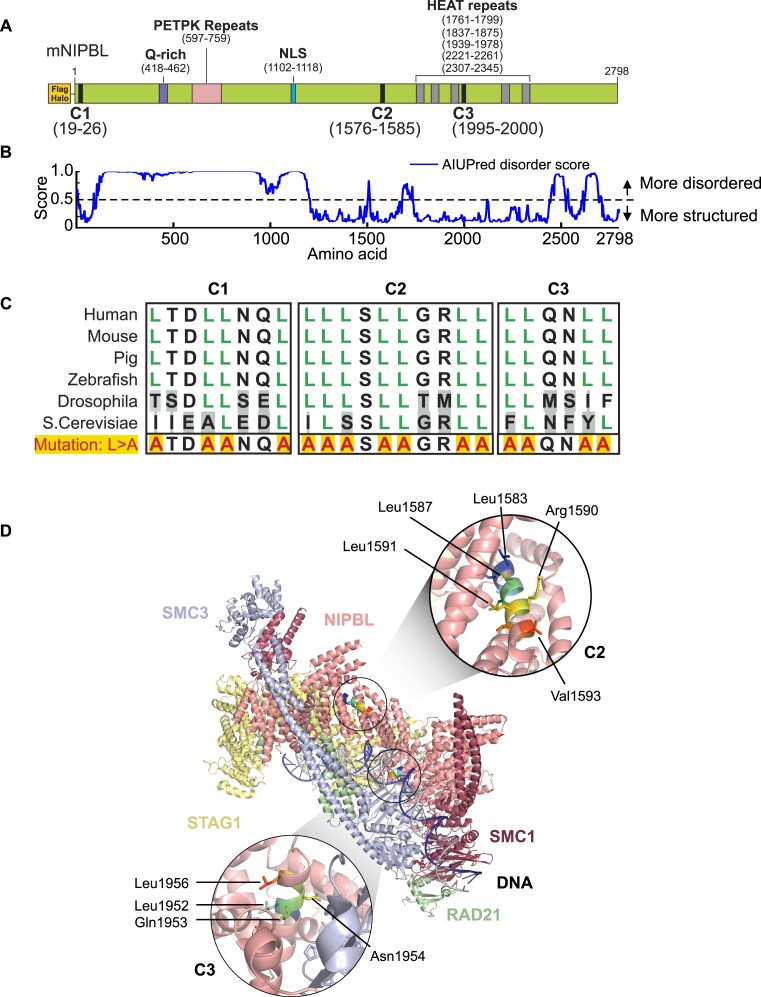
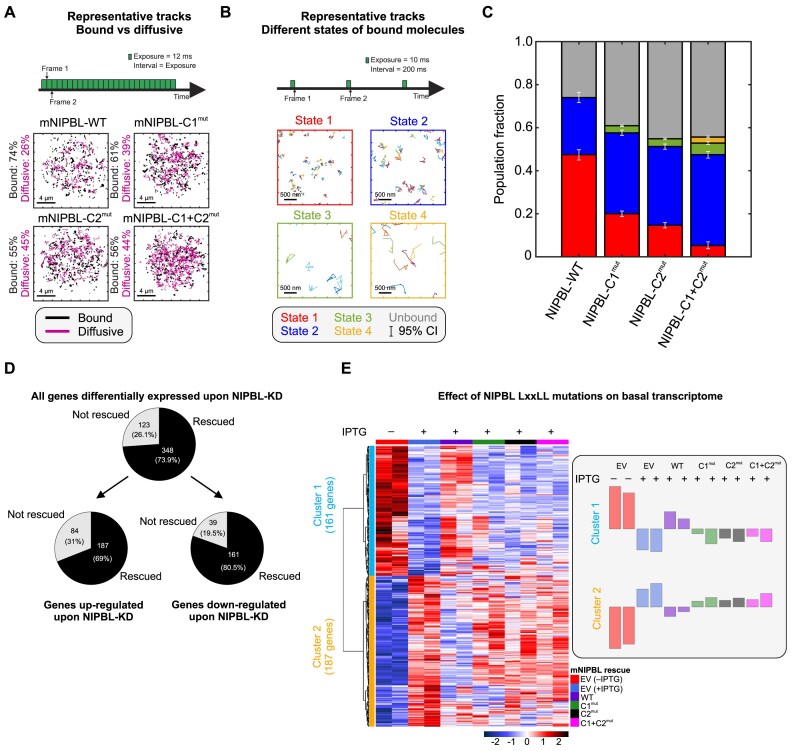
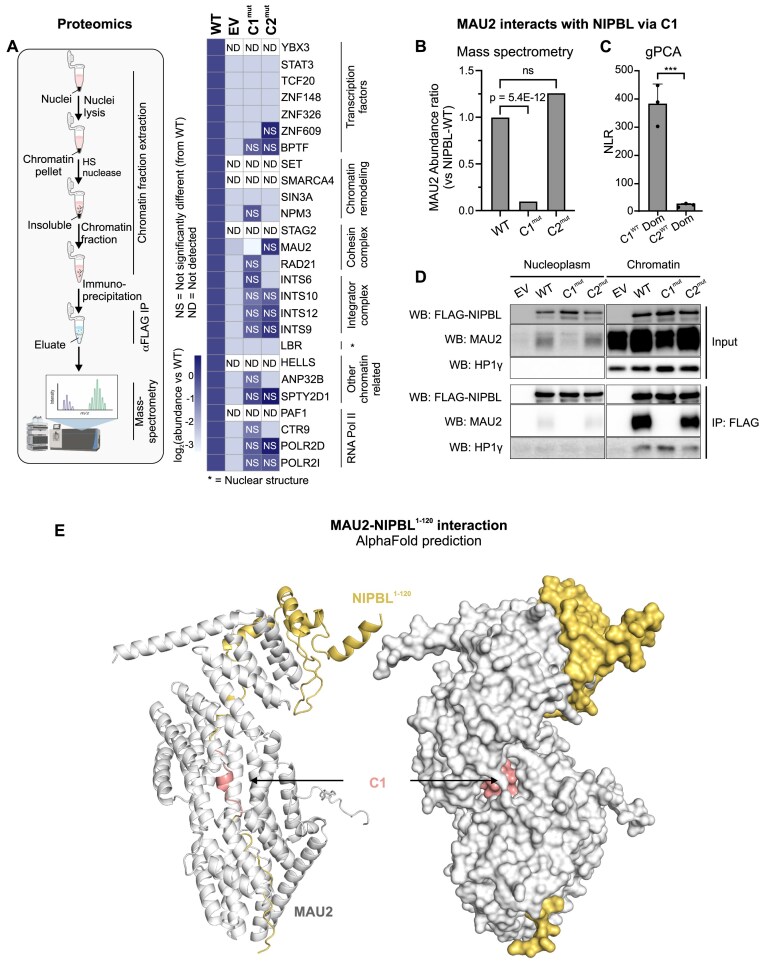
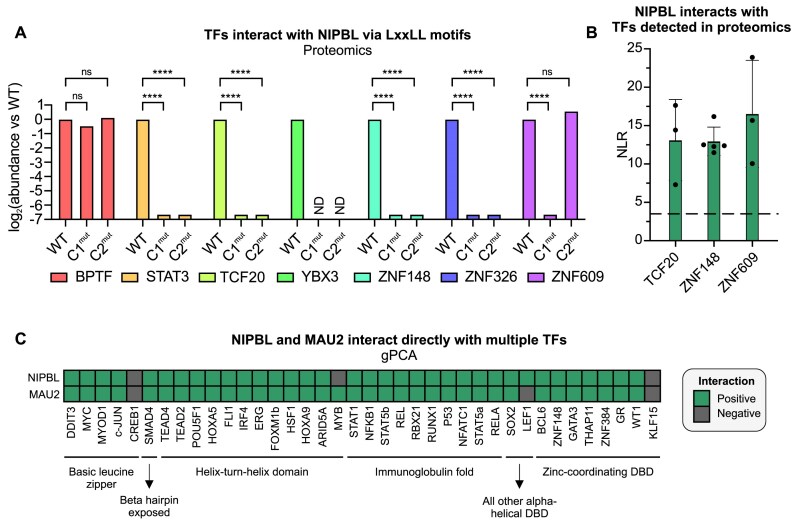
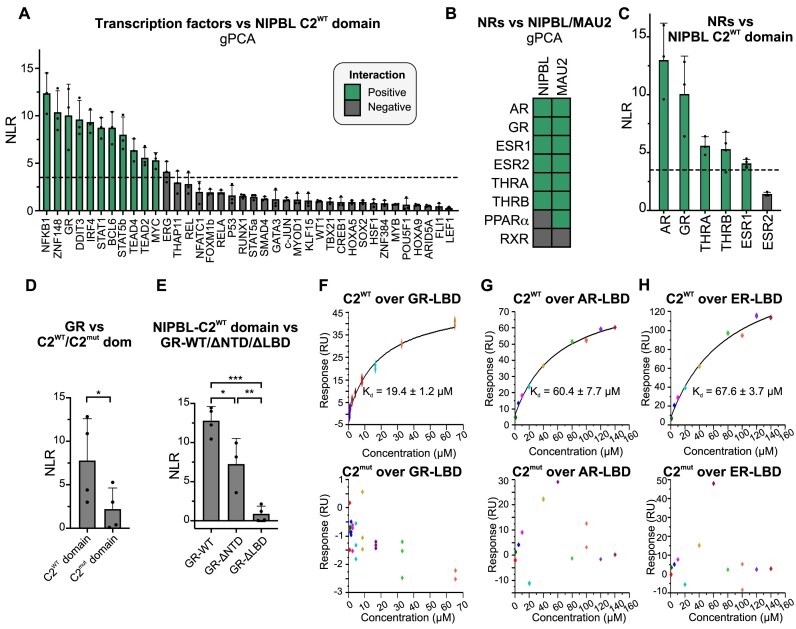
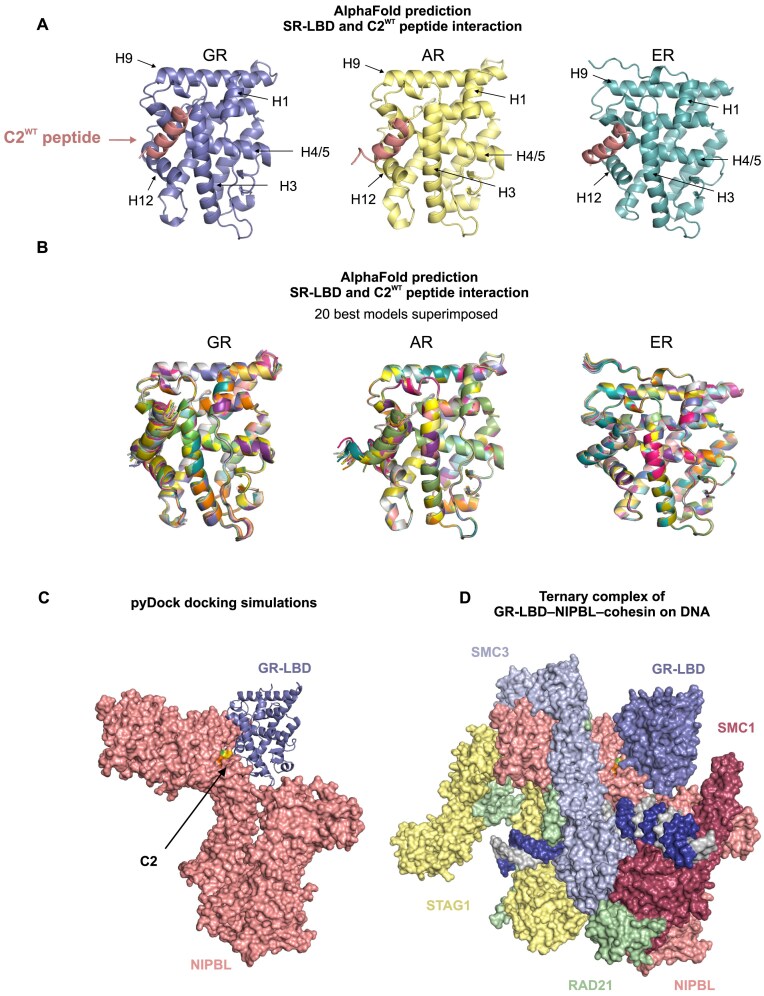
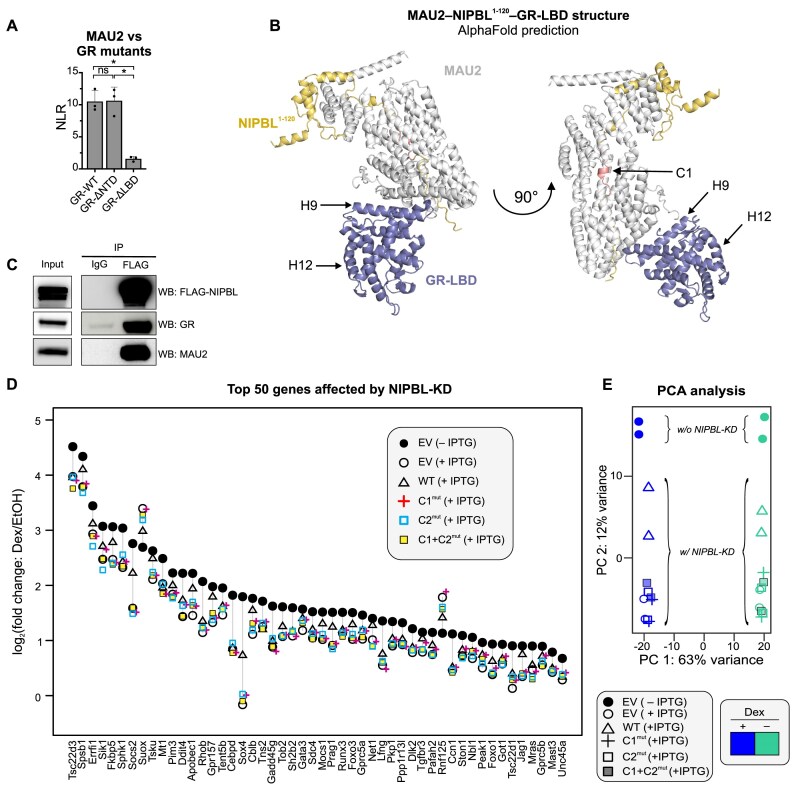
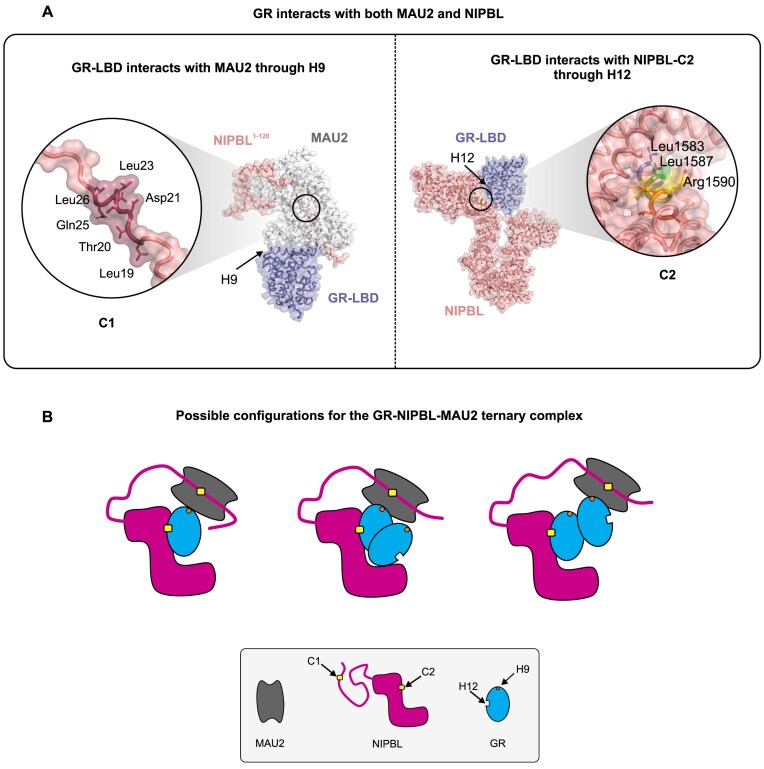
While the cohesin complex is a key player in genome architecture, how it localizes to specific chromatin sites is not understood. Recently, we and others have proposed that direct interactions with transcription factors lead to the localization of the cohesin-loader complex (NIPBL/MAU2) within enhancers. Here, we identify two clusters of LxxLL motifs within the NIPBL sequence that regulate NIPBL dynamics, interactome, and NIPBL-dependent transcriptional programs. One of these clusters interacts with MAU2 and is necessary for the maintenance of the NIPBL-MAU2 heterodimer. The second cluster binds specifically to the ligand-binding domains of steroid receptors. For the glucocorticoid receptor (GR), we examine in detail its interaction surfaces with NIPBL and MAU2. Using AlphaFold2 and molecular docking algorithms, we uncover a GR-NIPBL-MAU2 ternary complex and describe its importance in GR-dependent gene regulation. Finally, we show that multiple transcription factors interact with NIPBL-MAU2, likely using interfaces other than those characterized for GR.


Conflict of interest statement

The authors declare no competing interests.

Figures

Graphical Abstract
Graphical Abstract
Figure 1.
Figure 1.
NIPBL contains three Leu-rich clusters. (A) Domain organization of mNIPBL including the ectopic 3×FLAG-Halo protein tags at the N-terminus of the protein. The three annotated LxxLL motif clusters are indicated as C1, C2, and C3. (B) AIUPred disorder score for mNIPBL. (C) Conservation of NIPBL LxxLL motif clusters across species. In the C1 and/or C2 mutants all Leu (L) are mutated to alanines (A) in the respective clusters. (D) Overall structure of the human cohesin–NIPBL–DNA complex solved by cryogenic electron microscopy (cryo-EM) [39]. The C2 and C3 clusters are indicated in the insets, C1 is within the disordered N-terminus and hence cannot be visualized by cryo-EM. See also Supplementary Fig. S1.
Figure 2.
Figure 2.
LxxLL mutations alter NIPBL dynamics and basal transcriptome. (A) Fast SMT protocol (top) and 500 randomly selected single molecule trajectories for indicated species (bottom). Bound and diffusive fractions are indicated on the left of the respective panels. Scale bar is 4 μm. Ncells/Ntracks = 70/15 394 (WT), 142/82 691 (C1mut), 76/46 879 (C2mut), and 75/27 535 (C1 + C2mut). (B) Intermediate SMT protocol captures the motion of bound NIPBL molecules (top). Representative trajectories of molecules in each of the four detected mobility states (bottom). Scale bar is 500 nm. Ncells/Ntracks/Nsub-tracks = 53/1496/7004 (WT), 65/5769/19 632 (C1mut), 69/4398/22 317 (C2mut), and 67/1746/7729 (C1 + C2mut). (C) Population fractions for indicated mNIPBL species. Error bars = 95% confidence interval. (D) Differentially expressed genes upon NIPBL-KD rescued by 3×FLAG-Halo-mNIPBL-WT expression under basal conditions. (E) (Left) Heatmap of the 348 genes rescued by ectopic 3×FLAG-Halo-NIPBL-WT compared across the cell lines. (Right) Average expression bar plots for the genes in each cluster. See also Supplementary Figs S2 and S3 and Supplementary Videos S1 and S2.
Figure 3.
Figure 3.
Leu-rich clusters recruit diverse chromatin-associated proteins, with C1 being necessary to maintain the NIPBL–MAU2 interaction. (A) (Left) Schematic representation of the proteomics experiments. (Right) Heatmap of abundance ratio of peptides detected in WT versus indicated NIPBL mutants. (B) MAU2 abundance detected in NIPBL-C1mut and C2mut relative to WT. P-value is reported from a one-way ANOVA. (C) NLRs for MAU2 against mNIPBL-C1WT and mNIPBL-C2WT domains. Error bars denote standard deviation across three independent experiments. ***P < .001 (paired t-test). (D) Co-immunoprecipitation of MAU2 with NIPBL-WT, C1mut, and C2mut using the anti-FLAG antibody. (E) AlphaFold2-Multimer prediction of mNIPBL1–120 with mMAU2. See also Supplementary Fig. S4.
Figure 4.
Figure 4.
Multiple TFs interact with NIPBL and MAU2. (A) MS log2(abundance ratio: C1mut/C2mut versus WT) of selected TFs. ****P < .001 (one-way ANOVA). (B) NLRs for three TFs detected in the proteomics experiments against full length NIPBL. Statistical significance of the NLRs is evaluated through a one-tail one-sample t-test against a threshold of 3.5 (see the “Materials and methods” section). The dashed line represents the threshold NLR of 3.5 and the error bars denote the standard deviation across replicates. (C) Heatmap of gPCA interactions of NIPBL and MAU2 against a panel of TFs. See also Supplementary Fig. S5.
Figure 5.
Figure 5.
SR-LBDs interact with NIPBL through C2. (A) NLRs of the NIPBL-C2WT domain against indicated TFs. NLRs are scored based on a one-tail one-sample t-test against a threshold of 3.5 (see the “Materials and methods” section). The dashed line represents the threshold NLR of 3.5. (B) Heatmap of interactions between NIPBL/MAU2 and NRs as detected by gPCA. (C–E) NLRs for (C) NIPBL-C2WT domain against the NRs that scored positively against NIPBL-WT; (D) the GR against NIPBL-C2WT/C2mut domains; *P < .05 (paired t-test); (E) NIPBL-C2WT domain versus GR-WT, GR lacking its N-terminus domain (GR-ΔNTD), or its LBD (GR-ΔLBD), *P < .05, **P < .01, ***P < .001 (one-way ANOVA and Tukey test for multiple comparisons). Error bars in panels A–E represent the standard deviation across measurements. (FH) SPR affinity curves for indicated hSR-LBDs against hNIPBL-C2WT (top) and C2mut (bottom) peptides along with the equilibrium dissociation constant (Kd) for each interaction. The experiments were conducted in triplicate for the GR-LBD and in duplicate for the AR- and ER-LBDs, using increasing concentrations of the C2 peptides (from 0 to 160 μM) as the analyte. AR = androgen receptor and ER = estrogen receptor. See also Supplementary Figs S6 and S7.
Figure 6.
Figure 6.
NIPBL C2 interacts with the AF-2 pocket of the SR-LBD. (A) AlphaFold2-Multimer predictions for the interaction between hNIPBL–C2WT peptide (salmon) and the LBDs of the human GR, AR, and ER. (B) Superposition of the 20 best AlphaFold2-Multimer models showing the interaction between the C2WT peptide and (left) GR, (middle) AR, and (right) ER. (C) Docking prediction for the hGR-LBD with the structured portion of hNIPBL. (D) Superposition of the pyDock prediction of the NIPBL–GR-LBD structure with the cryo-EM structure of the NIPBL–cohesin–DNA complex [39].
Figure 7.
Figure 7.
The GR forms a ternary complex with NIPBL/MAU2 with implications for glucocorticoid signaling. (A) gPCA results of MAU2 against the GR: wild type (GR-WT), GR mutant lacking the N-terminus domain (GR-ΔNTD), and GR lacking the LBD (GR-ΔLBD). See the “Materials and methods” section. *P < 0.05 (one-way ANOVA followed by Tukey test). Error bars denote the standard deviation. (B) AlphaFold2-Multimer prediction of the composite structure of mMAU2–mNIPBL1–120–mGR-LBD. (C) Triple-immunoprecipitation (IP) of FLAG-NIPBL, MAU2, and GR in cl15-WT cells. (D) Scatter plot of the top 50 genes whose Dex-response is affected upon NIPBL-KD. (E) PCA plot of the RNA-seq data across multiple conditions presented in Figs 2 and 7. See also Supplementary Fig. S8.
Figure 8.
Figure 8.
Possible models for a GR–NIPBL–MAU2 ternary complex. (A) (Left) The GR-LBD interacts with the NIPBL1–120–MAU2 complex through helix 9. NIPBL1–120 and MAU2 interact through the C1 LxxLL motif cluster. (Right) The GR-LBD interacts with NIPBL–C2 through helix 12 in the AF-2 pocket. Key residues within C1 and C2 are indicated in the insets. (B) Possible configurations of the GR–NIPBL–MAU2 ternary complex: (Left) A single GR monomer can interact with both NIPBL–C2 through the AF-2 pocket and MAU2 through helix 9. (Middle and right) Since the dimerization interface of GR is not occluded by either NIPBL or MAU2, a GR dimer can interact with NIPBL/MAU2 either through (middle) a single GR molecule or (right) with one GR molecule interacting with NIPBL–C2 and another one interacting with MAU2.

Update of

Similar articles

Cited by

References

    1. Sanborn AL, Rao SS, Huang SC et al. . Chromatin extrusion explains key features of loop and domain formation in wild-type and engineered genomes. Proc Natl Acad Sci USA. 2015; 112:E6456–65.10.1073/pnas.1518552112. - DOI - PMC - PubMed
    1. Ciosk R, Shirayama M, Shevchenko A et al. . Cohesin’s binding to chromosomes depends on a separate complex consisting of Scc2 and Scc4 proteins. Mol Cell. 2000; 5:243–54.10.1016/S1097-2765(00)80420-7. - DOI - PubMed
    1. Alonso-Gil D, Losada A NIPBL and cohesin: new take on a classic tale. Trends Cell Biol. 2023; 33:860–71.10.1016/j.tcb.2023.03.006. - DOI - PubMed
    1. Phillips JE, Corces VG CTCF: master weaver of the genome. Cell. 2009; 137:1194–211.10.1016/j.cell.2009.06.001. - DOI - PMC - PubMed
    1. Murayama Y, Uhlmann F DNA entry into and exit out of the cohesin ring by an interlocking gate mechanism. Cell. 2015; 163:1628–40.10.1016/j.cell.2015.11.030. - DOI - PMC - PubMed

MeSH terms