. 2025 Jul;69(14):e70114.
doi: 10.1002/mnfr.70114. Epub 2025 May 16.

Shielding Human Adipocytes From Inflammation: The Protective Potential of Polyphenol-Rich Opuntia ficus-indica Cladode Extract

Affiliations

Shielding Human Adipocytes From Inflammation: The Protective Potential of Polyphenol-Rich Opuntia ficus-indica Cladode Extract

Stefano Quarta et al. Mol Nutr Food Res. 2025 Jul.

Abstract

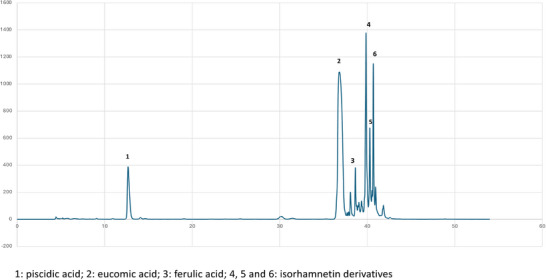
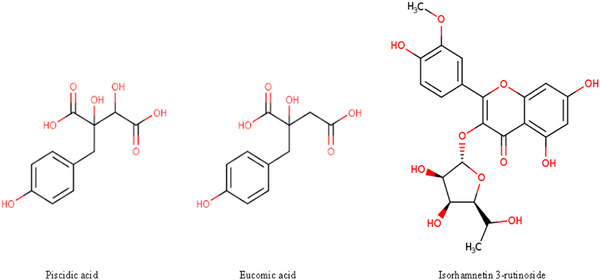
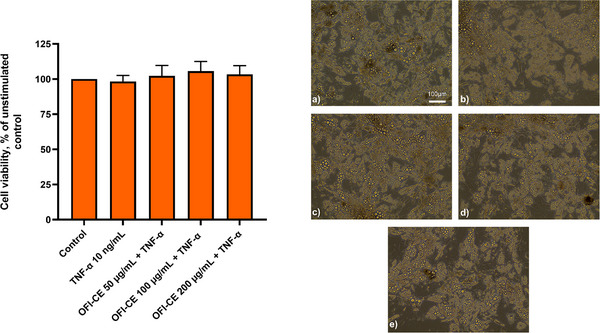
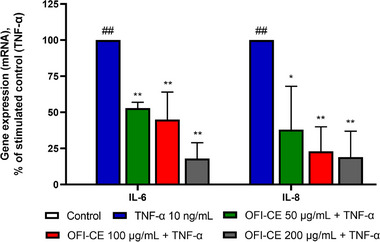
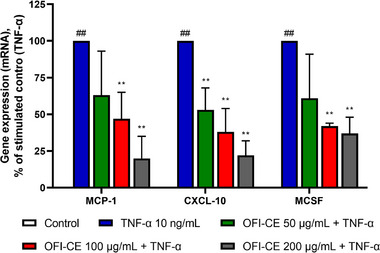
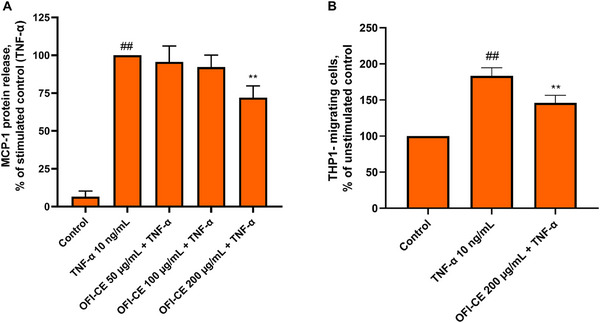
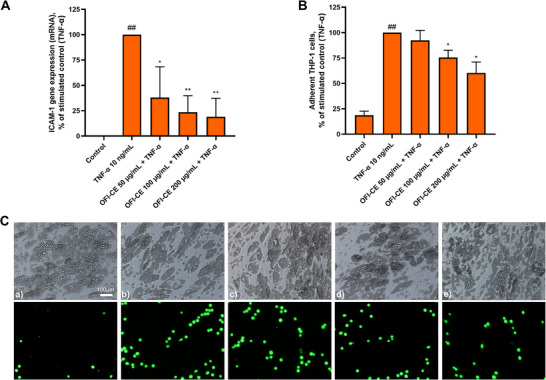
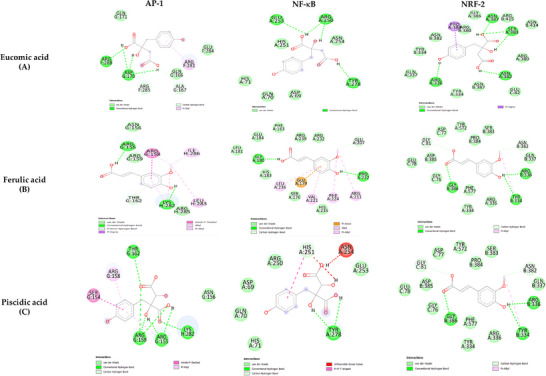
Opuntia ficus-indica (OFI) has attracted much attention as a source of antioxidant and antiinflammatory compounds. We hypothesize that the antioxidant content of OFI cladode extract may improve adipocyte dysfunction resulting from inflammatory stimulation of hypertrophic adipocytes. To this end, the properties of OFI cladode hydroalcoholic extract were evaluated in terms of antioxidant activity, regulation of adipocyte inflammation, and adipocyte/monocyte interaction in human adipocytes rendered dysfunctional by the proinflammatory cytokine tumor necrosis factor-α (TNF-α). The major phenolic compounds identified were isorhamnetin derivatives and phenolic acids, including piscidic and eucomic acids. Our results show that OFI cladode extract exhibits antiradical activities and reduces the adhesion and transmigration activity of monocytes to inflamed adipocytes by inhibiting various cytokines, chemokines, and adhesion molecules such as interleukin (IL)-6 and IL-8 by ∼80%, monocyte chemotactic protein (MCP)-1, C-X-C motif chemokine ligand (CXC-L)10, macrophage colony-stimulating factor (M-CSF) from 40% to 50%, and intercellular adhesion molecule-1 (ICAM-1) by 70% at the higher concentration. In structurally and mechanistically by protein-ligand docking profiling study, piscidic acid proved to be the best potential candidate for a regulatory interaction with the activities of nuclear factor erythroid 2-related factor 2 (NRF-2) and nuclear factor-κB (NF-κB). In summary, these data highlight the potential of OFI as a dietary supplement in nutritional treatments aimed at combating the inflammatory stigmata of obesity.

Keywords: Opuntia ficus‐indica (L.) Mill; adipocytes; eucomic acids; inflammation; isorhamnetin; piscidic.


Conflict of interest statement

The authors declare no conflicts of interest.

Figures

FIGURE 1
FIGURE 1
HPLC representative chromatogram of the OFI‐CE detected at λ = 280 nm. OFI‐CE, Opuntia ficus‐indica (L.) Mill.
FIGURE 2
FIGURE 2
Chemical structure of piscidic and eucomic acids and isorhamnetin 3‐rutinoside.
FIGURE 3
FIGURE 3
The effect of OFI‐CE treatment on cell viability. SGBS adipocytes were treated with OFI‐CE for 4 h at the concentrations indicated, and then either treated with 10 ng/mL TNF‐α or left untreated for 18 h. Cell viability was assessed by the MTT assay (left panel). Data (means ± SD, n = 3) are expressed as a percentage of the unstimulated control. Right panels, SGBS images were visualized and acquired with a phase contrast microscope at 10× magnification. (a) Control, (b) TNF‐α 10 ng/mL, (c) OFI‐CE 50 µg/mL + TNF‐α, (d) OFI‐CE 100 µg/mL + TNF‐α, and (e) OFI‐CE 200 µg/mL + TNF‐α. For statistical analysis, we used Student's t test. MTT, 3‐(4,5‐dimethylthiazol‐2‐yl)‐2,5‐diphenyl tetrazolium bromide; OFI‐CE, Opuntia ficus‐indica (L.) Mill; SGBS, Simpson–Golabi–Behmel syndrome adipocytes; TNF‐α, tumor necrosis factor‐α.
FIGURE 4
FIGURE 4
OFI‐CE treatment attenuates TNF‐α‐induced expression of IL‐6 and IL‐8. SGBSs were treated with OFI‐CE at the concentrations indicated for 4 h and then either treated with 10 ng/mL TNF‐α or left untreated for 18 h. Total RNA was extracted from cells, and mRNA levels of IL‐6 and IL‐8 were measured by qPCR using specific primers and normalized to 18S RNA. Data (means ± SD, n = 3) are expressed as percentage over TNF‐α alone. ##p < 0.01 versus basal (untreated) control; *p < 0.05 versus TNF‐α alone; **p < 0.01 versus TNF‐α alone. For statistical analysis, we used Student's t test. IL‐6, interleukin‐6; IL‐8, interleukin‐8; OFI‐CE, Opuntia ficus‐indica (L.) Mill; TNF‐α, tumor necrosis factor‐α.
FIGURE 5
FIGURE 5
OFI‐CE treatment counteracts TNF‐α‐induced expression of chemoattractant genes. SGBSs were treated with OFI‐CE at the concentrations indicated for 4 h and then either treated with 10 ng/mL TNF‐α or left untreated for 18 h. Total RNA was extracted from cells, and mRNA levels of MCP‐1, CXCL‐10, and M‐CSF were measured by qPCR using specific primers and normalized to 18S RNA. Data (means ± SD, n = 3) are expressed as percentage over TNF‐α alone. ##p < 0.01 versus basal (untreated) control; **p < 0.01 versus TNF‐α alone. For statistical analysis, we used Student's t test. OFI‐CE, CXC‐L10, C‐X‐C motif chemokine ligand 10; MCP‐1, monocyte chemoattractant protein‐1; M‐CSF, macrophage colony‐stimulating factor; Opuntia ficus‐indica (L.) Mill; TNF‐α, tumor necrosis factor‐α.
FIGURE 6
FIGURE 6
OFI‐CE treatment reduced TNF‐α‐induced release of MCP‐1 and chemiotaxis. SGBSs were treated with OFI‐CE at the concentrations indicated for 4 h and then either treated with 10 ng/mL TNF‐α or left untreated for 18 h. (A) Culture medium was collected, and MCP‐1 release was evaluated by ELISA assay. Data (mean ± SD, n = 3) are expressed as a percentage over TNF‐α alone. ##p < 0.01 versus basal (untreated) control; **p < 0.01 versus TNF‐α alone. (B) Culture medium was collected and added to the lower chamber in a Boyden chamber. THP‐1 (2.5 × 10⁶ cells/mL) were added to the upper chamber. After 60 min, migrated THP‐1 cells were measured by MTT assay. Data (means ± SD, n = 3) are expressed as the number of migrated monocytes over TNF‐α alone. ##p < 0.01 versus basal (untreated) control; **p < 0.05 versus TNF‐α alone. For statistical analysis, we used Student's t test. MCP‐1, monocyte chemoattractant protein‐1; MTT, 3‐(4,5‐dimethylthiazol‐2‐yl)‐2,5‐diphenyl tetrazolium bromide; OFI‐CE, Opuntia ficus‐indica (L.) Mill; TNF‐α, tumor necrosis factor‐α.
FIGURE 7
FIGURE 7
OFI‐CE counteracts TNF‐α‐induced ICAM‐1 expression and monocytes adhesion to inflamed adipocytes. SGBSs were treated with OFI‐CE at the concentrations indicated for 4 h and then either treated with 10 ng/mL TNF‐α or left untreated for 18 h. (A) Total RNA was extracted from cells, and mRNA levels of ICAM‐1 were measured by qPCR using specific primers and normalized to 18S RNA. Data (means ± SD, n = 3) are expressed as percentage over TNF‐α alone. ##p < 0.01 versus basal (untreated) control; *p < 0.05 versus TNF‐α alone; **p < 0.01 versus TNF‐α alone. (B, C) Fluorescently labeled THP‐1 (106 cells/mL) was added to the SGBS monolayers. After 1 h, nonadhering cells were removed by three washes, and images of SGBS and adherent calcein‐labeled THP‐1 cells were visualized and captured with a fluorescent microscope at 10× magnification. (a) Control, (b) TNF‐α 10 ng/mL, (c) OFI‐CE 50 µg/mL + TNF‐α, (d) OFI‐CE 100 µg/mL + TNF‐α, and (e) OFI‐CE 200 µg/mL + TNF‐α. Data (means ± SD, n = 3) are expressed as the number of adherent monocytes over TNF‐α alone. ##p < 0.01 versus basal (untreated) control; *p < 0.05 versus TNF‐α alone. For statistical analysis, we used Student's t test. ICAM‐1, Intercellular adhesion molecule‐1; MTT, 3‐(4,5‐dimethylthiazol‐2‐yl)‐2,5‐diphenyl tetrazolium bromide; OFI‐CE, Opuntia ficus‐indica (L.) Mill; TNF‐α, tumor necrosis factor‐α.
FIGURE 8
FIGURE 8
Molecular docking models of putative interactions with target proteins. The binding of eucomic, ferulic, and piscidic acid in the active site of AP‐1 (PDB ID, 1FOS), NF‐κB (PDB ID 4Q3J), and NRF‐2 (PDB ID 4L7B) is reported in 2D conformation. The images were rendered using Discovery Studio. AP‐1, activator protein 1; NF‐κB, nuclear factor‐κB; NRF‐2, nuclear factor erythroid 2‐related factor 2.

Similar articles

References

    1. Hruby A. and Hu F. B., “The Epidemiology of Obesity: A Big Picture,” Pharmacoeconomics 33 (2015): 673–689. - PMC - PubMed
    1. World Health Organization (2021) Obesity and overweight, https://www.who.int/news‐room/fact‐sheets/detail/obesity‐and‐overweight.
    1. Huang T. and Hu F. B., “Gene‐Environment Interactions and Obesity: Recent Developments and Future Directions,” BMC Medical Genomics 8, no. suppl. 1 (2015): S2. - PMC - PubMed
    1. Jacob R., Bertrand C., Llewellyn C., et al., “Dietary Mediators of the Genetic Susceptibility to Obesity—Results from the Quebec Family Study,” The Journal of Nutrition 152 (2022): 49–58. - PMC - PubMed
    1. Ellulu M. S., Patimah I., Khaza'ai H., Rahmat A., and Abed Y., “Obesity and Inflammation: The Linking Mechanism and the Complications,” Archives of Medical Science 13 (2017): 851–863. - PMC - PubMed

MeSH terms