Antibiotic resistome in the glacier forelands of polar regions
- PMID: 40377330
- PMCID: PMC12175520
- DOI: 10.1128/aem.00762-25
Antibiotic resistome in the glacier forelands of polar regions
Abstract
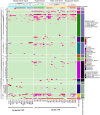
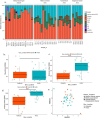
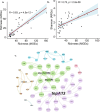
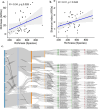
Antibiotic resistance genes (ARGs) pose a significant threat, exacerbated by climate change impacts on polar regions, particularly melting glaciers and permafrost. While ancient antibiotic resistance exists in the environments, the release and dissemination of ARGs remain poorly understood. This study investigated ARG composition and distribution in 43 metagenomes from Arctic and Antarctic glacier forelands. We identified 154 ARGs, predominantly bacitracin resistance, followed by rifamycin, fosfomycin, vancomycin, tetracycline, and beta-lactam resistance genes. Significant correlations were observed between ARGs and mobile genetic elements (MGEs), with 20 ARGs associated with tnpA MGEs. Actinomycetota and Pseudomonadota were the primary ARG-carrying phyla. Metagenome-assembled genomes revealed Mycobacterium sp., Pseudomonas sp., and Tatlockia sp. as major ARG-harboring pathogens in the glacier forelands. Evolutionarily adapted, distinct ancient ARGs were abundant in the polar environments, varying between different geographic regions. The environmental parameters such as pH and total organic carbon significantly influenced the ARG distribution in the Arctic and Antarctic glacier forelands. This study provides crucial baseline data on antimicrobial resistance, highlighting potential risks associated with rapid environmental change in the regions.
Importance: Antibiotic resistance poses a significant global health threat, exacerbated by the release of antibiotic resistance genes from melting glaciers and permafrost due to climate change. This study provides crucial baseline data on the composition and distribution of antibiotic resistance genes in these vulnerable polar environments, which is essential for understanding and mitigating the risks associated with their release. The findings have far-reaching implications for global health security and emphasize the need for further research to address this emerging threat.
Keywords: ARGs; MGEs; Mycobacterium; antimicrobial resistance; glacier forelands; polar regions.
Conflict of interest statement
The authors declare no conflict of interest.
Figures



Similar articles
-
From glacier forelands to human settlements: Patterns, environmental drivers, and risks of antibiotic resistance genes.J Hazard Mater. 2025 Aug 15;494:138455. doi: 10.1016/j.jhazmat.2025.138455. Epub 2025 May 3. J Hazard Mater. 2025. PMID: 40334594
-
The risk of pathogenicity and antibiotic resistance in deep-sea cold seep microorganisms.mSystems. 2025 Jun 17;10(6):e0157124. doi: 10.1128/msystems.01571-24. Epub 2025 May 21. mSystems. 2025. PMID: 40396743 Free PMC article.
-
The transfer of antibiotic resistance genes between evolutionarily distant bacteria.mSphere. 2025 Jun 25;10(6):e0011425. doi: 10.1128/msphere.00114-25. Epub 2025 Jun 3. mSphere. 2025. PMID: 40459279 Free PMC article.
-
Prioritization of Critical Factors for Surveillance of the Dissemination of Antibiotic Resistance in Pseudomonas aeruginosa: A Systematic Review.Int J Mol Sci. 2023 Oct 15;24(20):15209. doi: 10.3390/ijms242015209. Int J Mol Sci. 2023. PMID: 37894890 Free PMC article.
-
Horizontal Gene Transfer Systems for Spread of Antibiotic Resistance in Gram-Negative Bacteria.Microbiol Immunol. 2025 Jul;69(7):367-376. doi: 10.1111/1348-0421.13222. Epub 2025 May 15. Microbiol Immunol. 2025. PMID: 40370256 Review.
References
-
- IPCC . 2021. Climate change 2021: the physical science basis. Contribution of Working Group I to the Sixth Assessment Report of the Intergovernmental Panel on Climate Change. Edited by Masson-Delmotte V., Zhai P P., Pirani A., Connors S. L., Péan C., Berger S., Caud N., Chen Y., Goldfarb L., Gomis M. I., Huang M., Leitzell K., Lonnoy E., Matthews J. B. R., Maycock T. K., Waterfield T., Yelekçi O., Yu R., and Zhou B.. Cambridge, NY, USA: Cambridge University Press. doi: 10.1017/9781009157896 - DOI
MeSH terms
Substances
Grants and funding
LinkOut - more resources
Full Text Sources
Medical

