

The causal effects of mandatory health insurance coverage expansion in Switzerland
- PMID: 40377838
- PMCID: PMC12361299
- DOI: 10.1007/s10754-025-09396-5
The causal effects of mandatory health insurance coverage expansion in Switzerland
Abstract
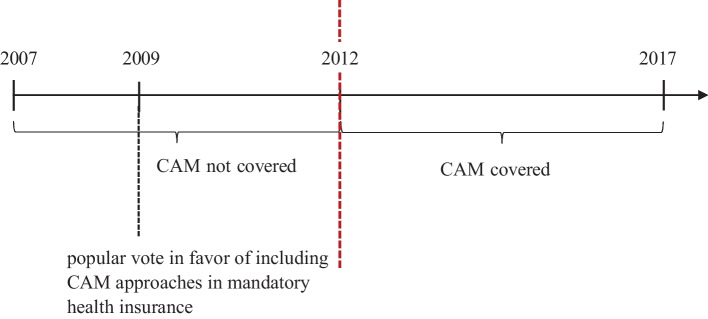
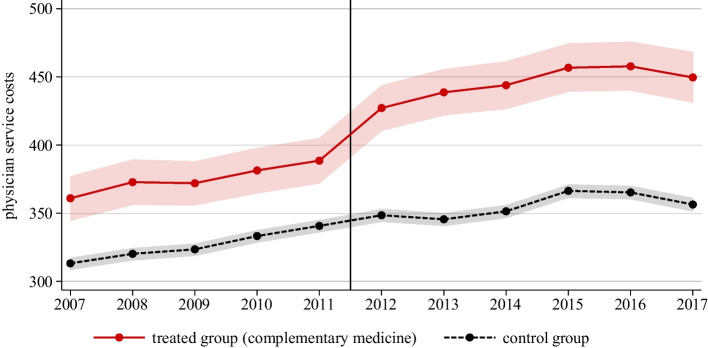
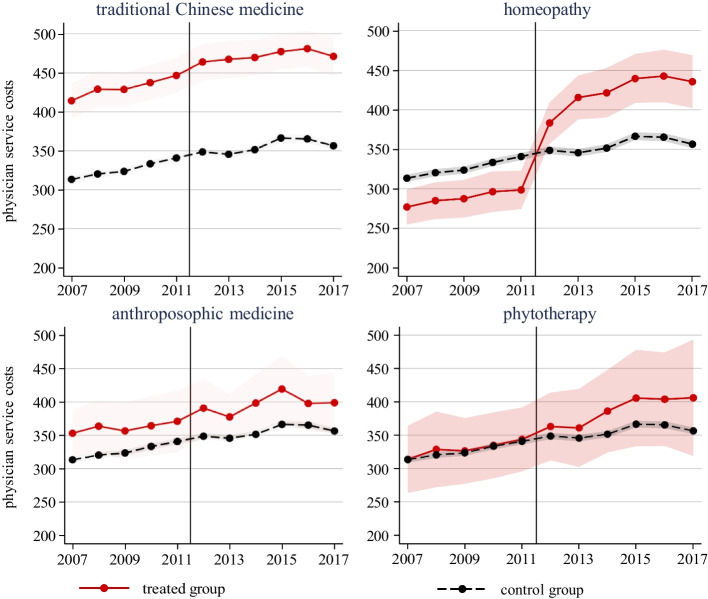
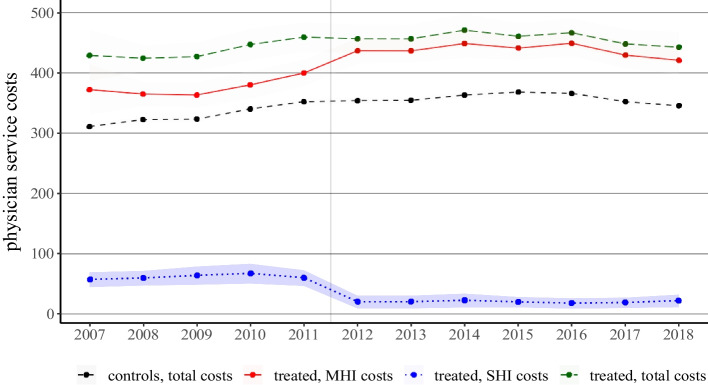
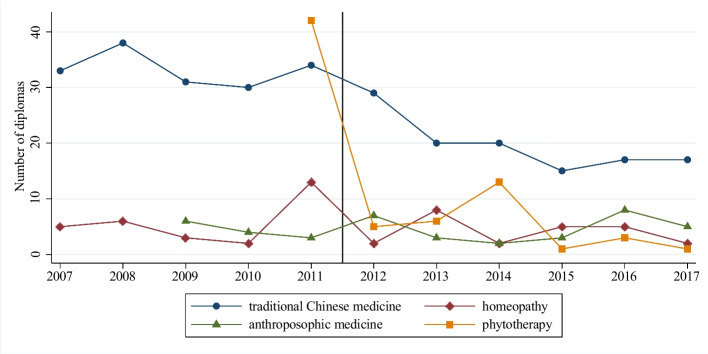
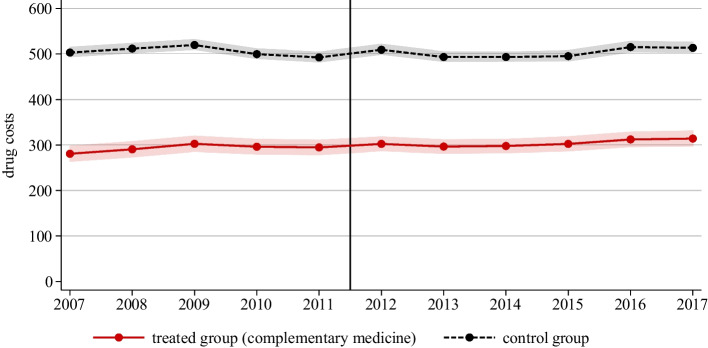
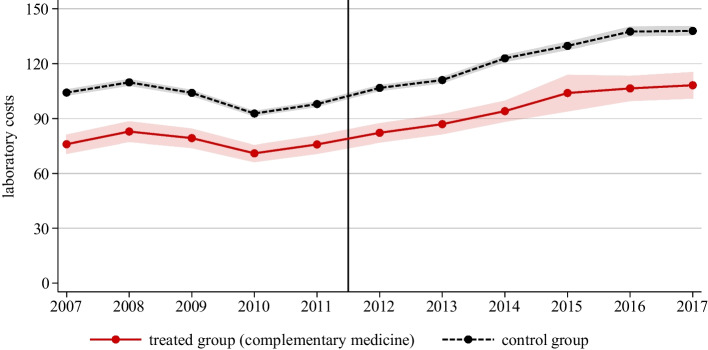
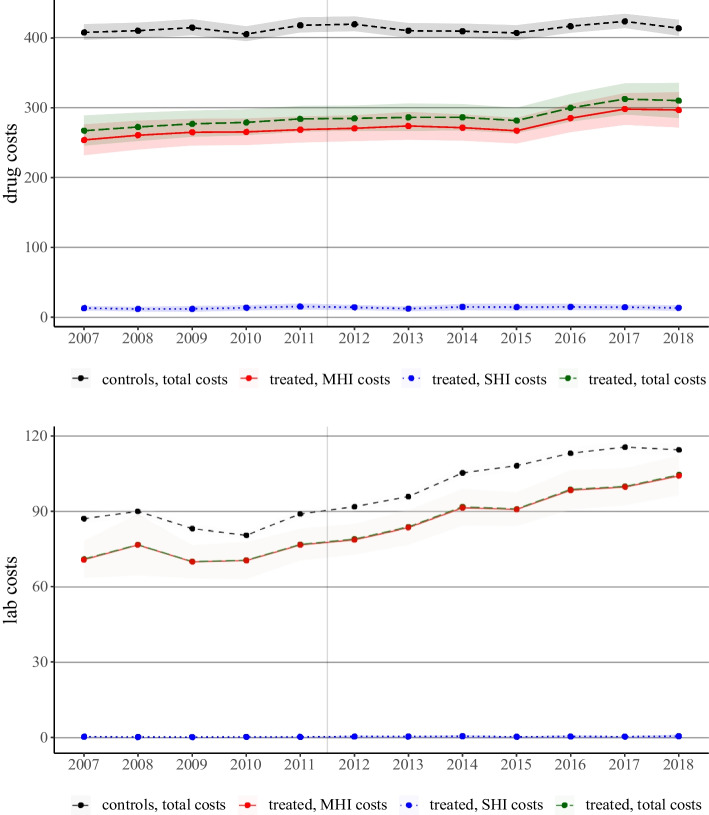
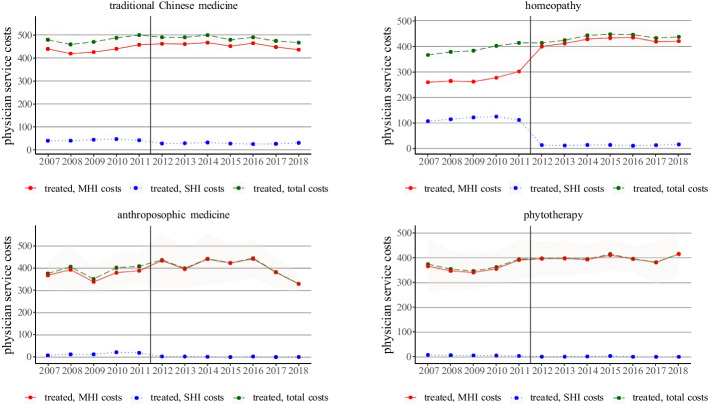
The expansion of public health insurance programs affects payers as well as the behavior of service providers. In this paper, we study the expansion of Swiss mandatory health insurance in 2012 to include complementary and alternative medicine physician services. The policy change provides a quasi-experimental design that allows us to estimate the causal effects on the payer and physician behavior using a difference-in-differences framework. First, we find that from the payer's perspective, expanding coverage to complementary and alternative medicine increases physician costs per patient by about 7 percent. Second, we find that the increase in physician service costs per patient in mandatory health insurance is almost exactly offset by a decrease in supplementary health insurance costs. Thus, suggesting that the behavior of physicians was unchanged by the coverage expansion.
Keywords: Complementary Medicine; Coverage Expansion; Difference-in-Differences; Health Care Costs; Mandatory Health Insurance; Physician Behaviour.
© 2025. The Author(s).
Conflict of interest statement
Declarations. Competing interests: The authors have no competing interests to declare that are relevant to the content of this article.
Figures
Similar articles
-
Prescription of Controlled Substances: Benefits and Risks.2025 Jul 6. In: StatPearls [Internet]. Treasure Island (FL): StatPearls Publishing; 2025 Jan–. 2025 Jul 6. In: StatPearls [Internet]. Treasure Island (FL): StatPearls Publishing; 2025 Jan–. PMID: 30726003 Free Books & Documents.
-
Physician anaesthetists versus non-physician providers of anaesthesia for surgical patients.Cochrane Database Syst Rev. 2014 Jul 11;2014(7):CD010357. doi: 10.1002/14651858.CD010357.pub2. Cochrane Database Syst Rev. 2014. PMID: 25019298 Free PMC article.
-
Interventions for providers to promote a patient-centred approach in clinical consultations.Cochrane Database Syst Rev. 2012 Dec 12;12(12):CD003267. doi: 10.1002/14651858.CD003267.pub2. Cochrane Database Syst Rev. 2012. PMID: 23235595 Free PMC article.
-
Community First Responders' role in the current and future rural health and care workforce: a mixed-methods study.Health Soc Care Deliv Res. 2024 Jul;12(18):1-101. doi: 10.3310/JYRT8674. Health Soc Care Deliv Res. 2024. PMID: 39054745
-
Sexual Harassment and Prevention Training.2024 Mar 29. In: StatPearls [Internet]. Treasure Island (FL): StatPearls Publishing; 2025 Jan–. 2024 Mar 29. In: StatPearls [Internet]. Treasure Island (FL): StatPearls Publishing; 2025 Jan–. PMID: 36508513 Free Books & Documents.
References
-
- Abadie, A. (2005). Semiparametric difference-in-differences estimators. The Review of Eco- Nomic Studies,72(1), 1–19.
-
- Abraham, J. M., Royalty, A. B., & Drake, C. (2019). The impact of Medicaid expansion on employer provision of health insurance. International Journal of Health Economics and Man- Agement,19, 317–340. - PubMed
-
- Angrist, J. D., & Jörn-Steffen, P. (2008). Mostly harmless econometrics: An empiricist’s companion, Princeton University Press.
-
- Bertrand, M., Duflo, E., & Mullainathan, S. (2004). How much should we trust differences-in-differences estimates? The Quarterly Journal of Economics,119(1), 249–275.
-
- Bischof, T., & Kaiser, B. (2021). Who cares when you close down? The effects of primary care practice closures on patients. Health Economics,30(9), 2004–2025. - PubMed
LinkOut - more resources
Full Text Sources