. 2025 Jun 3;97(21):10999-11006.
doi: 10.1021/acs.analchem.4c05990. Epub 2025 May 16.

Derivation of Particle Number Concentration from the Size Distribution: Theory and Applications

Affiliations

Derivation of Particle Number Concentration from the Size Distribution: Theory and Applications

Natalia Farkas et al. Anal Chem. .

Abstract

The particle number concentration (PNC) in a suspension is a key measurand in nanotechnology. A common approach for deriving PNC is to divide the total mass concentration by the per-particle mass, calculated as density times volume. The volume is most frequently derived from the arithmetic mean diameter (AMD) of the size distribution. The harmonic mean volume (HMV) has also been used. Given a known size distribution, we show that the correct PNC is obtained by using the arithmetic mean volume (AMV). The AMD-based volume results in an overestimate in PNC that increases superlinearly with increasing coefficient of variation (CV), reaching 12% at CV = 0.2 for a normal distribution. HMV would yield a much greater overestimate, exceeding 50%. The error in the AMD-derived PNC shows only weak skew dependence, suggesting a simple approximate correction as a function of CV in the common situation where AMD and CV are known but the overall size distribution is unknown. Using published data sets of gold nanoparticles, we demonstrate an overall consistency of ±1.1% in comparing the PNC directly determined by single-particle inductively coupled plasma-mass spectrometry (spICP-MS) and the PNCs derived from AMV using size distributions independently measured by high-resolution scanning electron microscopy and spICP-MS. We further compare AMV and AMD-derived PNCs for well-characterized polystyrene nanoparticle standards, illustrating sensitivity to distributional characteristics along with common errors to avoid. Nanoparticles in environmental samples, food additives, and nanomedicines often have CVs greater than 0.3, for which uncorrected AMD-derived PNC errors can exceed 35%.


Figures
1
1
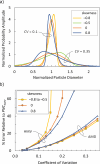
(a) Representative PDF curves used for demonstrating the effects of using different ways of calculating the mean volume of a particle size distribution for deriving PNC from TMC. The PDF curves are generated from the skew normal function with the skew parameter set to −3, 0, or 3, and the location and scale parameters adjusted such that the mean particle diameter is one and the CVs are the selected values. (b) PNC errors relative to PNCAMV as a function of the CV and skewness of the particle size distribution, based on using either the HMV or the volume derived from the AMD.
2
2
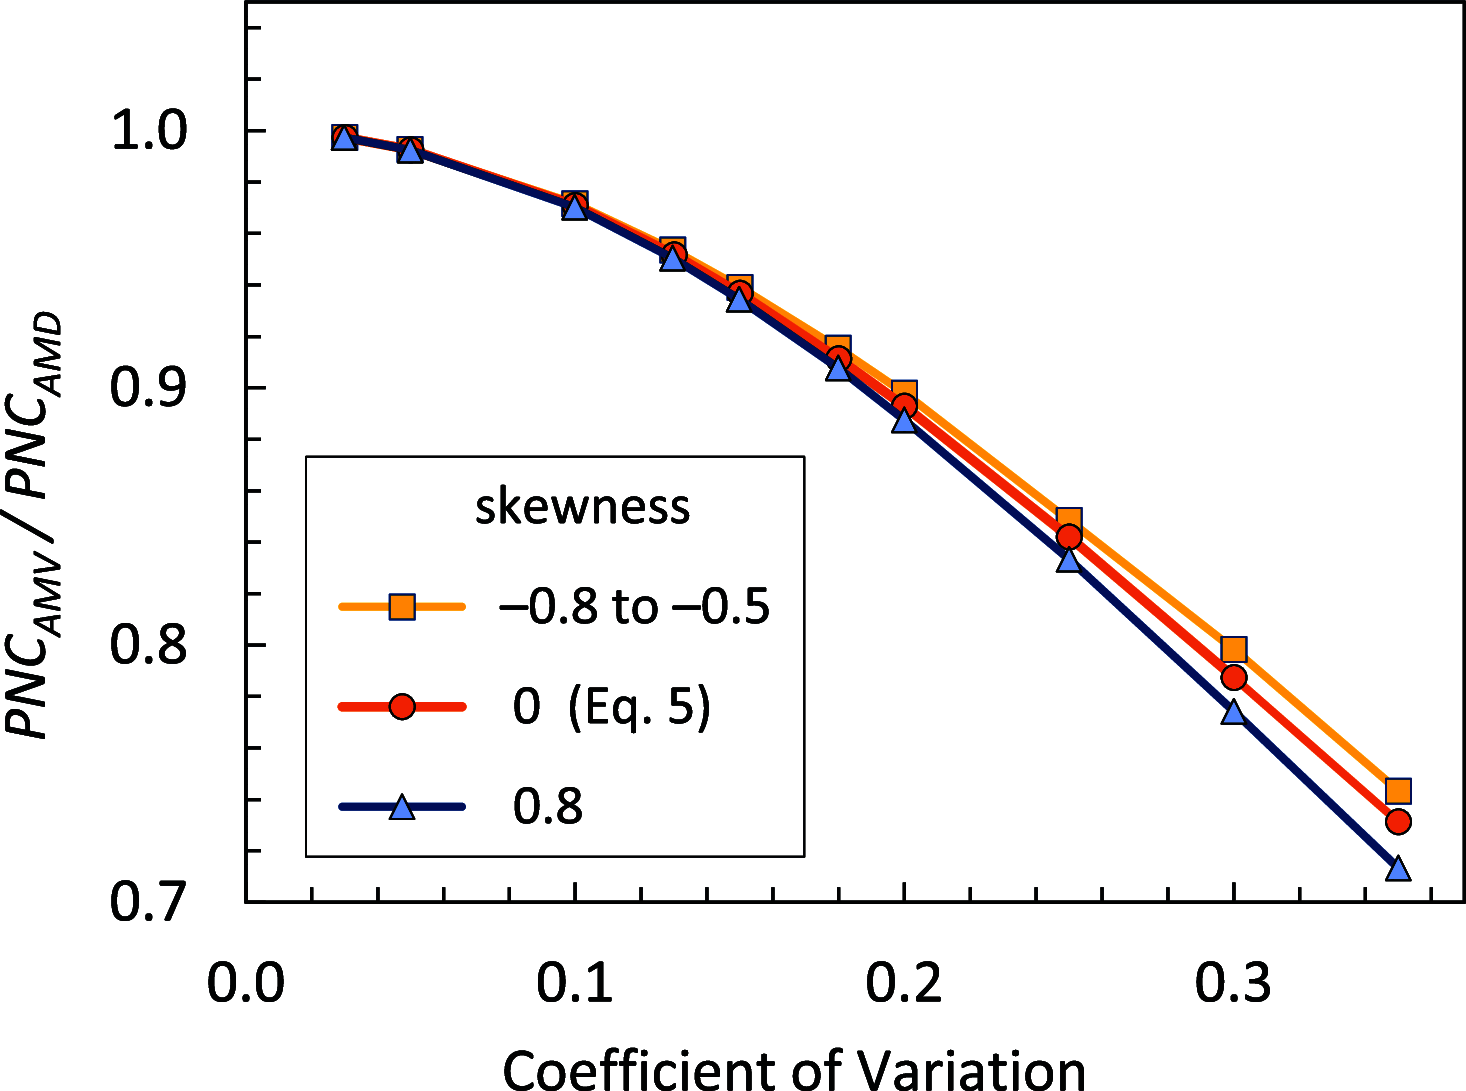
Correction factors for converting PNCAMD to PNCAMV for normal distributions and skew-normal distributions with skew parameters of ±3. The normal distribution (skew = 0) curve is a plot of κ from eq .
3
3
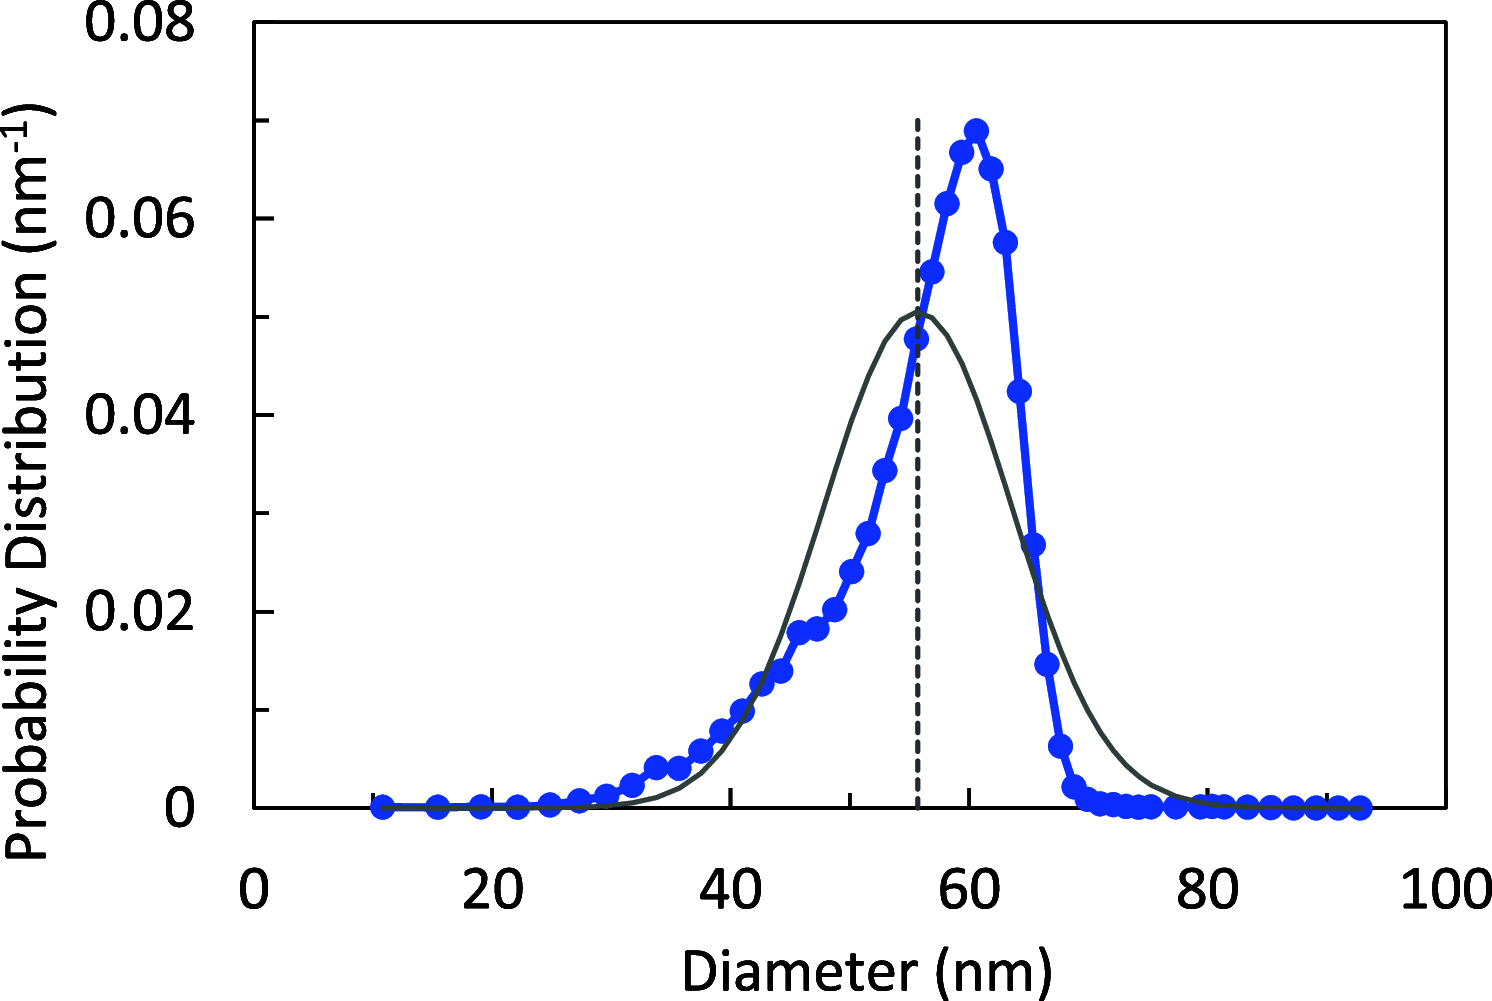
SRM 1964 size probability distribution function (blue circles). The mean diameter is indicated by the dashed line. The solid gray line is a normal distribution constructed from the numerical mean diameter and standard deviation calculated from the size distribution data. The PNCAMV calculated from these two distributions is the same to within 0.3%.
4
4
Plot of the relative deviations of PNCdirect and PNCAMV derived from spICP-MS and HR-SEM size distribution measurements with respect to the combined value, PNCavg , for a set of gold nanoparticle samples. Uncertainty bars represent 1σ measurement repeatability, as in Table . Green boxes represent ±σ for the average of the three component values to guide the eye.
5
5
SiO2 particle size distribution as received from the manufacturer, measured by spICP-MS after suspension in water (data replotted from ref ).

Similar articles

References

    1. Kah M., Tufenkji N., White J. C.. Nano-enabled strategies to enhance crop nutrition and protection. Nat. Nanotechnol. 2019;14(6):532–540. doi: 10.1038/s41565-019-0439-5. - DOI - PubMed
    1. Besinis A., De Peralta T., Tredwin C. J., Handy R. D.. Review of Nanomaterials in Dentistry: Interactions with the Oral Microenvironment, Clinical Applications, Hazards, and Benefits. ACS Nano. 2015;9(3):2255–2289. doi: 10.1021/nn505015e. - DOI - PubMed
    1. Petersen E. J., Pinto R. A., Shi X. Y., Huang Q. G.. Impact of size and sorption on degradation of trichloroethylene and polychlorinated biphenyls by nano-scale zerovalent iron. J. Hazard. Mater. 2012;243:73–79. doi: 10.1016/j.jhazmat.2012.09.070. - DOI - PubMed
    1. Simon C. G., Borgos S. E., Calzolai L., Nelson B. C., Parot J., Petersen E. J., Roesslein M., Xu X., Caputo F.. Orthogonal and complementary measurements of properties of drug products containing nanomaterials. J. Controlled Release. 2023;354:120–127. doi: 10.1016/j.jconrel.2022.12.049. - DOI - PubMed
    1. FDA . Drug Products, Including Biological Products, that Contain Nanomaterials: Guidance for Industry, 2022. - PMC - PubMed

LinkOut - more resources