. 2025 May 16;11(20):eadr3673.
doi: 10.1126/sciadv.adr3673. Epub 2025 May 16.

Nucleosomes represent a crucial target for the intra-S phase checkpoint in response to replication stress

Affiliations

Nucleosomes represent a crucial target for the intra-S phase checkpoint in response to replication stress

Xiaoqin Liu et al. Sci Adv. .

Abstract

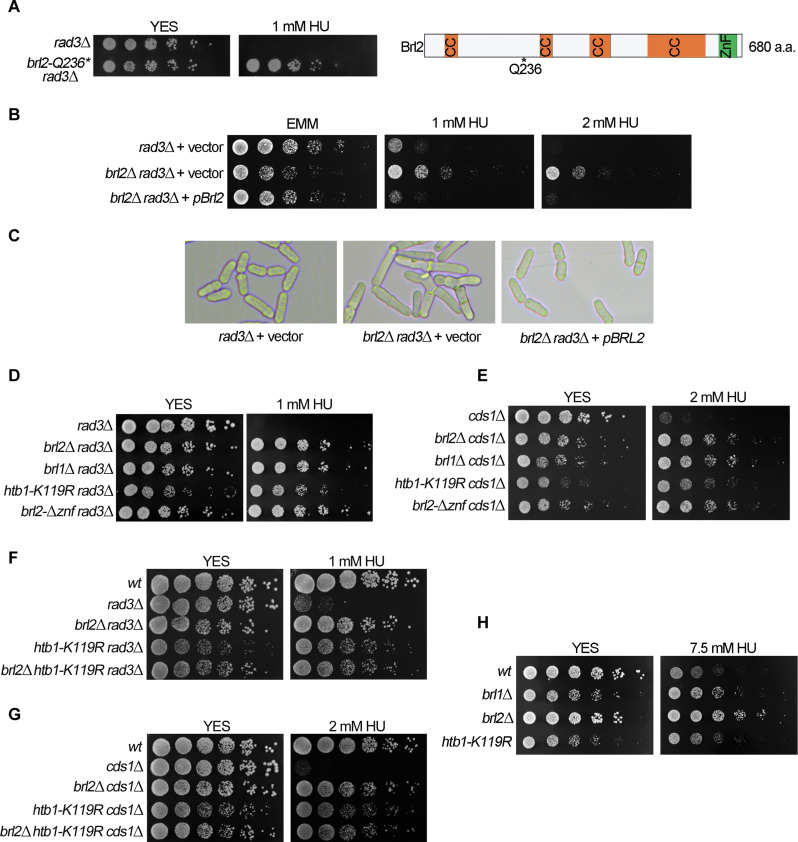
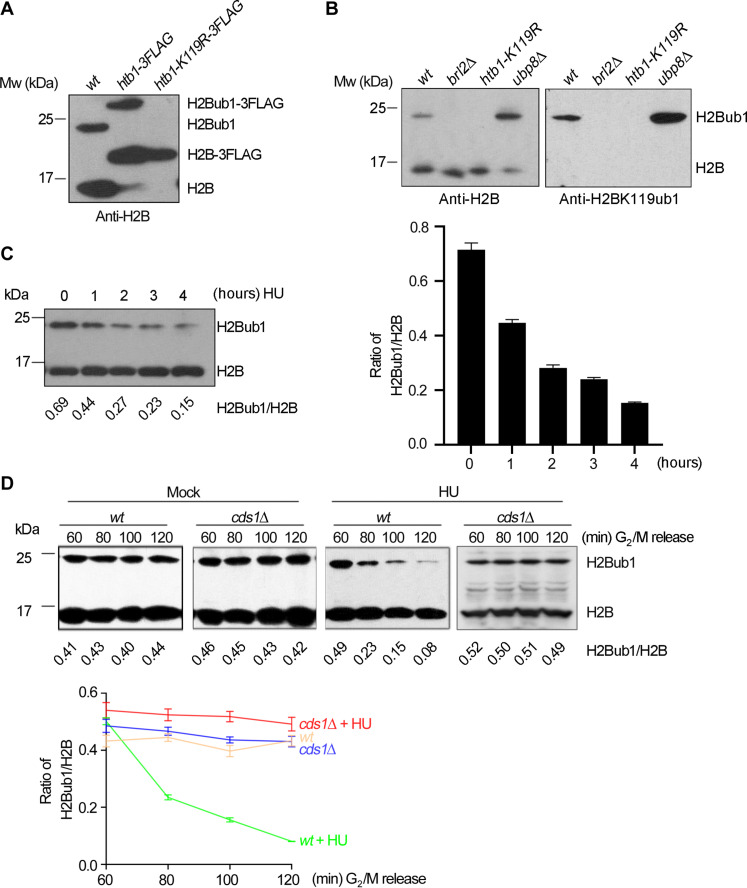
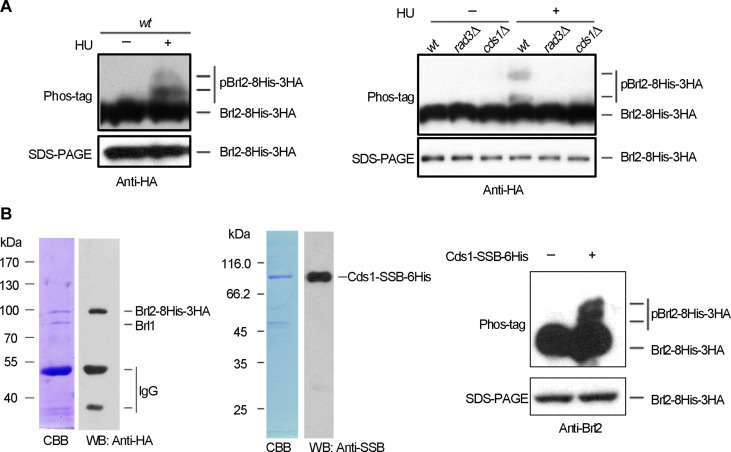
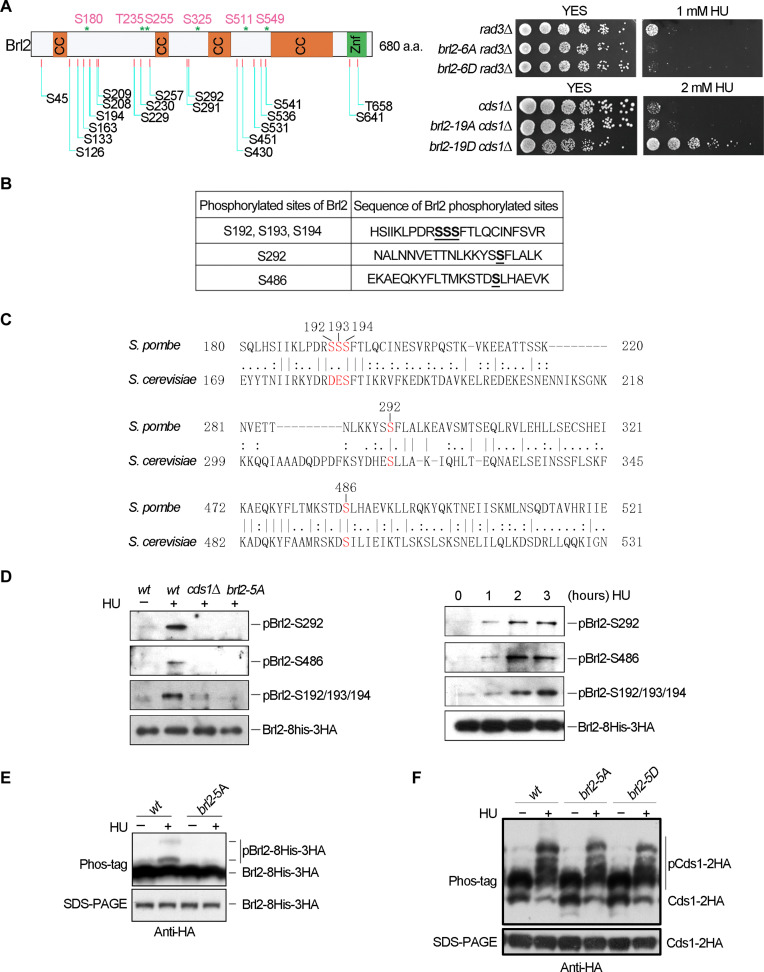
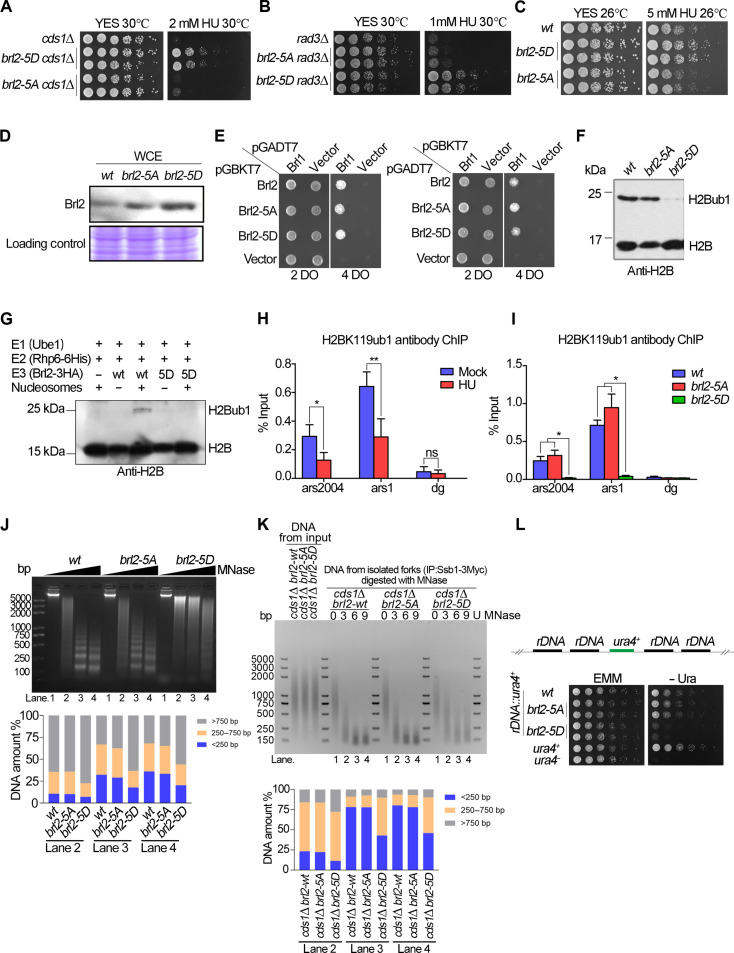
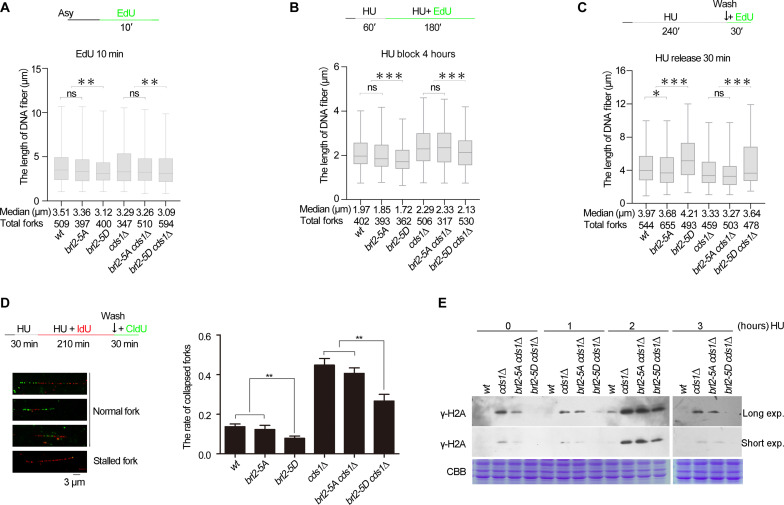
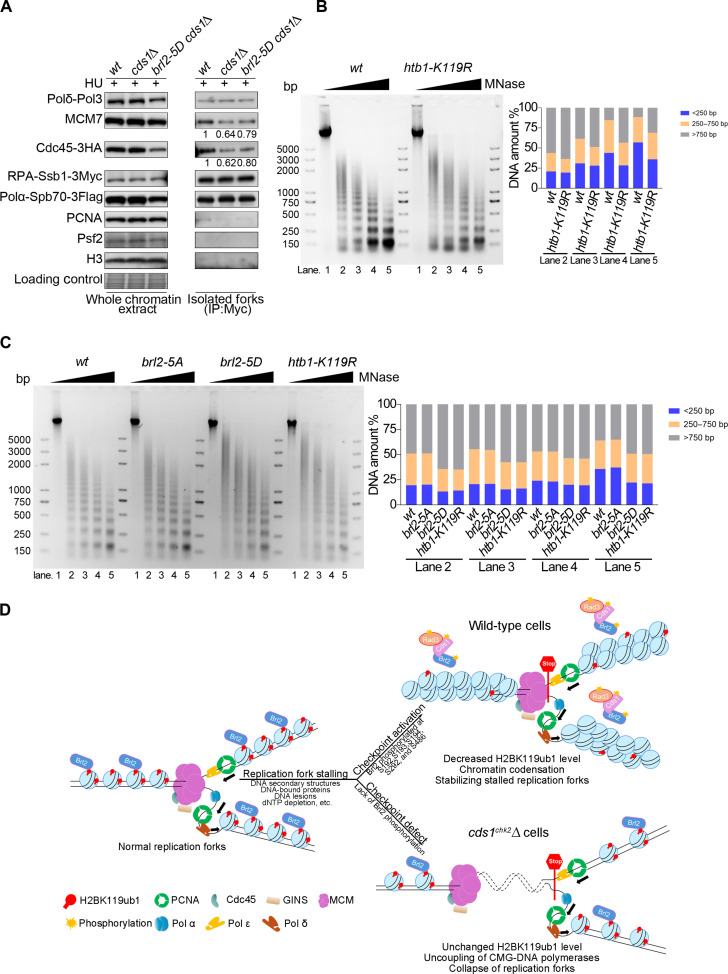
The intra-S phase checkpoint is essential for stability of stalled DNA replication forks. However, the mechanisms underlying checkpoint regulation remain poorly understood. This study identifies a critical checkpoint target-the ubiquitin E3 ligase Brl2, revealing a new dimension of checkpoint regulation. Upon replication fork stalling, Brl2 undergoes phosphorylation at five serine residues by Cds1Chk2 kinase, resulting in the loss of its ligase activity and a marked reduction in H2BK119ub1 levels. In the brl2-5D (the five serine residues are replaced with aspartic acid) and htb-K119R mutants, chromatin becomes highly compacted. Furthermore, the rates of stalled replication fork collapse, and dsDNA breaks are significantly reduced in brl2-5D cds1Chk2∆ cells compared to cds1Chk2∆ cells. Thus, this study demonstrates that nucleosomes are targeted by the intra-S phase checkpoint and highlights the checkpoint's critical role in configuring compact chromatin structures at replication fork stalling sites. These findings may explain why ATR and Chk1 are essential for cell proliferation and embryonic development, while ATM is not.


Figures

Fig. 1.
Fig. 1.. Loss of Brl2 markedly suppresses the HU sensitivity of wt, rad3ATR∆, and cds1Chk2 cells.
(A) The brl2-Q236* mutation markedly reduces the HU sensitivity of rad3ATR cells. Left: Fivefold serial dilution assay was performed to examine the HU sensitivity of rad3ATR cells and brl2-Q236* rad3ATR cells. Right: A schematic diagram showing the domain structure of Brl2. Location of mutant residue found in a screening experiment is indicated by an asterisk *, stop codon; CC, coiled-coil domain; ZnF, zinc finger domain; a.a., amino acid. (B) Fivefold serial dilution assay was performed to examine the HU sensitivity of rad3ATR, brl2∆ rad3ATR cells in the presence or absence of Brl2 expression. The indicated cells carrying a control empty plasmid (vector) or a plasmid expressing the brl2 gene under the control of the nmt1 promoter (pBRL2) were assayed on EMM containing different concentrations of HU. (C) Cell morphology. The indicated cells harboring a control empty plasmid or a plasmid expressing the brl2 gene were grown in EHAL medium lacking thiamine for 16 hours at 30°C and directly imaged. (D to H) HU sensitivity of the rad3∆, brl2∆ rad3∆, brl1∆ rad3∆, htb1-K119R rad3∆, brl2-∆znf rad3∆, cds1Chk2, brl2∆ cds1Chk2, brl1∆ cds1Chk2, htb1-K119R cds1Chk2, brl2-∆znf cds1Chk2, brl1∆, brl2∆, htb1-K119R, brl2∆ htb1-K119R rad3∆, brl2∆ htb1-K119R cds1Chk2, and wt cells. The strains were examined using a fivefold serial dilution assay, and plates were incubated at 30°C for 3 to 4 days. HU concentrations are indicated above each image.
Fig. 2.
Fig. 2.. The level of H2BK119ub1 is remarkably down-regulated by HU treatment.
(A and B) The antibody against H2B is effective to probe the H2B protein and its ubiquitination on K119. (A) Anti-H2B Western blots on the whole cell extracts (WCEs) prepared from an untagged strain (wt) and the tagged strains (htb1-3FLAG and htb1-K119R-3FLAG). (B) WCEs from wt, brl2∆, htb1-K119R, and ubp8∆ were probed with anti-H2B and anti-H2BK119ub1. Bands corresponding to H2B and H2Bub1 are indicated on the right, and the molecular marker is shown on the left. (C) Western blot quantification of the ratio of ubiquitinated H2B to H2B level after HU treatment. Left: wt cells were treated with 12.5 mM HU or not, and aliquots were taken at the indicated times. WCEs were prepared and probed with anti-H2B. The band intensity was quantified by the imageJ software (National Institutes of Health, Bethesda, MD, USA). The ratio of the H2Bub1 level to H2B level at each time point was calculated. Right: A statistical analysis of the ratio of the H2Bub1 level to H2B level at each time point after HU treatment. (D) WCEs with HU treatment or not were analyzed by Western blot analysis using antibody against H2B. Top: wt (cdc25-22) and cds1Chk2cdc25-22 cells were blocked for 3 hours at 36.5°C and then shifted to 26°C in the presence or absence of 12.5 mM HU. Cells were harvested at the indicated time after G2/M release. Bottom: A statistical analysis of the ratio of H2Bub1/H2B versus the time of HU treatment after G2/M release. Mw, molecular weight.
Fig. 3.
Fig. 3.. Cds1Chk2 regulates Brl2 phosphorylation in vivo and in vitro.
(A) The WCEs from wt, rad3ATR, and cds1Chk2 cells with or without HU treatment were separated by 25 μM Phos-tag SDS-PAGE to detect the phosphorylated shift with anti-HA (Brl2 is tagged with 8His and 3HA). (B) Cds1Chk2 phosphorylates Brl2 in vitro. Left and middle: Brl2-8His-3HA and Cds1-SSB-6His were purified to homogeneity. The brl2-8his-3HA was integrated into the S. pombe brl2 locus to express Brl2-8His-3HA under the control of the native brl2 promoter. Brl2-8His-3HA was purified to apparent homogeneity by Ni-NTA chromatography and using HA beads. Cds1-SSB-6His was overexpressed under the nmt1 promoter in S. pombe cells with HU treatment to ensure its activity and purified by ammonium sulfate precipitation and Ni-NTA chromatography. Right: Cds1-catalyzed phosphorylation of Brl2 was performed at 37°C for 25 min with or without kinase Cds1-SSB-6His. The products were detected by 25 μM Phos-tag SDS-PAGE and immunoblotted using anti-Brl2. IgG, immunoglobulin G. CBB, Coomassie Brilliant Blue; WB, Western blot.
Fig. 4.
Fig. 4.. Cds1Chk2 phosphorylates Brl2 on five serine residues in response to replication fork stalling.
(A) Left: Distribution of 6 Rad3 targeted SQ/TQ motifs (top) and 19 Cds1 targeted RxxS/T cluster domains (bottom). Right: HU sensitivity of the indicated strains was examined by fivefold serial dilution assays in the presence or absence of HU. The 6 Rad3ATR-targeted or 19 Cds1Chk2-targeted serine and threonine residues were all mutated to either alanine (brl2-6A or brl2-19A) or aspartic acid (brl2-6D or brl2-19D). Cells in the log phase were serially diluted, plated on YES plates containing 1 mM HU or no HU, incubated at 30°C for 4 days, and imaged. (B) Cds1Chk2 phosphorylates Brl2 on S192, S193, S194, S292, and S486 in response to replication fork stalling. Brl2 was isolated from HU-treated cells and subjected to MS analysis. MS analysis was also performed with Brl2 phosphorylated by Cds1Chk2 in vitro. (C) The amino acid sequences around the five Cds1Chk2-phosphorylated serine residues are shown. (D) Phosphorylation of Brl2 on S192, S193, S194, S292, and S486 in response to replication fork stalling induced by HU. Left: Western blot analysis of Brl2 phosphorylation at S192, S193, S194, S292, and S486 sites in wt, cds1Chk2, and brl2-5A (the five serine residues were all mutated to alanine) cells with HU treatment. Right: Western blot analysis of Brl2 phosphorylation at 192, 193, 194, 292, and 486 sites at different time points in HU-treated wt cells. (E) WCEs from wt and brl2-5A with HU treatment or not were separated by 25 μM Phos-tag SDS-PAGE (top) and SDS-PAGE (bottom) and then probed with anti-HA. (F) Cds1-2HA was isolated from wt, brl2-5A, and brl2-5D (the five serine residues were all mutated to aspartic acid) and separated by 25 μM Phos-tag SDS-PAGE (top) and SDS-PAGE (bottom), followed by immunoblotting analysis with the antibody against HA.
Fig. 5.
Fig. 5.. Cds1Chk2-mediated Brl2 phosphorylation leads to decreased H2BK119ub1 levels and chromatin condensation.
(A to C) The HU sensitivity of indicated cells was measured by fivefold serial dilution assays with indicated HU concentrations and growth temperatures. (D) Western blot analysis of WCEs from wt, brl2-5A, and brl2-5D with anti-Brl2. (E) Yeast two-hybrid assays of measuring the interaction between Brl1 and Brl2-5A or Brl2-5D. These assays were performed on dropout (DO) plates: 4DO (SD-adenine, -histidine, -leucine, and -tryptophan) and 2DO (SD-leucine and -tryptophan). (F) Western blot analysis of WCEs from wt, brl2-5A, and brl2-5D cells with anti-H2B. (G) The in vitro assay of H2B E3 ligase activity of Brl2 and Brl2-5D. (H) ChIP-qPCR analysis of H2BK119ub at ars2004 and ars1 origins in wt cells treated with or without HU. The wt (cdc25-22) cells were blocked for 3 hours at 36.5°C and then shifted to 26°C in the presence or absence of 12.5 mM HU. Cells were harvested at 80 min after G2/M release without HU treatment and 2.5 hours with HU treatment and then analyzed by ChIP-qPCR analysis. (I) ChIP-qPCR analysis of H2BK119ub1 around stalling replication forks at ars2004 and ars1 in wt, brl2-5A, and brl2-5D cells treated with HU. The cells in semi-log phase were treated with 12.5 mM HU at 30°C for 3 hours and then harvested for ChIP-qPCR analysis. The dg locus at centromere region was used as a negative control for H2BK119ub1. The y axis shows the percentage of input recovery. Results are expressed as the mean ± SD. (J) MNase digestion of chromatin from wt, brl2-5A, and brl2-5D cells. (K) MNase digestion of stalled replication forks together with neighboring chromatin that were isolated from the indicated cells. [(J) and (K), bottom] Analysis of relative percentage of different size of DNA fragments. (L) brl2-5D enhances the silencing of rDNA::ura4+ reporter. Fivefold serial dilutions of indicated cells were plated on medium without uracil to monitor rDNA::ura4+ expression.
Fig. 6.
Fig. 6.. The phosphomimic mutation brl2-5D promotes replication fork stability under HU stress.
(A) The medium length of 5-ethynyl-2′-deoxyuridine (EdU)–labeled DNA fibers in the wt and indicated mutant strains under normal cell growth conditions. (B and C) The medium length of EdU-labeled DNA fibers in the wt and indicated mutant strains in the presence of HU and after release from HU treatment. The number of measured DNA fibers is indicated. (D) Dual labeling combing to assess the rate of stalled fork collapse. Left: Schematic of the single-molecule DNA fiber tract analysis for replication fork collapse frequency and the representative IdU tracks (red) during HU block and CldU tracks (green) after HU release. Right: Replication fork collapsed histogram was calculated as the single red DNA fibers divided by all of the fibers containing red signaling. At least 300 fibers were counted in each sample. Statistical test used was the Student’s two-tailed t test, and the P value is indicated by asterisks (**P < 0.005 and ***P < 0.001). (E) The brl2-5D decreased the γ-H2A signal in HU-treated cds1Chk2 cells. The indicated cells were grown to semi-log phase [optical density at 600 nm (OD600) = 0.4], treated with 12.5 mM HU at 30°C, and harvested at the indicated time points. WCEs from cells were resolved by SDS-PAGE and analyzed by Western blot analysis using antibody against γ-H2A. ns, not significant.
Fig. 7.
Fig. 7.. Chromatin condensation promoted by Cds1Chk2-mediated Brl2 phosphorylation prevents the separation of the replication helicase CMG complex from DNA polymerase α or δ.
(A) The phosphomimic brl2-5D mutant prevents the separation of the CMG helicase from DNA polymerases at stalled replication forks. The cells were treated with HU for 3 hours. Formaldehyde cross-linked chromatin was isolated and sonicated to an average size of ∼700 bp. Replication forks were isolated by ChIP with monoclonal anti-Myc antibody against RPA-Ssb1-3Myc. The levels of Pol∆-Pol3, MCM7, Cdc45-3HA, Polα-Spb70-3FLAG, RPA-Ssb1-3Myc, and the indicated proteins in chromatin or isolated replication forks were measured with the corresponding specific antibody. (B) Left: MNase digestion of chromatin in wt and htb1-K119R cells. Right: Analysis of relative percentage of different sizes of DNA fragments. (C) Left: MNase digestion of chromatin in wt, brl2-5A, brl2-5D, and htb1-K119R cells. Right: Analysis of relative percentage of different sizes of DNA fragments. (D) Diagram of the regulation of ubiquitin E3 ligase Brl2 by the intra-S checkpoint pathway to stabilize stalled replication forks. The stalling of the replication fork activates the checkpoint kinase Cds1Chk2. Then, Cds1Chk2 phosphorylates Brl2 at S192, S193, S194, S292, and S486, resulting in a sharp reduction of the H2Bk119ub1 level, which markedly enhances chromatin condensation. Condensed chromatin prevents the uncoupling of the replicative helicase CMG complex from DNA polymerases, which stabilizes stalling replication forks. Black arrow: direction of leading and lagging strand DNA synthesis. dNTP, deoxynucleoside triphosphate.

Similar articles

References

    1. Kornberg R. D., Lorch Y., Twenty-five years of the nucleosome, fundamental particle of the eukaryote chromosome. Cell 98, 285–294 (1999). - PubMed
    1. Passarge E., Emil Heitz and the concept of heterochromatin: Longitudinal chromosome differentiation was recognized fifty years ago. Am. J. Hum. Genet. 31, 106–115 (1979). - PMC - PubMed
    1. Allshire R. C., Madhani H. D., Ten principles of heterochromatin formation and function. Nat. Rev. Mol. Cell Biol. 19, 229–244 (2018). - PMC - PubMed
    1. Strober B. J., Elorbany R., Rhodes K., Krishnan N., Tayeb K., Battle A., Gilad Y., Dynamic genetic regulation of gene expression during cellular differentiation. Science 364, 1287–1290 (2019). - PMC - PubMed
    1. Cardoso-Moreira M., Halbert J., Valloton D., Velten B., Chen C., Shao Y., Liechti A., Ascenção K., Rummel C., Ovchinnikova S., Mazin P. V., Xenarios I., Harshman K., Mort M., Cooper D. N., Sandi C., Soares M. J., Ferreira P. G., Afonso S., Carneiro M., Turner J. M. A., VandeBerg J. L., Fallahshahroudi A., Jensen P., Behr R., Lisgo S., Lindsay S., Khaitovich P., Huber W., Baker J., Anders S., Zhang Y. E., Kaessmann H., Gene expression across mammalian organ development. Nature 571, 505–509 (2019). - PMC - PubMed