. 2025 May 16;11(20):eadl3570.
doi: 10.1126/sciadv.adl3570. Epub 2025 May 16.

Dynamics of bacterial operons during genome-wide stresses is influenced by premature terminations and internal promoters

Affiliations

Dynamics of bacterial operons during genome-wide stresses is influenced by premature terminations and internal promoters

Rahul Jagadeesan et al. Sci Adv. .

Abstract

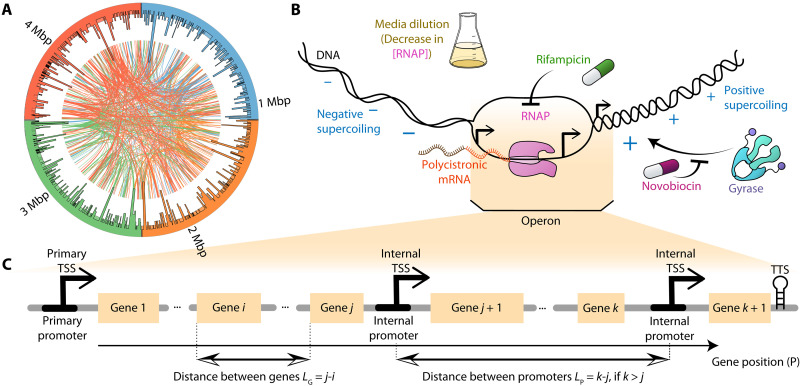
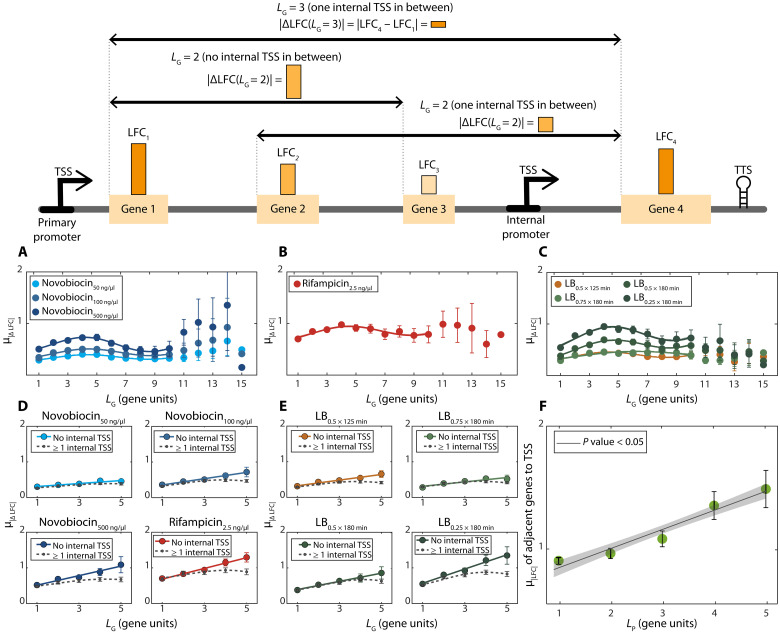
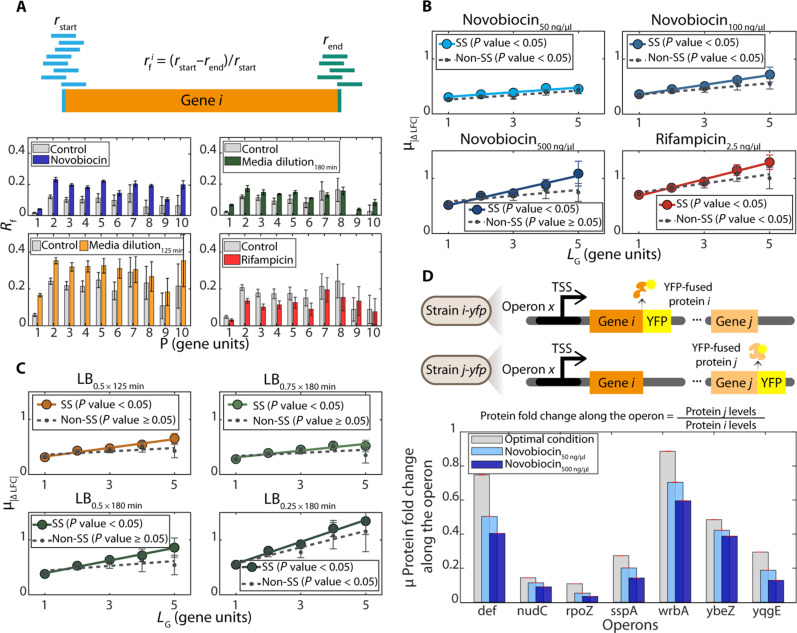
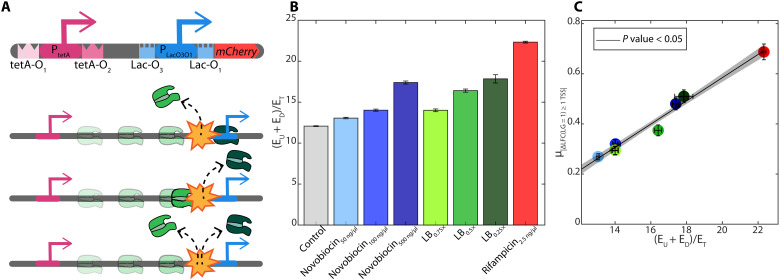
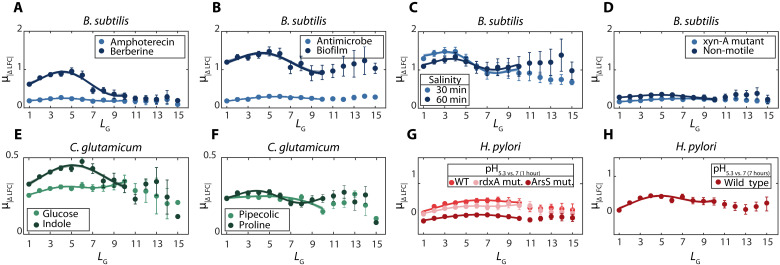
Bacterial gene networks have operons, each coordinating several genes under a primary promoter. Half of the operons in Escherichia coli have been reported to also contain internal promoters. We studied their role during genome-wide stresses targeting key transcription regulators, RNA polymerase (RNAP) and gyrase. Our results suggest that operons' responses are influenced by stress-related changes in premature elongation terminations and internal promoters' activity. Globally, this causes the responses of genes in the same operon to differ with the distance between them in a wave-like pattern. Meanwhile, premature terminations are affected by positive supercoiling buildup, collisions between elongating and promoter-bound RNAPs, and local regulatory elements. We report similar findings in E. coli under other stresses and in evolutionarily distant bacteria Bacillus subtilis, Corynebacterium glutamicum, and Helicobacter pylori. Our results suggest that the strength, number, and positioning of operons' internal promoters might have evolved to compensate for premature terminations, providing distal genes similar response strengths.


Figures

Fig. 1.
Fig. 1.. Illustrative summary of our study of the dynamics of operons during genome-wide stresses.
(A) Illustration of the location of operons in the DNA was constructed using Circos. The external histogram shows the nucleotide length of each operon. Each curved line is a TF interaction between a gene in an operon and another gene. Colors of individual genes are DNA location based to facilitate distinguishing interactions. (B) Illustration of the three transcription-related, genome-wide stresses studied, specifically caused by media dilution (which reduces RNAP concentration), rifampicin (which blocks RNAP activity), and novobiocin (which inhibits gyrase activity), respectively. Positive and negative signs illustrate the accumulation of positive and negative supercoiling downstream and upstream the RNAP, respectively. (C) Illustration of the structural features of operons here considered. Shown are gene positions, P, (used to label genes) and the distances between genes in the same operon, LG. Also shown are the distances, LP, between consecutive promoters (specifically, between their TSSs). Here, if k is not larger than j, LP = 0. All distances and positionings are measured in gene units. Last, a TTS is illustrated at the most downstream location of the operon.
Fig. 2.
Fig. 2.. Average absolute differences in the response strengths of genes in the same operon (μ|ΔLFC|) as a function of the distance between genes, LG.
Data from all E. coli’s 833 operons. Top, illustration of data used in (A to F). Primary and internal promoters (TSSs shown) in operons respond to genome-wide stresses, while premature elongation terminations decrease responsiveness. Mean differences in between genes responses, μ|ΔLFC|, should first increase with LG due to premature terminations but then decrease as internal promoters enhance downstream responses. (A) to (F) show corresponding empirical data. (A) Novobiocin-based stresses. (B) Rifampicin-based stresses. (C) Shifts in RNAP concentration due to shifting media richness. [(A) to (C)] μ|ΔLFC| from all pairs of genes in the same operon versus LG. Error bars are the SEM. Best fits are of the form of Eq. 1. Table S1 shows fitting parameter and coefficient of determination (R2) values. [(D) and (E)] Average absolute difference between LFCs of genes in same operon (μ|ΔLFC|) with and without internal TSSs in between (dotted and solid lines, respectively). Data only for LG < 6 as the number of pairs of genes without TSSs for LG > 5 is too small. See table S7 for the best fitting parameter values. (F) Average absolute response strengths, μ|LFC|, of genes adjacent (downstream) to TSSs, plotted against the distance (in genes) from their TSS to the nearest downstream TSS in the same operon, i.e., LP (illustrated in Fig. 1C). In (A), (B), (C), and (F), the shadow areas are the 95% confidence intervals (not visible in most cases). In (D) and (E), the dashed lines correspond to the cases (≥1 TSS). In (D) to (F), we also show best linear fits, along with their P values (Materials and Methods section Statistical tests).
Fig. 3.
Fig. 3.. Effects of premature terminations on operon’s genome-wide stress responses.
(A) Illustration of raw data used to calculate, rf, which is the difference between numbers of RNA reads from the starting (blue lines) and ending (green lines) regions of a gene, normalized by the former. Below are the corresponding empirical data on genome-wide average values of rf (Rf) as a function of the genes’ position (P), relative to the primary TSS. Error bars are SEs of the sum. (B and C) Average absolute difference between LFCs of genes in same operon (μ|ΔLFC|) with (colored) and without (gray) highly positive supercoiling buildup sensitive (“SS”) genes in between them. Data for LG < 6 since there are not enough pairs of genes without TSSs in between for LG > 5. Solid lines correspond to pairs of genes in operons without internal TSSs. Dotted lines correspond to pairs of genes in operons without internal TSS and with positive supercoiling buildup sensitive (SS) genes. At 50 ng/μl, the responsiveness of genes with and without supercoiling sensitivity cannot be visually distinguished. The P value of each line is from a statistical test of whether the linear fit differs from a horizontal line, using “fitlm” (MATLAB). (D) Illustrated at the top are two strains differing in which gene of the same operon “x” is fused with yellow fluorescent protein (YFP), allowing protein detection by flow cytometry and then comparing levels as a function of positioning (and thus distances) in the same operon (Materials and Methods section Flow cytometry). Only pairs of genes without promoters in between were considered. The graph below shows the empirical data for several operons obtained using the YFP strain library (32). Strains are listed in table S18. Red error bars are the SE of the fold change.
Fig. 4.
Fig. 4.. Synthetic genetic construct carrying two, nonoverlapping promoters in tandem formation.
(A) Illustration of the construct, including their TSSs (arrows) and TF-binding sites (“TetA-O”–binding sites for anhydrotetracycline, aTc, in the case of the upstream promoter, PTetA, and “Lac-O”–binding sites for LacI, in the downstream promoter, PLacO3O1). Also illustrated are the expected possible premature termination events, following collisions between RNAPs elongating from the upstream promoter with RNAPs bound to the downstream promoter. (B) Summed expression levels of the two promoters in single formation relative to the expression of the nonoverlapping promoters in tandem formation for each stress condition and the control. (C) Mean absolute differences in response strength between pairs of genes with one internal TSS in between [μLFC|(LG = 1)≥1 TSS] in each stress condition plotted against the values in (B).
Fig. 5.
Fig. 5.. Average absolute differences in response strengths between genes in the same operon (μ|ΔLFC|) as a function of the distance between genes in the same operon, LG, in B. subtilis, C. glutamicum, and H. pylori.
Data are the μ|ΔLFC| of all pairs of genes of the same operon distanced by LG genes in between. Error bars are the SEM. Also shown are the best fits of functions of the form of Eq. 1. Their R2 values are shown in table S13 to S15 along with the best fitting parameter values. Data from (–52). (A to H) Data from a specific species and conditions, listed in the figures.

Similar articles

References

    1. Okuda S., Yoshizawa A. C., ODB: A database for operon organizations, 2011 update. Nucleic Acids Res. 39, D552–D555 (2011). - PMC - PubMed
    1. Jacob F., Monod J., On the regulation of gene activity. Cold Spring Harb. Symp. Quant. Biol. 26, 193–211 (1961). - PubMed
    1. Browning D. F., Busby S. J. W., The regulation of bacterial transcription initiation. Nat. Rev. Microbiol. 2, 57–65 (2004). - PubMed
    1. McClure W. R., Mechanism and control of transcription initiation in prokaryotes. Annu. Rev. Biochem. 54, 171–204 (1985). - PubMed
    1. Swain P. S., Efficient attenuation of stochasticity in gene expression through post-transcriptional control. J. Mol. Biol. 344, 965–976 (2004). - PubMed

MeSH terms

Substances

LinkOut - more resources