. 2025 May 16;11(20):eadu6722.
doi: 10.1126/sciadv.adu6722. Epub 2025 May 16.

The microRNA OsmiR393 regulates rice brown planthopper resistance by modulating the auxin-ROS signaling cross-talk

Affiliations

The microRNA OsmiR393 regulates rice brown planthopper resistance by modulating the auxin-ROS signaling cross-talk

Lin Zhu et al. Sci Adv. .

Abstract

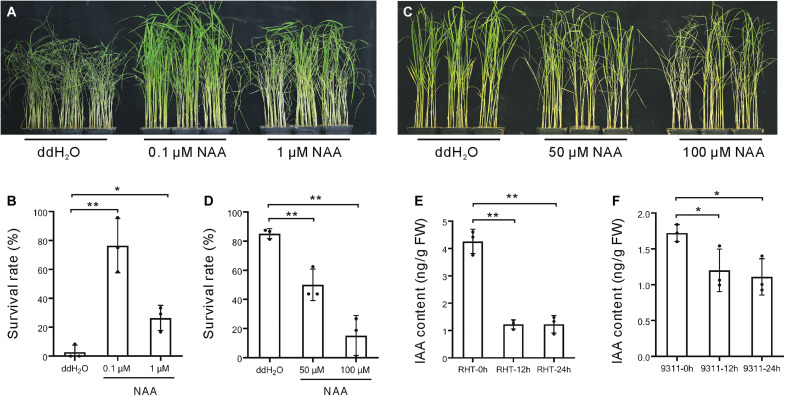
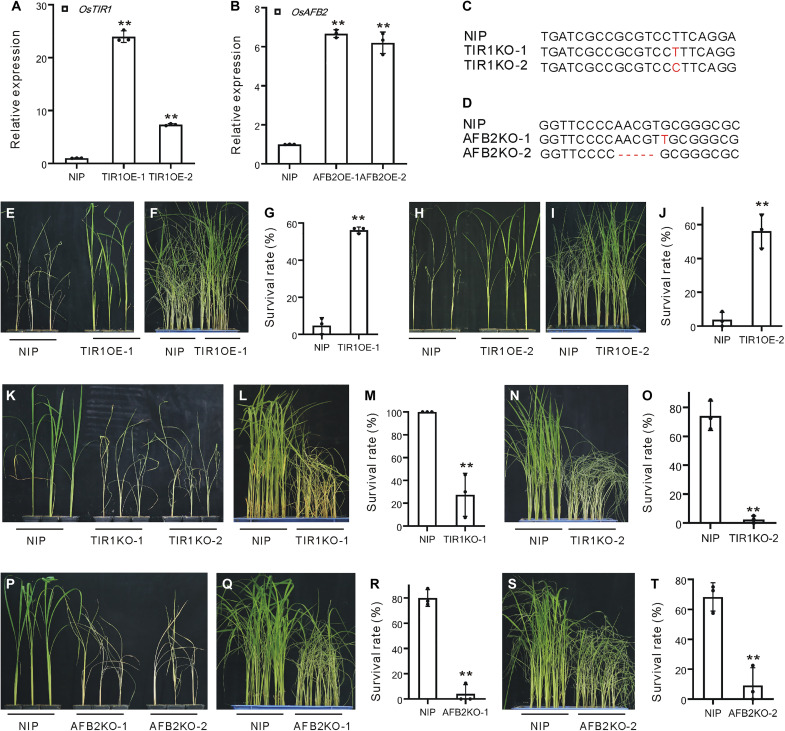
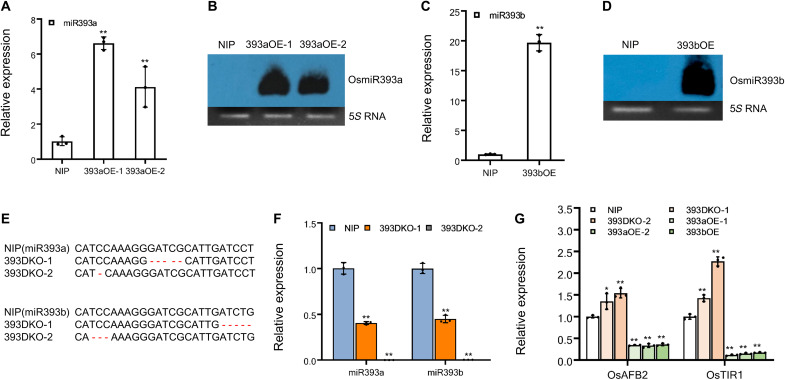
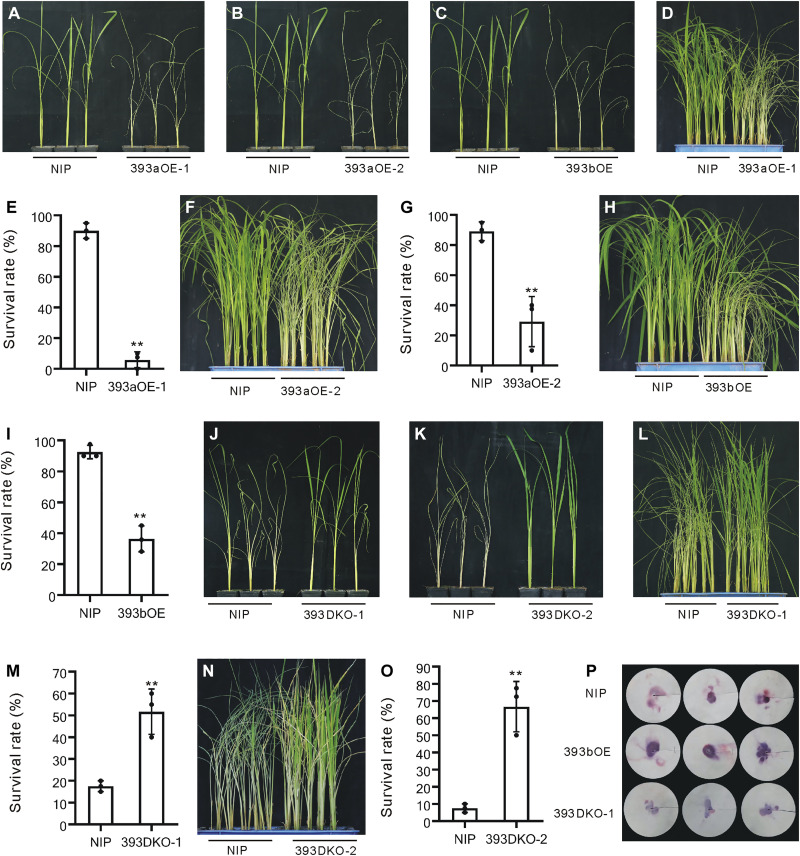
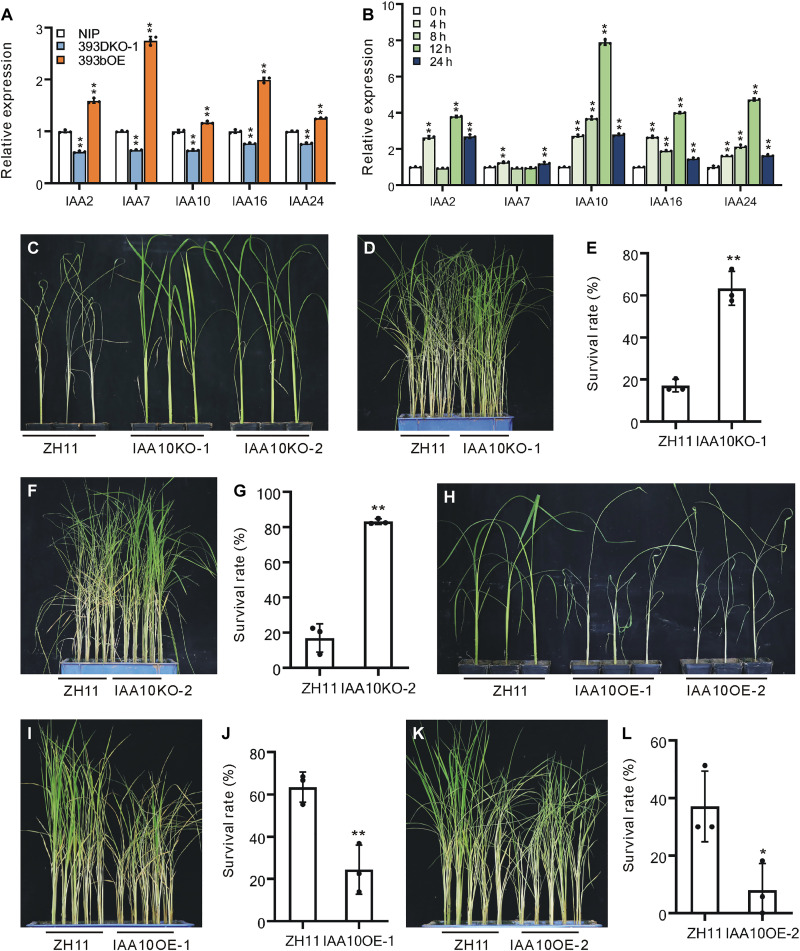
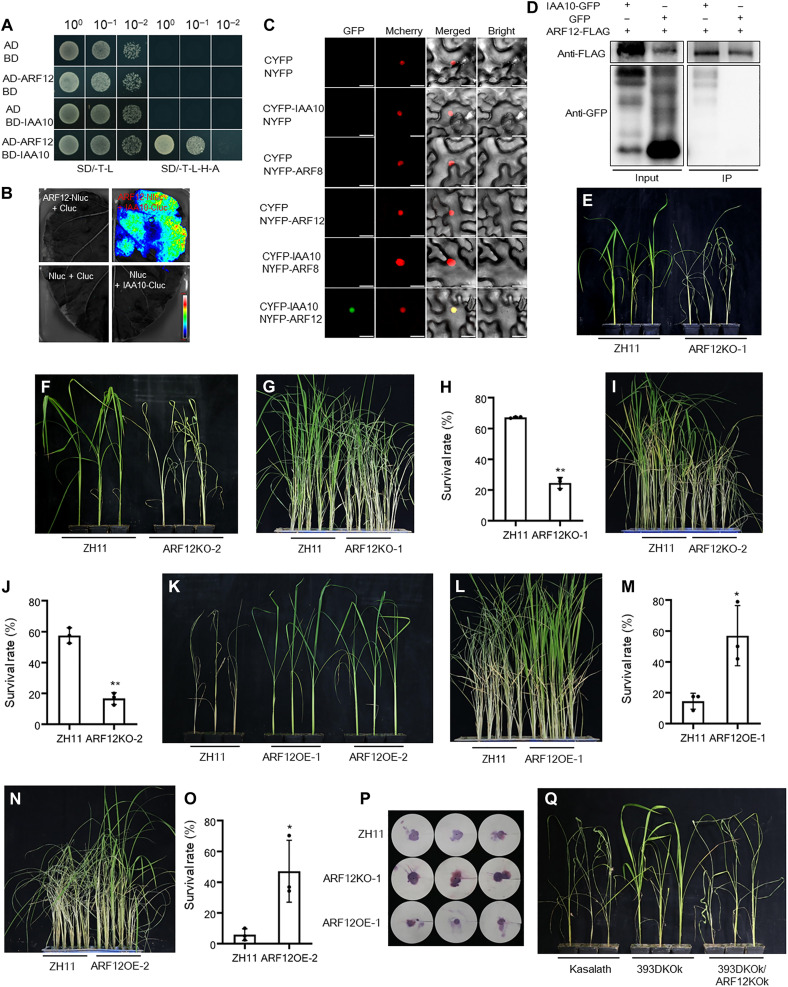
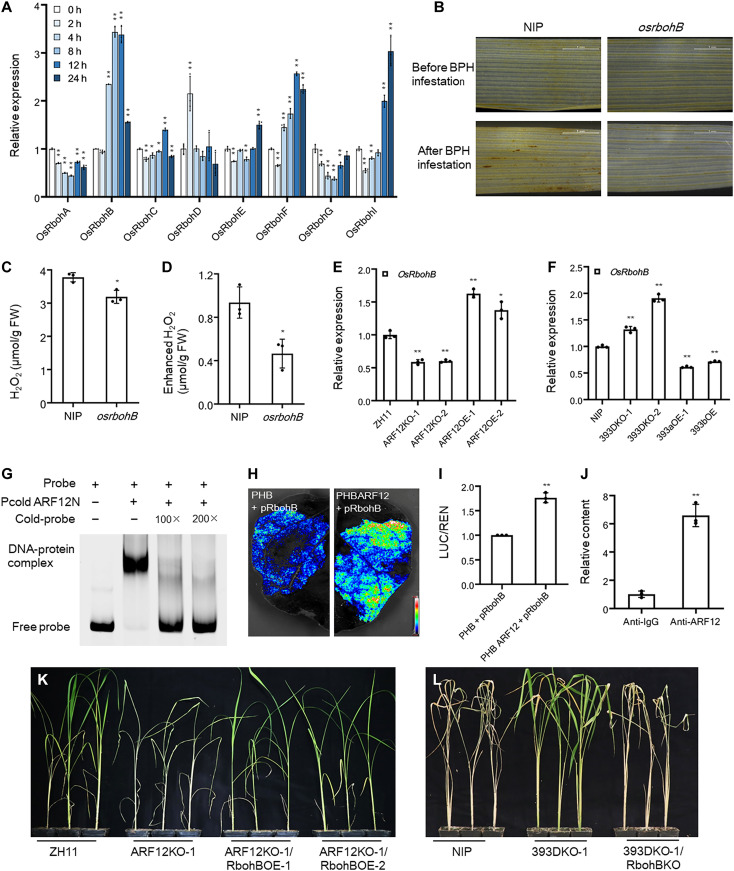
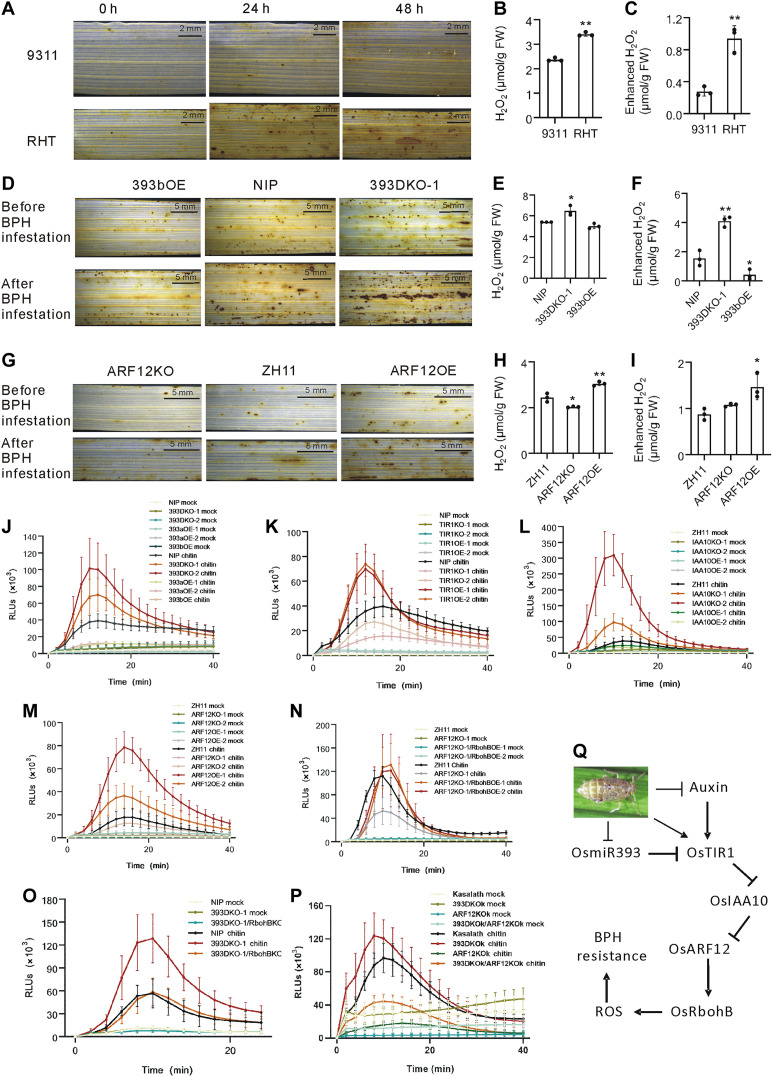
Auxin plays critical roles in plant development and stress response. However, the roles of auxin and the immune signaling factor, reactive oxygen species (ROS), in resistance to the brown planthopper (BPH), a notorious rice-specific piercing-sucking insect that causes severe yield losses, remain unclear. We revealed that moderate naphthalene acetic acid treatment activates rice resistance to BPH, BPH infestation induces ROS accumulation, and increase in ROS content promotes BPH resistance. Underlying these phenomena, the auxin receptors OsTIR1 and OsAFB2 positively, whereas the posttranscriptional regulator OsmiR393 negatively, regulate BPH resistance. Downstream of the OsmiR393/OsTIR1 module, through successive genetic function analysis of each gene, solid genetic relationship analysis, and various biochemical assays, we established an OsmiR393/OsTIR1-OsIAA10-OsARF12-OsRbohB genetic pathway that mediates BPH resistance, in which ROS are integral. Such cross-talk between auxin and ROS reveals the intricate signaling network underlying BPH resistance, which might assist with BPH resistance breeding.


Figures

Fig. 1.
Fig. 1.. Relationship between auxin and BPH infestation in rice.
(A) BPH resistance of the rice plants treated with a low concentration (ddH2O, 0.1 μM, and 1 μM) of NAA (ZH11 plants were used). (B) Survival rates of the plants in (A). Data are means ± SD (n = 3). (C) BPH resistance of the rice plants treated with a high concentration (ddH2O, 50 μM, and 100 μM) of NAA. (D) Survival rates of the plants in (C). Data are means ± SD (n = 3). (E) IAA content before and after BPH infestation in the BPH-resistant rice cultivar RHT. Data are means ± SD (n = 3). (F) IAA content before and after BPH infestation in the BPH-susceptible rice cultivar 9311. Data are means ± SD (n = 3). Student’s t test was carried out in [(B) and (D)] to compare with ddH2O, in (E) to compare with RHT-0h, and in (F) to compare with 9311-0h (*P < 0.05; **P < 0.01). h, hours; FW, fresh weight.
Fig. 2.
Fig. 2.. BPH resistance of the TIR1OE, TIR1KO, and AFB2KO plants.
(A) Expression of OsTIR1 gene in the TIR1OE lines and NIP plants. Data are means ± SD (n = 3). (B) Expression of OsAFB2 gene in the AFB2OE lines and NIP plants. Data are means ± SD (n = 3). (C) Edited sites (marked red) in the OsTIR1 nucleotide sequence for the TIR1KO lines. (D) Edited sites (marked red) in the OsAFB2 nucleotide sequence for the AFB2KO lines. (E) Individual test of the TIR1OE-1 and wild-type (WT) plants. (F) Small population test of the TIR1OE-1 and WT plants. (G) Survival rates of the plants in (F). Data are means ± SD (n = 3). (H) Individual test of the TIR1OE-2 and WT plants. (I) Small population test of the TIR1OE-2 and WT plants. (J) Survival rates of the plants in (I). Data are means ± SD (n = 3). (K) Individual test of the TIR1KO-1, TIR1KO-2, and WT plants. (L) Small population test of the TIR1KO-1 and WT plants. (M) Survival rates of the plants in (L). Data are means ± SD (n = 3). (N) Small population test of the TIR1KO-2 and WT plants. (O) Survival rates of the plants in (N). Data are means ± SD (n = 3). (P) Individual test of the AFB2KO-1, AFB2KO-2 and WT plants. (Q) Small population test of the AFB2KO-1 and WT plants. (R) Survival rates of the plants in (Q). Data are means ± SD (n = 3). (S) Small population test of the AFB2KO-2 and WT plants. (T) Survival rates of the plants in (S). Data are means ± SD (n = 3). Student’s t test was carried out in [(A), (B), (G), (J), (M), (O), (R), and (T)] to compare with NIP, respectively (**P < 0.01).
Fig. 3.
Fig. 3.. Verification and detection of 393aOE, 393bOE, and 393DKO plants.
(A) Stem-loop quantitative reverse transcription polymerase chain reaction (qRT-PCR) miRNA assay of OsmiR393a in the 393aOE and WT plants. Data are means ± SD (n = 3). (B) miRNA Northern blotting of OsmiR393a in the 393aOE and WT plants. (C) Stem-loop qRT-PCR miRNA assay of OsmiR393b in the 393bOE and WT plants. Data are means ± SD (n = 3). (D) miRNA Northern blotting of OsmiR393b in the 393bOE and WT plants. (E) Edited sites (marked red) in the OsmiR393a and OsmiR393b nucleotide sequence for the two lines of 393DKO plants. In 393DKO-1, there is a 70–base pair (bp) deletion in the miR393b genomic region. (F) Stem-loop qRT-PCR miRNA assay of OsmiR393a and OsmiR393b in the 393DKO and WT plants. Data are means ± SD (n = 3). (G) Expression of OsAFB2 and OsTIR1 genes in the 393aOE, 393bOE, 393DKO, and WT plants. Data are means ± SD (n = 3). Student’s t test was carried out in [(A), (C), (F), and (G)] to compare with NIP, respectively (*P < 0.05; **P < 0.01).
Fig. 4.
Fig. 4.. BPH resistance of the 393aOE, 393bOE, and 393DKO plants compared with WT plants.
(A) Individual test of the 393aOE-1 and NIP plants. (B) Individual test of the 393aOE-2 and NIP plants. (C) Individual test of the 393bOE and NIP plants. (D) Small population test of the 393aOE-1 and NIP plants. (E) Survival rates of the plants in (D). Data are means ± SD (n = 3). (F) Small population test of the 393aOE-2 and NIP plants. (G) Survival rates of the plants in (F). Data are means ± SD (n = 3). (H) Small population test of the 393bOE and NIP plants. (I) Survival rates of the plants in (H). Data are means ± SD (n = 3). (J) Individual test of the 393DKO-1 and NIP plants. (K) Individual test of the 393DKO-2 and NIP plants. (L) Small population test of the 393DKO-1 and NIP plants. (M) Survival rates of the plants in (L). Data are means ± SD (n = 3). (N) Small population test of the 393DKO-2 and NIP plants. (O) Survival rates of the plants in (N). Data are means ± SD (n = 3). (P) Honeydew content in the 393bOE, 393DKO-1, and NIP plants after BPH infestation for 48 hours. Honeydew was excreted on filter paper. The size of the honeydew area and the intensity of the honeydew color correspond to the BPH feeding activity. Student’s t test was carried out in [(E), (G), (I), (M), and (O)] to compare with NIP, respectively (**P < 0.01).
Fig. 5.
Fig. 5.. Expression of certain OsIAA genes and genetic function analysis of OsIAA10.
(A) Expression of OsIAA2, OsIAA7, OsIAA10, OsIAA16, and OsIAA24 genes in the 393DKO-1, 393bOE, and WT NIP plants. Data are means ± SD (n = 3). Student’s t test was carried out to compare with NIP (**P < 0.01). (B) Expression of OsIAA2, OsIAA7, OsIAA10, OsIAA16, and OsIAA24 genes upon BPH infestation. Data are means ± SD (n = 3). Student’s t test was carried out to compare with 0 hours (**P < 0.01). (C) Individual test of the IAA10KO-1 and IAA10KO-2 lines and WT ZH11 plants. (D) Small population test of the IAA10KO-1 and WT ZH11 plants. (E) Survival rates of the plants in (D). Data are means ± SD (n = 3). (F) Small population of the IAA10KO-2 and WT ZH11 plants. (G) Survival rates of the plants in (F). Data are means ± SD (n = 3). (H) Individual test of the IAA10OE-1 and IAA10OE-2 lines and WT ZH11 plants. (I) Small population of the IAA10OE-1 and WT ZH11 plants. (J) Survival rates of the plants in (I). Data are means ± SD (n = 3). (K) Small population test of the IAA10OE-2 and ZH11 WT plants. (L) Survival rates of the plants in (K). Data are means ± SD (n = 3). Student’s t test was carried out in [(E), (G), (J), and (L)] to compare with ZH11, respectively (*P < 0.05; **P < 0.01). h, hours.
Fig. 6.
Fig. 6.. Interaction verification of OsIAA10 and OsARF12, and genetic function analysis of OsARF12.
(A) Y2H assay between OsARF12 and OsIAA10 proteins. (B) LCI assay of the interaction between OsARF12 and OsIAA10. (C) BiFC assay of the OsARF12 and OsIAA10 proteins. The couple of OsIAA10 and OsARF8 was used as negative control. Scale bars, 30 μm. (D) Co-immunoprecipitation (Co-IP) assay of the OsARF12 and OsIAA10 proteins. (E) Individual test of the ARF12KO-1 and WT plants. (F) Individual test of the ARF12KO-2 and WT plants. (G) Small population test of the ARF12KO-1 and WT plants. (H) Survival rates of the plants in (G). Data are means ± SD (n = 3). (I) Small population test of the ARF12KO-2 and WT plants. (J) Survival rates of the plants in (I). Data are means ± SD (n = 3). (K) Individual test of the ARF12OE-1, ARF12OE-2, and WT plants. (L) Small population test of the ARF12OE-1 and WT plants. (M) Survival rates of the plants in (L). Data are means ± SD (n = 3). (N) Small population test of the ARF12OE-2 and WT plants. (O) Survival rates of the plants in (N). Data are means ± SD (n = 3). (P) Honeydew content in the ARF12KO-1, ARF12OE-1, and ZH11 plants after BPH infestation for 48 hours. Honeydew was excreted on filter paper. The size of the honeydew area and the intensity of the honeydew color correspond to the BPH feeding activity. (Q) Individual test of Kasalath, 393DKOk, and the 393DKOk/ARF12KOk cross plants. Student’s t test was carried out in [(H), (J), (M), and (O)] to compare with ZH11, respectively (*P < 0.05; **P < 0.01).
Fig. 7.
Fig. 7.. Transcriptional regulation of OsRbohB by OsARF12, genetic function analysis of OsRbohB, and its genetic relationship with OsARF12 and OsmiR393.
(A) Expression of OsRboh genes under BPH infestation. Data are means ± SD (n = 3). Student’s t test was carried out to compare with 0 hours (*P < 0.05; **P < 0.01). (B) 3,3′-Diaminobenzidine (DAB) staining of H2O2 in leaves of the osrbohB mutant and NIP plants before and after BPH infestation. (C) H2O2 content in the osrbohB mutant and NIP plants before BPH infestation. Data are means ± SD (n = 3). (D) Increase in H2O2 content in the osrbohB mutant and NIP plants after BPH infestation. Data are means ± SD (n = 3). (E) Analysis of the mRNA level of OsRbohB in the ARF12OE, ARF12KO, and WT plants. Data are means ± SD (n = 3). (F) Relative abundance of OsRbohB mRNA in the 393aOE-1, 393bOE, 393DKO-1, 393DKO-2, and WT plants. Data are means ± SD (n = 3). (G) EMSA of the N terminus of the OsARF12 (ARF12N, 1 to 247 amino acids) and the promoter of OsRbohB. The promoter region for assay was indicated in fig. S11. (H) Dual-luciferase (LUC) assay of the OsARF12 protein and the promoter region of OsRbohB. (I) LUC/REN ration in (H). Data are means ± SD (n = 3). (J) Chromatin immunoprecipitation (ChIP) assay of ARF12OE plants and the anti-ARF12 antibody and the anti-IgG antibody was used as control. The promoter region for assay was indicated in fig. S11. Data are means ± SD (n = 3). (K) Individual test of the ARF12KO-1/RbphBOE-1, ARF12KO-1/RbohBOE-2, ARF12KO-1, and WT plants. (L) Individual test of the 393DKO-1/RbohBKO, 393DKO-1, and WT plants. Student’s t test was carried out in [(C) to (F), (I), and (J)] (*P < 0.05; **P < 0.01). h, hours.
Fig. 8.
Fig. 8.. ROS content in the OsmiR393/TIR1-OsIAA10-OsARF12–OsRbohB pathway in response to BPH infestation.
(A) DAB staining of RHT and 9311 leaves before and after BPH infestation. (B) H2O2 content in RHT and 9311 plants before BPH infestation. Data are means ± SD (n = 3). (C) Increase in H2O2 content in RHT and 9311 plants after BPH infestation. Data are means ± SD (n = 3). (D) DAB staining of leaves of the 393bOE, 393DKO-1, and WT plants before and after BPH infestation. (E) H2O2 content in the 393bOE, 393DKO-1, and WT plants before BPH infestation. Data are means ± SD (n = 3). (F) Increase in H2O2 content in the 393bOE, 393DKO-1, and WT plants after BPH infestation. Data are means ± SD (n = 3). (G) DAB staining of leaves of the ARF12OE, ARF12KO, and WT rice plants before and after BPH infestation. (H) H2O2 content in the ARF12OE, ARF12KO, and WT plants before BPH infestation. Data are means ± SD (n = 3). (I) Increase in H2O2 content in the ARF12OE, ARF12KO, and WT plants after BPH infestation. Data are means ± SD (n = 3). (J to M) Chitin-induced ROS burst in corresponding plant lines. (N) Chitin-induced ROS burst in the ARF12KO-1/RbohBOE-1, ARF12KO-1/RbohBOE-2, ARF12KO-1, and WT plants. (O) Chitin-induced ROS burst in the 393DKO-1/RbohBKO, 393DKO-1, and WT plants. Data are means ± SD. (P) Chitin-induced ROS burst in the 393DKOk/ARF12KOk, 393DKOk, ARF12KOk, and WT plants. In all the tests for chitin-induced ROS burst, Data are means ± SD (n = 8, biologically independent samples). (Q) Schematic illustration of the OsmiR393/OsTIR1-OsIAA10-OsARF12-OsRbohB pathway in mediating BPH resistance through cross-talk between auxin and ROS. Student’s t test was carried out in [(B) and (C)] to compare with 9311, in [(E) and (F)] to compare with NIP, and in [(H) and (I)] to compare with ZH11, respectively (*P < 0.05; **P < 0.01). h, hours.

Similar articles

References

    1. Min S., Lee S. W., Choi B.-R., Lee S. H., Kwon D. H., Insecticide resistance monitoring and correlation analysis to select appropriate insecticides against Nilaparvata lugens (Stål), a migratory pest in Korea. J. Asia Pac. Entomol. 17, 711–716 (2014).
    1. Pieterse C. M., Van der Does D., Zamioudis C., Leon-Reyes A., Van Wees S. C., Hormonal modulation of plant immunity. Annu. Rev. Cell Dev. Biol. 28, 489–521 (2012). - PubMed
    1. Calderon-Villalobos L. I., Tan X., Zheng N., Estelle M., Auxin perception—Structural insights. Cold Spring Harb. Perspect. Biol. 2, a005546 (2010). - PMC - PubMed
    1. Cance C., Martin-Arevalillo R., Boubekeur K., Dumas R., Auxin response factors are keys to the many auxin doors. New Phytol. 235, 402–419 (2022). - PubMed
    1. Wang D., Pei K., Fu Y., Sun Z., Li S., Liu H., Tang K., Han B., Tao Y., Genome-wide analysis of the auxin response factors (ARF) gene family in rice (Oryza sativa). Gene 394, 13–24 (2007). - PubMed

LinkOut - more resources