. 2025 May 16;11(20):eadt9837.
doi: 10.1126/sciadv.adt9837. Epub 2025 May 16.

Astrocytes-derived LCN2 triggers EV-A71-induced muscle soreness via accumulating lactate

Affiliations

Astrocytes-derived LCN2 triggers EV-A71-induced muscle soreness via accumulating lactate

Qiao You et al. Sci Adv. .

Abstract

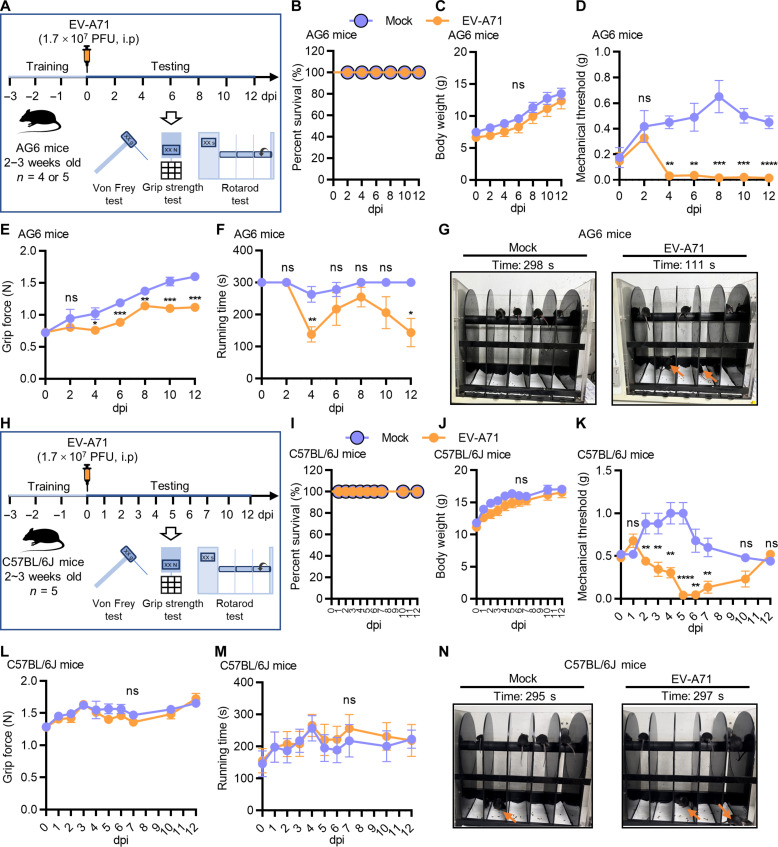
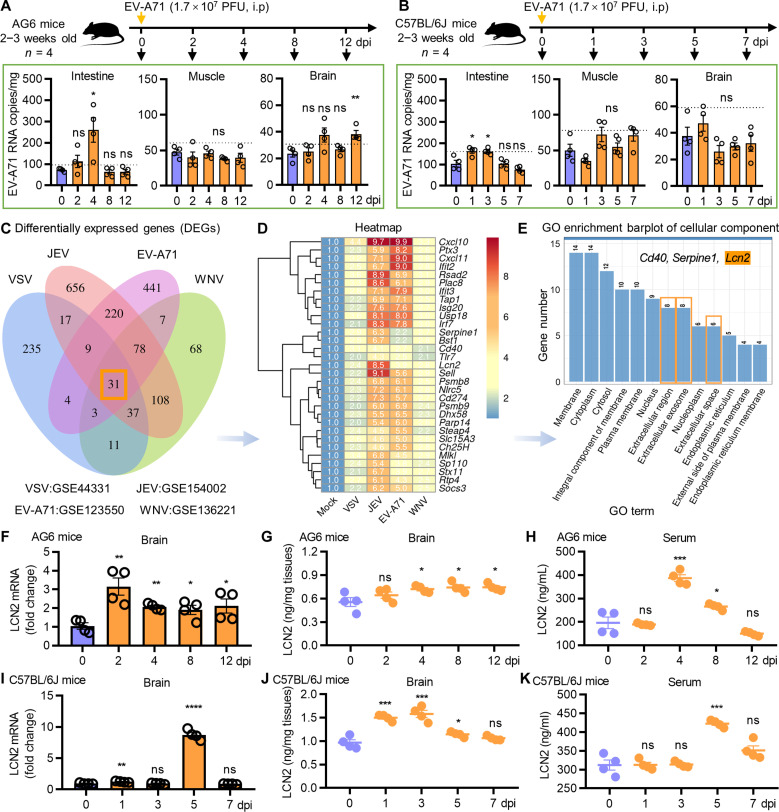
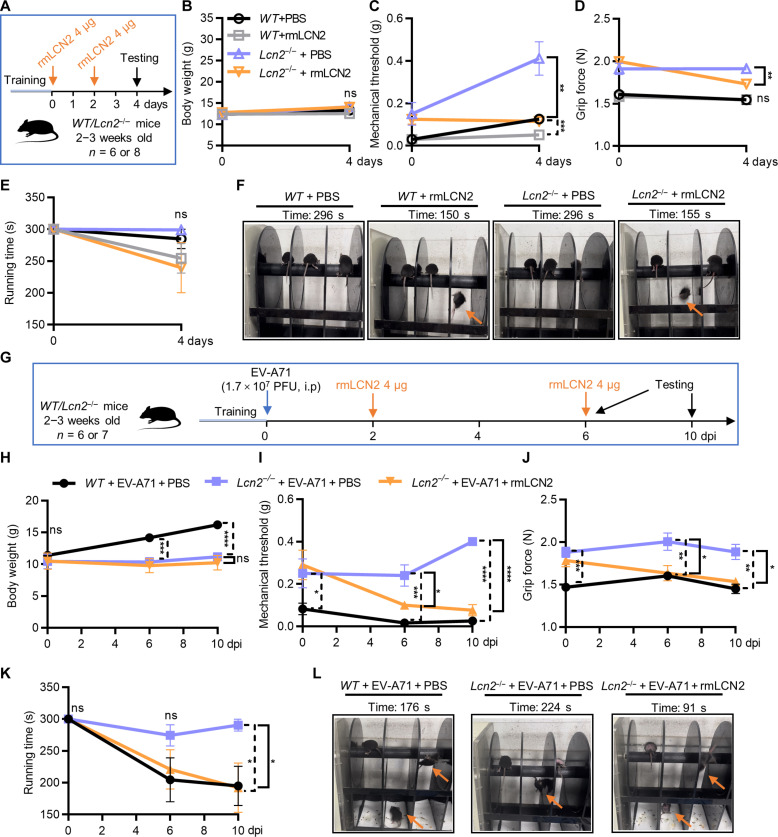
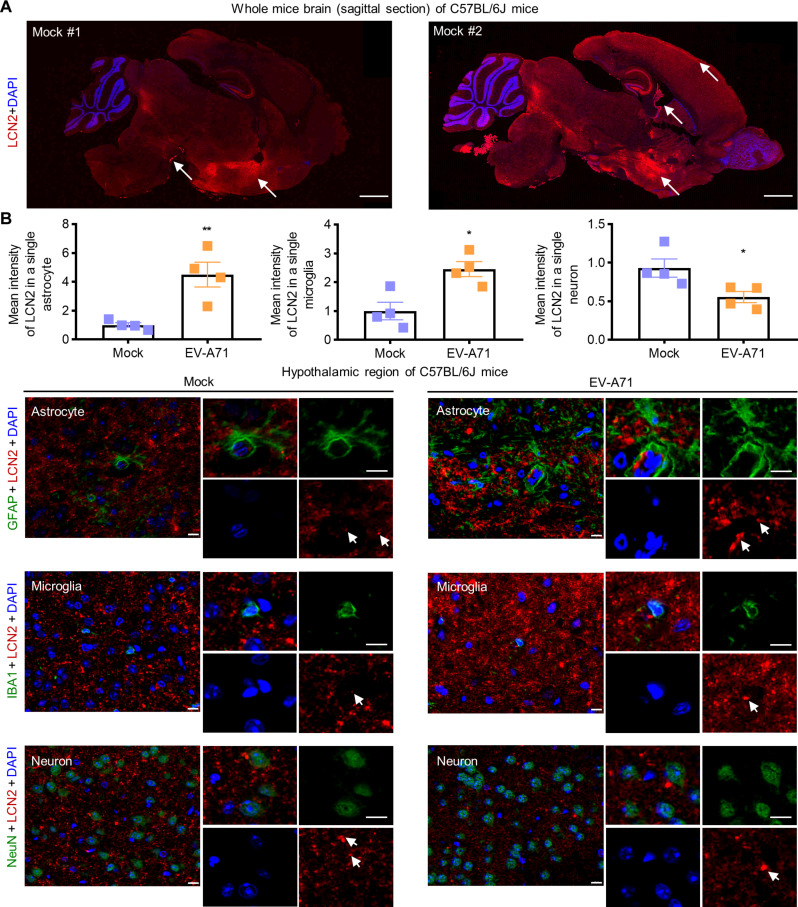
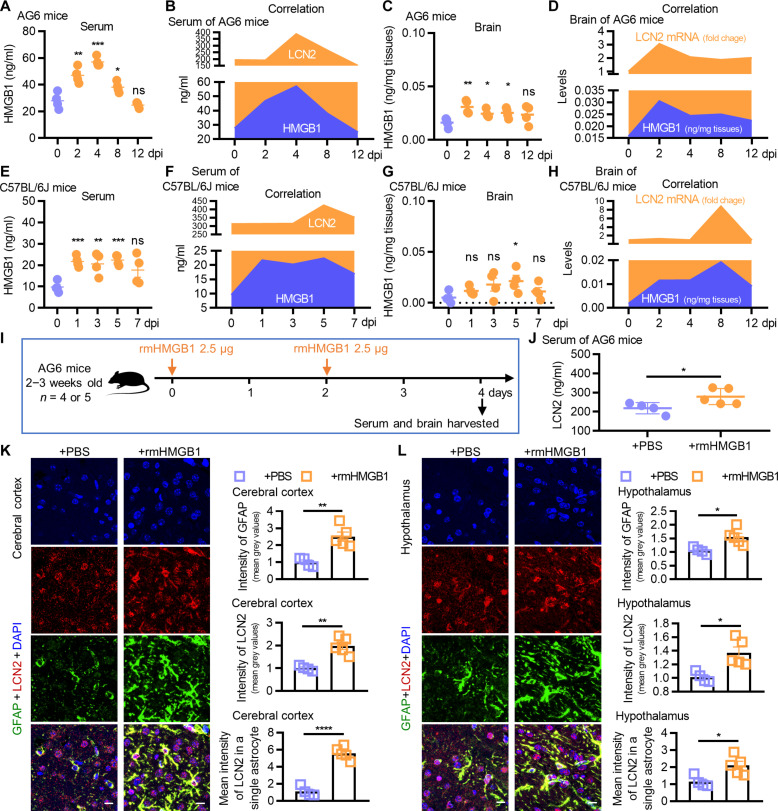
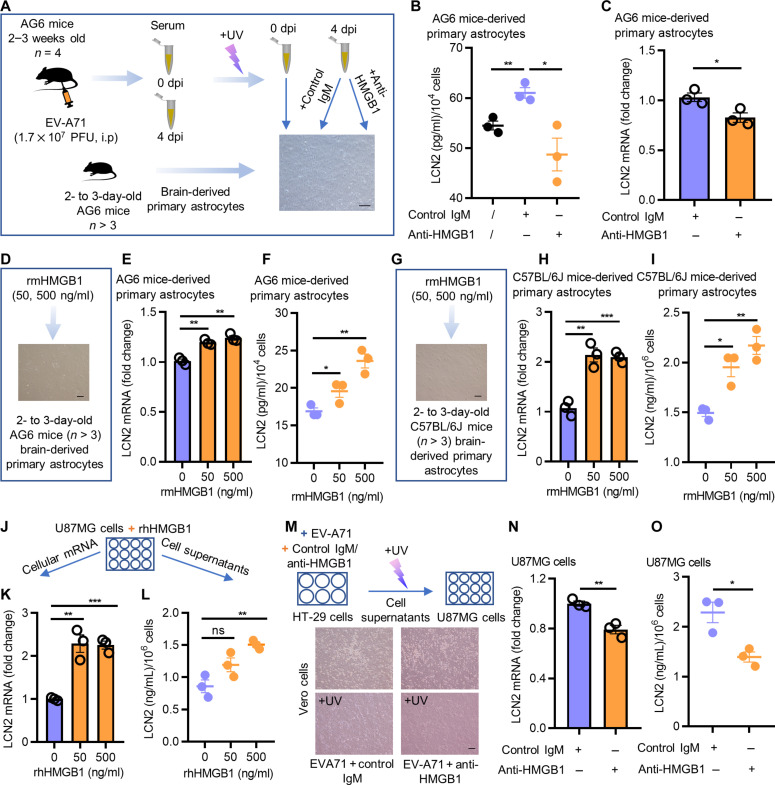
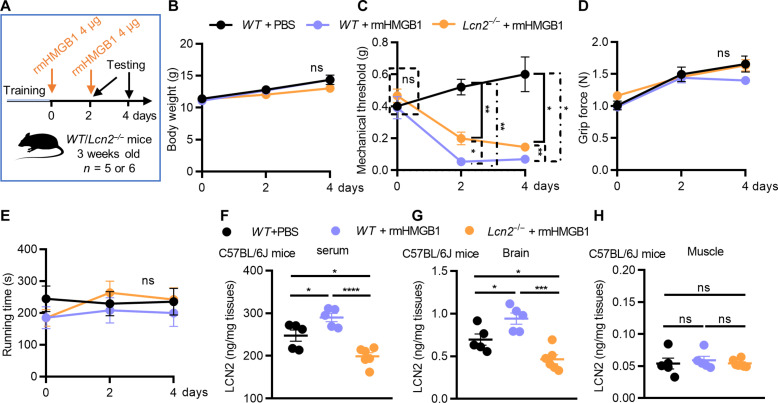
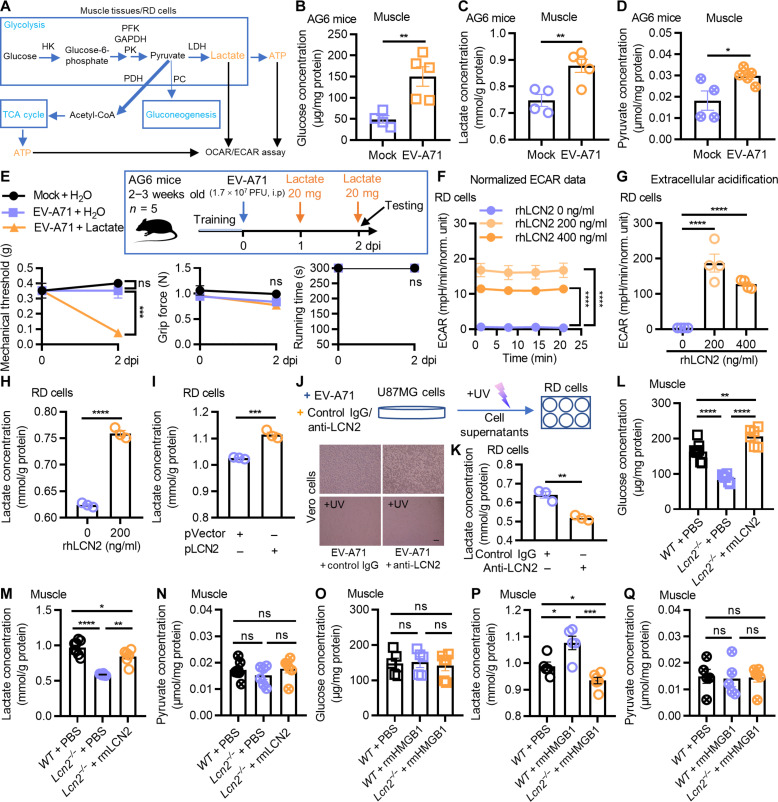
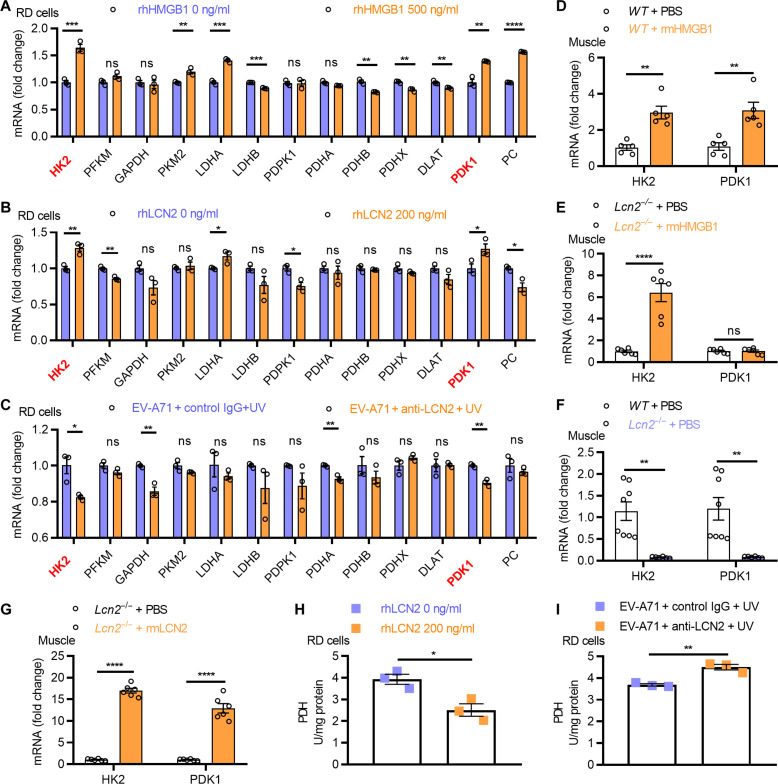
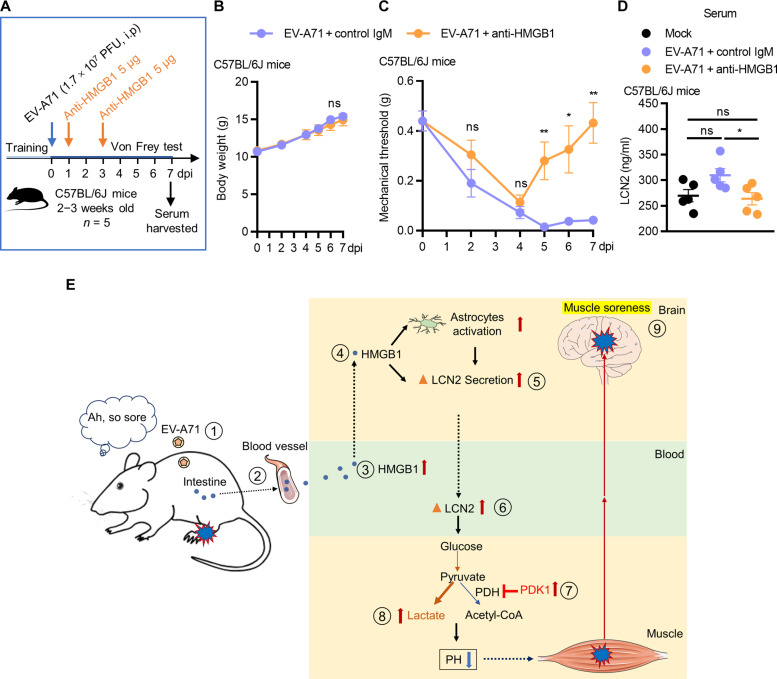
Viral muscle soreness (VMS) is a common feature during acute viral infections, including those caused by enteroviruses, and it substantially diminishes patients' quality of life. At present, we aim to establish the "brain-muscle" axis to explore the underlying mechanisms of VMS. We initially observed that diminished pain threshold occurred in enterovirus A71 (EV-A71)-infected C57BL/6J and AG6 mice. Subsequently, RNA sequencing data showed that lipocalin 2 (LCN2) was up-regulated during multiple viral infections, including EV-A71, Japanese encephalitis virus, vesicular stomatitis virus, and West Nile virus, which all caused VMS. As expected, Lcn2-deficient C57BL/6 J (Lcn2-/-) mice exhibited greater pain tolerance, as shown by stronger grip force and stable motor function after EV-A71 infection. Mechanistically, EV-A71-induced high-mobility group 1 (HMGB1) stimulated astrocyte-derived LCN2 secreted into the circulatory system, which enhanced glycolysis and induced lactate buildup in muscle through increasing pyruvate dehydrogenase kinase 1 (PDK1) expression and decreasing pyruvate dehydrogenase (PDH) activity. Together, HMGB1/LCN2/PDK1/lactate pathway in the brain-muscle axis promoted VMS development.


Figures

Fig. 1.
Fig. 1.. EV-A71 infection induced muscle soreness in mice.
(A) Experimental design for EV-A71–infected muscle soreness model in AG6 mice. Uninfected mice from the same litter were served as control (mock). n = 4 or 5. (B to F) Percent survival, body weight, mechanical threshold, grip force, and running time on rotarod of mock-infected mice and EV-A71–infected AG6 mice. (G) Records of running on a roller of mock-infected mice and EV-A71–infected AG6 mice at 12 dpi. Orange arrows indicated the dropped mice. (H) Experimental design for EV-A71–infected muscle soreness model in C57BL/6J mice. Uninfected mice from the same litter were served as control (mock). n = 5. (I to M) Percent survival, body weight, mechanical threshold, grip force, and running time on rotarod of mock-infected mice and EV-A71–infected C57BL/6J mice. (N) Records of running on a roller of mock-infected mice and EV-A71–infected C57BL/6J mice at 12 dpi. Error bars represent SEM. ns, not significant; *P < 0.05; **P < 0.01; ***P < 0.001; and ****P < 0.0001.
Fig. 2.
Fig. 2.. LCN2 was secreted from brain following EV-A71 infection.
(A) Experimental design for EV-A71–infected AG6 mice. EV-A71 RNA copies in harvested intestine, muscle, and brain tissues were quantified by absolute quantitative polymerase chain reaction (qPCR). n = 4. (B) Experimental design for EV-A71–infected C57BL/6J mice. EV-A71 RNA copies in harvested intestine, muscle, and brain tissues were quantified by absolute qPCR. n = 4. (C) Wayne’s map showed the up-regulated DEGs numbers from VSV/JEV/EV-A71/WNV-related datasets in GEO. (D) Heatmap showed the 31 common up-regulated DEGs between mock-infected and VSV/JEV/EV-A71/WNV–infected mouse brain. The numbers in columns mean the logarithmic value of the average relative expression of genes of virus-infected group to mock-infected group. (E) GO enrichment barplot showed the cellular component of 31 common DEGs. The listed three genes were all included in the groups labeled by the orange box. (F) LCN2 mRNA levels in brain tissues from EV-A71–infected AG6 mice were quantified by qPCR, normalized to β actin. (G and H) LCN2 protein levels in the brain homogenization or serum of EV-A71–infected AG6 mice were determined by enzyme-linked immunosorbent assay (ELISA). (I) LCN2 mRNA levels in brain tissues from EV-A71–infected C57BL/6J mice were quantified by qPCR, normalized to β actin. (J and K) LCN2 protein levels in the brain homogenization or serum of EV-A71–infected C57BL/6J mice were determined by ELISA. Error bars represent SEM. ns, not significant, *P < 0.05, **P < 0.01, ***P < 0.001, and ****P < 0.0001.
Fig. 3.
Fig. 3.. LCN2 mediated muscle soreness following EV-A71 infection.
(A) Experimental design for rmLCN2-stimulated mice model. Phosphate-buffered saline (PBS) injected mice were served as control. n = 6 or 8. (B to F) Body weight, mechanical threshold, grip force, running time on the roller, and the records of running on a roller of WT mice with PBS injection, WT mice with rmLCN2 injection, Lcn2−/− mice with PBS injection, and Lcn2−/− mice with rmLCN2 injection. (G) Experimental design for rmLCN2-stimulated and EV-A71–infected mice model. n = 6 or 7. (H to L) Body weight, mechanical threshold, grip force, running time on the roller, and the records of running on a roller of WT mice with EV-A71 infection and PBS injection, Lcn2−/− mice with EV-A71 infection and PBS injection, and Lcn2−/− mice with EV-A71 infection and rmLCN2 injection. Error bars represent SEM. ns, not significant; *P < 0.05, **P < 0.01, ***P < 0.001, and ****P < 0.0001.
Fig. 4.
Fig. 4.. LCN2 was secreted from astrocytes in brain.
(A) Brain slices of mock-infected C57BL/67 mice were immunostained with antibodies against LCN2 (red). The nuclei were stained with 4′,6-diamidino-2-phenylindole (DAPI). Scale bars, 1000 μm. White arrows point to regions with abundant LCN2 expression. (B) Astrocytes, microglia, and neurons in the hypothalamic region of mock-infected and EV-A71–infected (harvested at 5 dpi) C57BL/6J mice (n = 4) were immunostained with antibodies against astrocyte-specific marker glial fibrillary acidic protein (GFAP) (green), microglia-specific marker ionized calcium binding adaptor molecule 1 (IBA1) (green), neuron-specific marker NeuN (green), and LCN2 (red). The nuclei were stained with DAPI. The scale bars in images and magnified images are 10 μm. The mean fluorescence intensity of LCN2 in individual astrocyte, microglia, and neuron (10 randomly selected cells) was quantified. Error bars represent SEM. *P < 0.05 and **P < 0.01.
Fig. 5.
Fig. 5.. HMGB1 was associated with the secretion of LCN2 from astrocytes.
(A) HMGB1 protein levels in the serum of EV-A71-infected AG6 mice were determined by ELISA. (B) Correlation of HMGB1 and LCN2 levels in the serum of EV-A71-infected AG6 mice. (C) HMGB1 protein levels in the brain of EV-A71–infected AG6 mice were determined by ELISA. (D) Correlation of HMGB1 protein levels and LCN2 mRNA levels in the brain of EV-A71–infected AG6 mice. (E) HMGB1 protein levels in the serum of EV-A71–infected C57BL/6J mice were determined by ELISA. (F) Correlation of HMGB1 and LCN2 levels in the serum of EV-A71–infected C57BL/6J mice. (G) HMGB1 protein levels in the brain of EV-A71–infected C57BL/6J mice were determined by ELISA. (H) Correlation of HMGB1 protein levels and LCN2 mRNA levels in the brain of EV-A71–infected C57BL/6J mice. (I) Experimental design for rmHMGB1-stimulated AG6 mice model. PBS treatment was as control. n = 4 or 5. (J) LCN2 protein levels in the serum of rmHMGB1-stimulated mice on day 4 were determined by ELISA. (K and L) Cerebral cortex and hypothalamus of the brain tissues were immunostained with LCN2 antibodies (red) and astrocyte marker GFAP antibodies (green). The nuclei were stained with DAPI (blue). Scale bars, 10 μm. The intensity of GFAP and LCN2 and the mean intensity of LCN2 in individual astrocyte (10 randomly selected cells) were quantified by ImageJ software. Error bars represent SEM. ns, not significant; *P < 0.05, **P < 0.01, ***P < 0.001, and ****P < 0.0001.
Fig. 6.
Fig. 6.. HMGB1 promoted LCN2 secretion from astrocytes.
(A to C) Experimental design for the neutralization of HMGB1 in EV-A71–infected mouse serum. Scale bar, 100 μm. The LCN2 levels in the cell supernatants of mouse-derived primary astrocytes were detected by ELISA. The LCN2 mRNA of primary astrocytes was quantified by qPCR, normalized by β actin. (D to F) rmHMGB1 protein was added to AG6 mice–derived primary astrocytes for 24 hours, then the cells were harvested for qPCR assay and normalized by β actin, the cell supernatants were collected for ELISA. Scale bar, 100 μm. (G to I) rmHMGB1 protein was added to C67BL/6J mice–derived primary astrocytes for 24 hours, then the cells were harvested for qPCR assay and normalized by β actin, and the cell supernatants were collected for ELISA. Scale bar, 100 μm. (J to L) U87MG cells were stimulated with rhHMGB1 protein for 24 hours, then the cellular mRNA was harvested for qPCR assay and normalized by β actin, and the cell supernatants were collected for ELISA. (M to O) Experimental design for the neutralization of HMGB1 in EV-A71–infected HT-29 cell supernatants. Scale bar, 100 μm. The LCN2 mRNA levels in U87MG cells were quantified by qPCR and normalized by β actin. The LCN2 protein levels in the cell supernatants of U87MG cells were detected by ELISA. Error bars represent SEM. ns, not significant; *P < 0.05, **P < 0.01, and ***P < 0.001.
Fig. 7.
Fig. 7.. HMGB1/LCN2 axis mediated muscle soreness.
(A) Experimental design for rmHMGB1-stimulated mice model. PBS injection was served as control. n = 5 or 6. (B to E) Body weight, mechanical threshold, grip force, and running time on the roller of WT mice with PBS injection or rmHMGB1 injection and Lcn2−/− mice with rmHMGB1 injection. (F to H) The LCN2 protein levels in the serum, brain, and muscle (harvested on day 4) of WT mice with PBS injection or rmHMGB1 injection and Lcn2−/− mice with rmHMGB1 injection. Error bars represent SEM. ns, not significant; *P < 0.05, ***P < 0.001, and ****P < 0.0001.
Fig. 8.
Fig. 8.. HMGB1/LCN2 axis induced lactate accumulation to mediate EV-A71–induced muscle soreness.
(A) Diagram of the glycolysis pathway and the production of lactate and ATP. (B to D) Glucose, lactate, and pyruvate concentration in muscle tissues of mock-infected and EV-A71–infected AG6 mice harvested at 4 dpi were detected by biochemical testing. n = 4 or 5. (E) Experimental design of lactate-stimulated and EV-A71–infected mice model. At 2 dpi, the mechanical threshold, grip force, and the running time on the roller of the mice were tested. n = 5. (F and G) RD cells in 96-well were stimulated with rhLCN2 for 24 hours, then the ECAR value was measured by ECAR/OCR assay. n = 4. (H) RD cells were stimulated with rhLCN2 for 24 hours, and then the lactate concentration in cells was detected by biochemical testing. (I) RD cells were empty vector–transfected or plasmid encoding LCN2 (pLCN2)-transfected for 30 hours, and then the lactate concentration in cells was detected by biochemical testing. (J and K) Experimental design of the neutralization of HMGB1 in EV-A71–infected U87MG supernatants. Scale bar, 100 μm. The lactate concentration in RD cells was determined by biochemical testing. (L to N) The tested muscle tissues were from WT mice, who were treated with PBS injection, and Lcn2−/− mice, who were treated with PBS injection or rmLCN2 protein injection in Fig. 3A. The glucose, lactate, and pyruvate concentration in muscle were determined by biochemical testing. n = 6 or 8. (O to Q) Tested muscle tissues were from WT mice, who were injected with PBS or rmHMGB1, and Lcn2−/− mice, who were injected with rmHMGB1 protein in Fig. 7A. The glucose, lactate, and pyruvate concentration in muscle were determined by biochemical testing. n = 5 or 6. Error bars represent SEM. ns, not significant; *P < 0.05, **P < 0.01, ***P < 0.001, and ****P < 0.0001.
Fig. 9.
Fig. 9.. HMGB1/LCN2 axis induced lactate accumulation via up-regulating PDK1 expression and reducing PDH activity.
(A) RD cells were stimulated with rhHMGB1 for 24 hours, and then the mRNA levels of muscle-specific and glycolysis-associated genes including HK2, PFKM, GAPDH, PKM2, LDHA, LDHB, PDPK1, PDHA, PDHB, PDHX, DLAT, PDK1 and PC were quantified by qPCR and normalized by β actin. (B) RD cells were stimulated with rhLCN2 for 24 hours, and then the mRNA levels of muscle-specific and glycolysis-associated genes were quantified by qPCR and normalized by β actin. (C) Cell supernatants of EV-A71–infected and anti-LCN2/control IgG–incubated U87MG cells were treated with UV treatment and then were added to RD cells for 24 hours. The mRNA levels of the muscle-specific and glycolysis-associated genes were quantified by qPCR and normalized by β actin. (D to G) mRNA levels of HK2 and PDK1 in the muscle of WT mice with PBS or rmHMGB1 injection, the muscle of Lcn2−/− mice with PBS or rmHMGB1 injection, the muscle of WT mice with PBS injection and Lcn2−/− mice with PBS injection, and the muscle of Lcn2−/− mice with PBS injection or rmLCN2 protein injection were quantified by qPCR and normalized by β actin. (H) RD cells were stimulated with rhLCN2 for 24 hours, and then the enzyme activity of PDH in RD cells was detected by biochemical activity examination. (I) Cell supernatants of EV-A71–infected and anti-LCN2/control IgG–incubated U87MG cells were treated with UV treatment and then added to RD cells for 24 hours. The enzyme activity of PDH in RD cells was detected by biochemical activity examination. Error bars represent SEM. ns, not significant; *P < 0.05, **P < 0.01, ***P < 0.001, and ****P < 0.0001.
Fig. 10.
Fig. 10.. Anti-HMGB1 addition attenuated VMS after EV-A71 infection.
(A) Experimental design of anti-HMGB1–treated mice model. Control IgM injection was served as control. n = 5. (B and C) Body weight and mechanical threshold of C57BL/6J mice with control IgM injection or anti-HMGB1 injection. (D) LCN2 protein levels in harvested serum of C57BL/6J mice with control IgM injection or anti-HMGB1 injection at 7 dpi were determined by ELISA. Mock-infected mice serum was as control. Error bars represent SEM. ns, not significant; *P < 0.05 and **P < 0.01. (E) EV-A71 infection induced HMGB1 released to peripheral blood, and released HMGB1 promoted the secretion of LCN2 from activated astrocytes into the circulatory system. Mechanically, HMGB1/LCN2 axis mediated muscle soreness and promoted lactate accumulation in the muscle by up-regulating PDK1 expression and decreasing PDH activity.

Similar articles

Cited by

References

    1. Ślebioda Z., Dorocka-Bobkowska B., Hand, foot and mouth disease as an emerging public health problem: Case report of familial child-to-adult transmission. Dent. Med. Probl. 55, 99–104 (2018). - PubMed
    1. Poenaru S., Abdallah S. J., Corrales-Medina V., Cowan J., COVID-19 and post-infectious myalgic encephalomyelitis/chronic fatigue syndrome: A narrative review. Ther. Adv. Infect. Dis. 8, 20499361211009385 (2021). - PMC - PubMed
    1. Bartholomeeusen K., Daniel M., LaBeaud D. A., Gasque P., Peeling R. W., Stephenson K. E., Ng L. F. P., Ariën K. K., Chikungunya fever. Nat. Rev. Dis. Primers 9, 17 (2023). - PMC - PubMed
    1. Sharp T. M., Fischer M., Muñoz-Jordán J. L., Paz-Bailey G., Staples J. E., Gregory C. J., Waterman S. H., Dengue and Zika virus diagnostic testing for patients with a clinically compatible illness and risk for infection with both viruses. MMWR Recomm. Rep. 68, 1–10 (2019). - PMC - PubMed
    1. Wang F., Wu Y., Jiao J., Wang J., Ge Z., Risk factors and clinical characteristics of severe fever with thrombocytopenia syndrome. Int. J. Gen. Med. 13, 1661–1667 (2020). - PMC - PubMed